
Read and download the CBSE Class 10 Mathematics Statistics Worksheet Set 04 in PDF format. We have provided exhaustive and printable Class 10 Mathematics worksheets for Chapter 13 Statistics, designed by expert teachers. These resources align with the 2026-27 syllabus and examination patterns issued by NCERT, CBSE, and KVS, helping students master all important chapter topics.
Chapter-wise Worksheet for Class 10 Mathematics Chapter 13 Statistics
Students of Class 10 should use this Mathematics practice paper to check their understanding of Chapter 13 Statistics as it includes essential problems and detailed solutions. Regular self-testing with these will help you achieve higher marks in your school tests and final examinations.
Class 10 Mathematics Chapter 13 Statistics Worksheet with Answers
STATISTICS
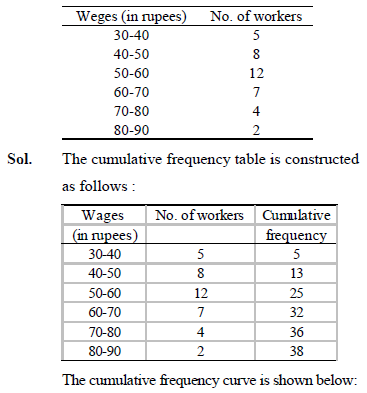
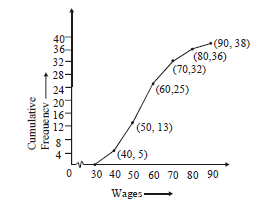

Q.-
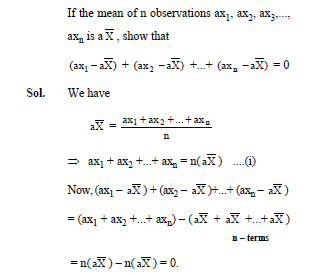
Q.-
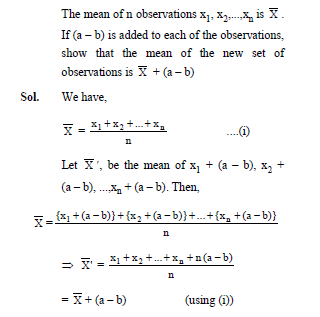
Q.-
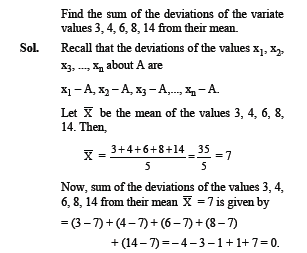
Q.-

More question-
1.The empirical relationship between the three measures of central tendency is…………………
2. …………………. Is called a positional average.
3. The point of intersection of the less than ogive and the more than ogive gives us the ……………..
4.The point of intersection of the less than ogive and the more than ogive is (36.5,15).The median is………
5.The median and the mode of a data are 62 and 64 respectively. The mean is………..
6. The median and the mean of a data are 52 and 50 respectively. The mode is………..
7. The mean and the mode of a data are 54 and 57 respectively. The median is………..
8.Change the following data to a frequency distribution table:
Less than 10
Less than 20
Less than 30
Less than 40
Less than 50
Less than 60
Less than 70
Less than 80
7
16
23
32
42
53
60
75
9. Change the following data to a frequency distribution table:
0 and above
10 and above
20 and above
30 and above
40 and above
50 and above
60 and above
70 and above
100
92
87
75
52
28
16
4
10. The mean of the following data is 38.2. Find the missing frequencies f1 and f2 if the total frequency is 50.
Classes
0-10
10-20
20-30
30-40
40-50
50-60
60-70
Frequency
4
4
F1
10
F2
8
5
(Ans. F1 = 7,f2=12)
11.The mean of the following frequency is 8. Find the value of p.
X(variable)
3
5
7
9
11
13
F(frequency)
6
8
15
P
8
4
(Ans p= 25)
Please click the below link to access CBSE Class 10 Mathematics Statistics Worksheet Set D
Free study material for Mathematics
CBSE Mathematics Class 10 Chapter 13 Statistics Worksheet
Students can use the practice questions and answers provided above for Chapter 13 Statistics to prepare for their upcoming school tests. This resource is designed by expert teachers as per the latest 2026 syllabus released by CBSE for Class 10. We suggest that Class 10 students solve these questions daily for a strong foundation in Mathematics.
Chapter 13 Statistics Solutions & NCERT Alignment
Our expert teachers have referred to the latest NCERT book for Class 10 Mathematics to create these exercises. After solving the questions you should compare your answers with our detailed solutions as they have been designed by expert teachers. You will understand the correct way to write answers for the CBSE exams. You can also see above MCQ questions for Mathematics to cover every important topic in the chapter.
Class 10 Exam Preparation Strategy
Regular practice of this Class 10 Mathematics study material helps you to be familiar with the most regularly asked exam topics. If you find any topic in Chapter 13 Statistics difficult then you can refer to our NCERT solutions for Class 10 Mathematics. All revision sheets and printable assignments on studiestoday.com are free and updated to help students get better scores in their school examinations.
FAQs
You can download the latest chapter-wise printable worksheets for Class 10 Mathematics Chapter 13 Statistics for free from StudiesToday.com. These have been made as per the latest CBSE curriculum for this academic year.
Yes, Class 10 Mathematics worksheets for Chapter 13 Statistics focus on activity-based learning and also competency-style questions. This helps students to apply theoretical knowledge to practical scenarios.
Yes, we have provided solved worksheets for Class 10 Mathematics Chapter 13 Statistics to help students verify their answers instantly.
Yes, our Class 10 Mathematics test sheets are mobile-friendly PDFs and can be printed by teachers for classroom.
For Chapter 13 Statistics, regular practice with our worksheets will improve question-handling speed and help students understand all technical terms and diagrams.