
Read and download the CBSE Class 10 Mathematics Statistics Worksheet Set 01 in PDF format. We have provided exhaustive and printable Class 10 Mathematics worksheets for Chapter 13 Statistics, designed by expert teachers. These resources align with the 2026-27 syllabus and examination patterns issued by NCERT, CBSE, and KVS, helping students master all important chapter topics.
Chapter-wise Worksheet for Class 10 Mathematics Chapter 13 Statistics
Students of Class 10 should use this Mathematics practice paper to check their understanding of Chapter 13 Statistics as it includes essential problems and detailed solutions. Regular self-testing with these will help you achieve higher marks in your school tests and final examinations.
Class 10 Mathematics Chapter 13 Statistics Worksheet with Answers
Case Based MCQs
Case I : Read the following passage and answer the questions
Toll Tax Collection
On a particular day, National Highway Authority of India (NHAI) checked the toll tax collection of a particular toll plaza in Rajasthan.
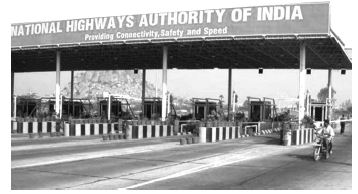
The following table shows the toll tax paid by drivers and the number of vehicles on that particular day.
| Toll tax (in ₹) | 30-40 | 40-50 | 50-60 | 60-70 | 70-80 |
| Number of vehicles | 80 | 110 | 120 | 70 | 40 |
Question. If A is taken as assumed mean, then the possible value of A is
(a) 32
(b) 42
(c) 85
(d) 55
Answer: D
Question. If xi’s denote the class marks and di’s denote the deviation of assumed mean (A) from xi’s, then the minimum value of |di| is
(a) –200
(b) –100
(c) 0
(d) 100
Answer: C
Question. The mean of toll tax received by NHAI by assumed mean method is
(a) ₹ 52
(b) ₹ 52.14
(c) ₹ 52.50
(d) ₹ 53.50
Answer: B
Question. The mean of toll tax received by NHAI by direct method is
(a) equal to the mean of toll tax received by NHAI by assumed mean method
(b) greater than the mean of toll tax received by NHAI by assumed mean method
(c) less than the mean of toll tax received by NHAI by assumed mean method
(d) can't say
Answer: A
Question. The average toll tax received by NHAI in a day, from that particular toll plaza, is
(a) ₹ 21000.60
(b) ₹ 21900.80
(c) ₹ 30000.90
(d) ₹ 21898.80
Answer: D
Case II : Read the following passage and answer the questions
Distance Analysis of Public Transport Buses
Transport department of a city wants to buy some Electric buses for the city. For which they want to analyse the distance travelled by existing public transport buses in a day.
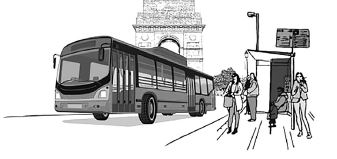
The following data shows the distance travelled by 60 existing public transport buses in a day.
| Daily distance travelled (in km) | 200- 209 | 210-219 | 220-229 | 230-239 | 240-249 |
| Number of buses | 4 | 14 | 26 | 10 | 6 |
Question. The upper limit of a class and lower limit of its succeeding class is differ by
(a) 9
(b) 1
(c) 10
(d) none of the options
Answer: B
Question. The median class is
(a) 229.5-239.5
(b) 230-239
(c) 220-229
(d) 219.5-229.5
Answer: D
Question. The cumulative frequency of the class preceding the median class is
(a) 14
(b) 18
(c) 26
(d) 10
Answer: B
Question. The median of the distance travelled is
(a) 222 km
(b) 225 km
(c) 223 km
(d) none of the options
Answer: D
Question. If the mode of the distance travelled is 223.78 km, then mean of the distance travelled by the bus is
(a) 225 km
(b) 220 km
(c) 230.29 km
(d) 224.29 km
Answer: D
Case III : Read the following passage and answer the questions
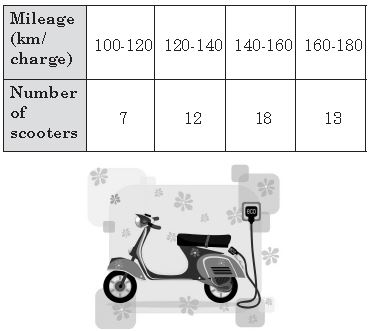
Electric Scooter Manufacturing Company
An electric scooter manufacturing company wants to declare the mileage of their electric scooters. For this, they recorded the mileage (km/charge) of 50 scooters of the same model. Details of which are given in the following table.
Question. The average mileage is
(a) 140 km/charge
(b) 150 km/charge
(c) 130 km/charge
(d) 144.8 km/charge
Answer: D
Question. The modal value of the given data is
(a) 150
(b) 150.91
(c) 145.6
(d) 140.9
Answer: B
Question. The median value of the given data is
(a) 140
(b) 146.67
(c) 130
(d) 136.6
Answer: B
Question. Assumed mean method is useful in determining the
(a) Mean
(b) Median
(c) Mode
(d) All of these
Answer: A
Question. The manufacturer can claim that the mileage for his scooter is
(a) 144 km/charge
(b) 155 km/charge
(c) 165 km/charge
(d) 175 km/charge
Answer: A
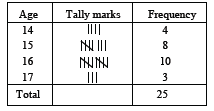
Short Answer Type Questions
Answer: Frequency distribution of ages of 25 students
Students must free download and practice these worksheets to gain more marks in exams. CBSE Class 10 Mathematics Statistics Worksheet Set A
Free study material for Mathematics
CBSE Mathematics Class 10 Chapter 13 Statistics Worksheet
Students can use the practice questions and answers provided above for Chapter 13 Statistics to prepare for their upcoming school tests. This resource is designed by expert teachers as per the latest 2026 syllabus released by CBSE for Class 10. We suggest that Class 10 students solve these questions daily for a strong foundation in Mathematics.
Chapter 13 Statistics Solutions & NCERT Alignment
Our expert teachers have referred to the latest NCERT book for Class 10 Mathematics to create these exercises. After solving the questions you should compare your answers with our detailed solutions as they have been designed by expert teachers. You will understand the correct way to write answers for the CBSE exams. You can also see above MCQ questions for Mathematics to cover every important topic in the chapter.
Class 10 Exam Preparation Strategy
Regular practice of this Class 10 Mathematics study material helps you to be familiar with the most regularly asked exam topics. If you find any topic in Chapter 13 Statistics difficult then you can refer to our NCERT solutions for Class 10 Mathematics. All revision sheets and printable assignments on studiestoday.com are free and updated to help students get better scores in their school examinations.
FAQs
You can download the latest chapter-wise printable worksheets for Class 10 Mathematics Chapter 13 Statistics for free from StudiesToday.com. These have been made as per the latest CBSE curriculum for this academic year.
Yes, Class 10 Mathematics worksheets for Chapter 13 Statistics focus on activity-based learning and also competency-style questions. This helps students to apply theoretical knowledge to practical scenarios.
Yes, we have provided solved worksheets for Class 10 Mathematics Chapter 13 Statistics to help students verify their answers instantly.
Yes, our Class 10 Mathematics test sheets are mobile-friendly PDFs and can be printed by teachers for classroom.
For Chapter 13 Statistics, regular practice with our worksheets will improve question-handling speed and help students understand all technical terms and diagrams.