

Class 10 Mathematics Practice Sheet: CBSE Class 10 Mathematics Statistics Worksheet Set 06
Review targeted academic worksheets with the CBSE Class 10 Mathematics Statistics Worksheet Set 06. Built according to official educational standards for the 2026-27 term, these downloadable Class 10 Mathematics resources support effective daily practice and detailed self-evaluation for Chapter 13 Statistics.
Download Chapter 13 Statistics Worksheet PDF with Answers
Navigate directly to the solved Mathematics worksheets using the digital viewer below. Each practice set includes detailed step-by-step solutions, allowing students to instantly cross-check their work and identify areas requiring further revision.
STATISTICS
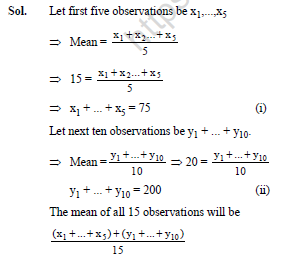
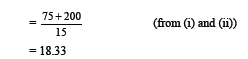
Q.- If the mean of 5 observations is 15 and that of another 10 observations is 20, find the mean of all 15 observations
Q.-

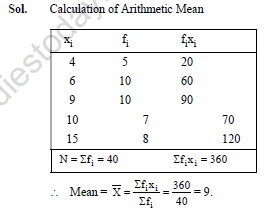
Q.- Find the mean of the following distribution :
Question 1. The empirical relationship between the three measures of central tendency is…………………
Answer: The empirical relationship between the three primary measures of central tendency is:
\( \text{Mode} = 3 \ \text{Median} - 2 \ \text{Mean} \)
In simple words: The mode of a dataset can be found by multiplying its median by three and then subtracting twice its mean value.
Exam Tip: Memorize this formula well, as it is frequently asked in multiple-choice questions or used to find a third measure when the other two are given.
Question 2. …………………. Is called a positional average.
Answer: Median is called a positional average.
In simple words: The median is known as a positional average because its value depends solely on its position in the middle of an ordered list of numbers.
Exam Tip: Remember that unlike the arithmetic mean, the median is not affected by extreme values (outliers) in the dataset because it is a positional measure of central tendency.
Question 3. The point of intersection of the less than ogive and the more than ogive gives us the ……………..
Answer: Median
In simple words: The exact point where the less-than and more-than cumulative frequency curves cross each other points directly down to the median on the horizontal axis.
Exam Tip: If the intersection point of the two ogives is \( (x, y) \), then the abscissa \( x \) always represents the median, and the ordinate \( y \) represents \( \frac{N}{2} \).
Question 4. The point of intersection of the less than ogive and the more than ogive is (36.5,15).The median is………
Answer: 36.5
In simple words: Since the horizontal coordinate of the intersection point represents the median, the median value is directly equal to 36.5.
Exam Tip: Do not confuse the coordinates; the first coordinate \( x \) in \( (x, y) \) is always the median, while the second coordinate \( y \) represents half of the total frequency \( \frac{N}{2} \).
Question 5. The median and the mode of a data are 62 and 64 respectively. The mean is………..
Answer: Given:
\( \text{Median} = 62 \)
\( \text{Mode} = 64 \)
Using the empirical relationship formula:
\( \text{Mode} = 3 \ \text{Median} - 2 \ \text{Mean} \)
\( \implies 64 = 3(62) - 2 \ \text{Mean} \)
\( \implies 64 = 186 - 2 \ \text{Mean} \)
\( \implies 2 \ \text{Mean} = 186 - 64 \)
\( \implies 2 \ \text{Mean} = 122 \)
\( \implies \text{Mean} = 61 \)
In simple words: By putting the median of 62 and mode of 64 into our formula, we find that the mean of the data is 61.
Exam Tip: Be careful with transposition signs when moving terms across the equals sign to avoid simple arithmetic errors.
Question 6. The median and the mean of a data are 52 and 50 respectively. The mode is………..
Answer: Given:
\( \text{Median} = 52 \)
\( \text{Mean} = 50 \)
Using the empirical relationship formula:
\( \text{Mode} = 3 \ \text{Median} - 2 \ \text{Mean} \)
\( \implies \text{Mode} = 3(52) - 2(50) \)
\( \implies \text{Mode} = 156 - 100 \)
\( \implies \text{Mode} = 56 \)
In simple words: We find the mode by multiplying the median by 3 and subtracting twice the mean, which gives us 56.
Exam Tip: Direct multiplication and subtraction is the easiest way to solve these problems. Always double-check your arithmetic steps.
Question 7. The mean and the mode of a data are 54 and 57 respectively. The median is………..
Answer: Given:
\( \text{Mean} = 54 \)
\( \text{Mode} = 57 \)
Using the empirical relationship formula:
\( \text{Mode} = 3 \ \text{Median} - 2 \ \text{Mean} \)
\( \implies 57 = 3 \ \text{Median} - 2(54) \)
\( \implies 57 = 3 \ \text{Median} - 108 \)
\( \implies 3 \ \text{Median} = 57 + 108 \)
\( \implies 3 \ \text{Median} = 165 \)
\( \implies \text{Median} = 55 \)
In simple words: Putting our values into the formula gives three times the median as 165, which means the median is 55.
Exam Tip: Ensure that you add 108 to 57 first, before dividing by 3 to find the median value.
Question 8. Change the following data to a frequency distribution table:
| Less than 10 | Less than 20 | Less than 30 | Less than 40 | Less than 50 | Less than 60 | Less than 70 | Less than 80 |
|---|---|---|---|---|---|---|---|
| 7 | 16 | 23 | 32 | 42 | 53 | 60 | 75 |
Answer: To convert this "less than" cumulative frequency distribution into a normal grouped frequency distribution, we subtract the cumulative frequency of each class from the succeeding class:
| Class Interval | Cumulative Frequency (\( cf \)) | Class Frequency (\( f \)) |
|---|---|---|
| 0 - 10 | 7 | 7 |
| 10 - 20 | 16 | \( 16 - 7 = 9 \) |
| 20 - 30 | 23 | \( 23 - 16 = 7 \) |
| 30 - 40 | 32 | \( 32 - 23 = 9 \) |
| 40 - 50 | 42 | \( 42 - 32 = 10 \) |
| 50 - 60 | 53 | \( 53 - 42 = 11 \) |
| 60 - 70 | 60 | \( 60 - 53 = 7 \) |
| 70 - 80 | 75 | \( 75 - 60 = 15 \) |
In simple words: To change a "less than" list into a normal table, we subtract each cumulative total from the one below it to find the individual count for each 10-point interval.
Exam Tip: For the first interval (0-10), the frequency remains the same as the cumulative frequency. For all subsequent intervals, subtract the previous cumulative frequency from the current one.
Question 9. Change the following data to a frequency distribution table:
| 0 and above | 10 and above | 20 and above | 30 and above | 40 and above | 50 and above | 60 and above | 70 and above |
|---|---|---|---|---|---|---|---|
| 100 | 92 | 87 | 75 | 52 | 28 | 16 | 4 |
Answer: To convert this "more than / above" type cumulative frequency distribution to a regular grouped frequency distribution, we subtract the cumulative frequency of the succeeding class from that of the current class:
| Class Interval | Cumulative Frequency | Class Frequency (\( f \)) |
|---|---|---|
| 0 - 10 | 100 | \( 100 - 92 = 8 \) |
| 10 - 20 | 92 | \( 92 - 87 = 5 \) |
| 20 - 30 | 87 | \( 87 - 75 = 12 \) |
| 30 - 40 | 75 | \( 75 - 52 = 23 \) |
| 40 - 50 | 52 | \( 52 - 28 = 24 \) |
| 50 - 60 | 28 | \( 28 - 16 = 12 \) |
| 60 - 70 | 16 | \( 16 - 4 = 12 \) |
| 70 - 80 | 4 | \( 4 \) |
In simple words: To convert an "above" table, subtract the count of the next level from the current level's count. The very last group simply takes its remaining value directly.
Exam Tip: In "more than" type tables, remember that the total cumulative frequency is at the top (100) and the individual frequency of the last class interval (70-80) is simply the value given for "70 and above" (4).
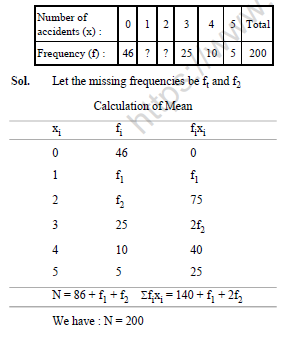
Question 10. The mean of the following data is 38.2. Find the missing frequencies f1 and f2 if the total frequency is 50.
| Classes | 0-10 | 10-20 | 20-30 | 30-40 | 40-50 | 50-60 | 60-70 |
|---|---|---|---|---|---|---|---|
| Frequency | 4 | 4 | F1 | 10 | F2 | 8 | 5 |
Answer: Let us write the table with class marks (\( x_i \)) and \( f_i x_i \):
| Classes | Frequency (\( f_i \)) | Class Mark (\( x_i \)) | \( f_i x_i \) |
|---|---|---|---|
| 0-10 | 4 | 5 | 20 |
| 10-20 | 4 | 15 | 60 |
| 20-30 | f1 | 25 | 25f1 |
| 30-40 | 10 | 35 | 350 |
| 40-50 | f2 | 45 | 45f2 |
| 50-60 | 8 | 55 | 440 |
| 60-70 | 5 | 65 | 325 |
| Total | \( \sum f_i = 31 + f_1 + f_2 \) | - | \( \sum f_i x_i = 1195 + 25f_1 + 45f_2 \) |
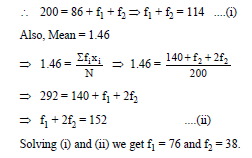
Given that total frequency is 50:
\( \implies 31 + f_1 + f_2 = 50 \)
\( \implies f_1 + f_2 = 19 \) - (Equation 1)
Also, Mean = 38.2. Using the mean formula:
\( \text{Mean} = \frac{\sum f_i x_i}{\sum f_i} \)
\( \implies 38.2 = \frac{1195 + 25f_1 + 45f_2}{50} \)
\( \implies 1195 + 25f_1 + 45f_2 = 38.2 \times 50 \)
\( \implies 1195 + 25f_1 + 45f_2 = 1910 \)
\( \implies 25f_1 + 45f_2 = 715 \)
Dividing by 5:
\( \implies 5f_1 + 9f_2 = 143 \) - (Equation 2)
From Equation 1, \( f_1 = 19 - f_2 \). Substitute this into Equation 2:
\( \implies 5(19 - f_2) + 9f_2 = 143 \)
\( \implies 95 - 5f_2 + 9f_2 = 143 \)
\( \implies 4f_2 = 143 - 95 \)
\( \implies 4f_2 = 48 \implies f_2 = 12 \)
Substitute \( f_2 = 12 \) in Equation 1:
\( \implies f_1 + 12 = 19 \implies f_1 = 7 \)
So, the missing frequencies are \( f_1 = 7 \) and \( f_2 = 12 \).
In simple words: We find the sum of frequencies to write our first equation, and then use the mean formula to get a second equation. Solving these two gives \( f_1 = 7 \) and \( f_2 = 12 \).
Exam Tip: Simplify the coefficients of Equation 2 by dividing all terms by their highest common factor (5) to make manual calculations easier and avoid mistakes.
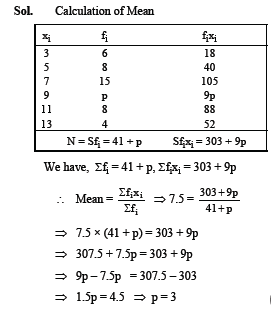
Question 11. The mean of the following frequency is 8. Find the value of p.
| X(variable) | 3 | 5 | 7 | 9 | 11 | 13 |
|---|---|---|---|---|---|---|
| F(frequency) | 6 | 8 | 15 | P | 8 | 4 |
Answer: Let us construct the calculation table for finding the value of \( P \):
| \( x_i \) | \( f_i \) | \( f_i x_i \) |
|---|---|---|
| 3 | 6 | 18 |
| 5 | 8 | 40 |
| 7 | 15 | 105 |
| 9 | P | 9P |
| 11 | 8 | 88 |
| 13 | 4 | 52 |
| Total | \( \sum f_i = 41 + P \) | \( \sum f_i x_i = 303 + 9P \) |
Since the mean is given as 8:
\( \text{Mean} = \frac{\sum f_i x_i}{\sum f_i} \)
\( \implies 8 = \frac{303 + 9P}{41 + P} \)
\( \implies 8(41 + P) = 303 + 9P \)
\( \implies 328 + 8P = 303 + 9P \)
\( \implies 9P - 8P = 328 - 303 \)
\( \implies P = 25 \)
So, the value of P is 25.
In simple words: Multiply each value of X by its frequency, sum them up, and divide by the total frequency. Setting this equal to 8 allows us to solve for P, which is 25.
Exam Tip: Be careful to keep the variable term \( 9P \) separate from the constant numbers when summing up the \( f_i x_i \) column.
Question 12. Draw the less than ogive and decide the median.
| Classes | 50-60 | 60-70 | 70-80 | 80-90 | 90-100 |
|---|---|---|---|---|---|
| Frequency | 3 | 5 | 9 | 12 | 6 |
Answer: Let us prepare the cumulative frequency table for the less-than ogive:
| Upper Limit | Cumulative Frequency (\( cf \)) |
|---|---|
| Less than 60 | 3 |
| Less than 70 | 8 |
| Less than 80 | 17 |
| Less than 90 | 29 |
| Less than 100 | 35 |
The total frequency \( N = 35 \), so \( \frac{N}{2} = \frac{35}{2} = 17.5 \).
By plotting the cumulative frequency values on the vertical axis against the upper class limits on the horizontal axis, we get the less than ogive curve.
Locate \( y = 17.5 \) on the cumulative frequency axis, draw a horizontal line to intersect the ogive, and then a vertical line down to the horizontal axis. This intersection points to the median.
By precise formula calculation:
\( \text{Median} = l + \left(\frac{\frac{N}{2} - cf}{f}\right) \times h \)
Here, median class is 80-90, with \( l = 80 \), \( cf = 17 \), \( f = 12 \), and \( h = 10 \).
\( \implies \text{Median} = 80 + \left(\frac{17.5 - 17}{12}\right) \times 10 = 80 + \frac{5}{12} \approx 80.42 \) (or approximately 82 when estimated on a hand-drawn graph).
Here is the graphical curve showing the intersection line for finding the median: In simple words: We plot the cumulative frequencies to form a curve. We find the middle height of the data at 17.5 and map it to the horizontal axis, pointing to a median of about 80.4.
Exam Tip: Remember that less-than ogives are always plotted using the upper class limits on the x-axis and their corresponding cumulative frequencies on the y-axis.
Question 13. Find the unknown values a,b,c,d,e & f from the following table:
| Height( in cm) | No. of boys | Cumulative Frequency |
|---|---|---|
| 150-155 | 12 | A |
| 155-160 | b | 25 |
| 160-165 | 10 | C |
| 165-170 | d | 43 |
| 170-175 | e | 48 |
| 175-180 | 2 | F |
| Total | 50 | - |
Answer: Let us solve for each of the unknown cumulative frequency variables step-by-step:
1. The cumulative frequency of the first class is simply equal to its frequency:
\( a = 12 \)
2. For the second class, the cumulative frequency is 25:
\( \implies 12 + b = 25 \implies b = 13 \)
3. The cumulative frequency for the third class:
\( c = 25 + 10 = 35 \)
4. For the fourth class, cumulative frequency is 43:
\( \implies 35 + d = 43 \implies d = 8 \)
5. For the fifth class, cumulative frequency is 48:
\( \implies 43 + e = 48 \implies e = 5 \)
6. For the sixth class, cumulative frequency:
\( f = 48 + 2 = 50 \)
Therefore, the calculated unknown values are:
\( a = 12, \ b = 13, \ c = 35, \ d = 8, \ e = 5, \ f = 50 \)
In simple words: Cumulative frequency is simply the running total of frequencies. By adding and subtracting from class to class, we find that the missing values are \( a = 12 \), \( b = 13 \), \( c = 35 \), \( d = 8 \), \( e = 5 \), and \( f = 50 \).
Exam Tip: Always make sure that the final cumulative frequency value \( f \) equals the total frequency of the data, which is 50.
Question 14. The median of the following data is 20.75 . Find x & y if the total frequency is 100.
| Classes | 0-5 | 5- 10 | 10-15 | 15-20 | 20-25 | 25-30 | 30-35 | 35-40 |
|---|---|---|---|---|---|---|---|---|
| Frequency | 7 | 10 | X | 13 | y | 10 | 14 | 9 |
Answer: Let us prepare the cumulative frequency table for finding the values:
| Class Interval | Frequency (\( f_i \)) | Cumulative Frequency (\( cf \)) |
|---|---|---|
| 0-5 | 7 | 7 |
| 5-10 | 10 | 17 |
| 10-15 | x | 17 + x |
| 15-20 | 13 | 30 + x |
| 20-25 | y | 30 + x + y |
| 25-30 | 10 | 40 + x + y |
| 30-35 | 14 | 54 + x + y |
| 35-40 | 9 | 63 + x + y |
Given that total frequency is 100:
\( \implies 63 + x + y = 100 \)
\( \implies x + y = 37 \) - (Equation 1)
The median is 20.75, which lies in the class interval 20-25. Therefore, the median class is 20-25. From this class, we extract:
Lower limit (\( l \)) = 20
Frequency of median class (\( f \)) = y
Cumulative frequency of previous class (\( cf \)) = 30 + x
Class size (\( h \)) = 5
Total frequency (\( N \)) = 100
Using the median formula:
\( \text{Median} = l + \left(\frac{\frac{N}{2} - cf}{f}\right) \times h \)
\( \implies 20.75 = 20 + \left(\frac{50 - (30 + x)}{y}\right) \times 5 \)
\( \implies 0.75 = \frac{5(20 - x)}{y} \)
\( \implies 0.75 y = 100 - 5x \)
\( \implies 5x + 0.75y = 100 \) - (Equation 2)
From Equation 1, substitute \( x = 37 - y \) into Equation 2:
\( \implies 5(37 - y) + 0.75y = 100 \)
\( \implies 185 - 5y + 0.75y = 100 \)
\( \implies -4.25y = -85 \)
\( \implies y = \frac{85}{4.25} = 20 \)
Substitute \( y = 20 \) back into Equation 1:
\( \implies x + 20 = 37 \implies x = 17 \)
Thus, the missing values are \( x = 17 \) and \( y = 20 \).
In simple words: Since we know the median is 20.75, it must be in the 20-25 range. We use this and the sum of frequencies to set up simultaneous equations, solving to get \( x = 17 \) and \( y = 20 \).
Exam Tip: Be meticulous with algebraic equations involving decimals. Writing \( 0.75 \) as \( \frac{3}{4} \) is a neat trick to make equations easier to solve manually.
Question 15. The median of the following data is 525. Find f1 & f2 if the total frequency is 100.
| Classes | 0-100 | 100-200 | 200-300 | 300-400 | 400-500 | 500-600 | 600-700 | 700-800 | 800-900 | 900-1000 |
|---|---|---|---|---|---|---|---|---|---|---|
| Frequency | 2 | 5 | F1 | 12 | 17 | 20 | Y | 9 | 7 | 4 |
Answer: Let us construct the cumulative frequency table:
| Class Interval | Frequency (\( f_i \)) | Cumulative Frequency (\( cf \)) |
|---|---|---|
| 0-100 | 2 | 2 |
| 100-200 | 5 | 7 |
| 200-300 | f1 | 7 + f1 |
| 300-400 | 12 | 19 + f1 |
| 400-500 | 17 | 36 + f1 |
| 500-600 | 20 | 56 + f1 |
| 600-700 | f2 | 56 + f1 + f2 |
| 700-800 | 9 | 65 + f1 + f2 |
| 800-900 | 7 | 72 + f1 + f2 |
| 900-1000 | 4 | 76 + f1 + f2 |
The total frequency is given as 100:
\( \implies 76 + f_1 + f_2 = 100 \)
\( \implies f_1 + f_2 = 24 \) - (Equation 1)
Given that Median = 525, which lies in the interval 500-600. Therefore, the median class is 500-600. We identify:
Lower limit (\( l \)) = 500
Frequency of the median class (\( f \)) = 20
Cumulative frequency of preceding class (\( cf \)) = 36 + f1
Class size (\( h \)) = 100
Total frequency (\( N \)) = 100
Applying the median formula:
\( \text{Median} = l + \left(\frac{\frac{N}{2} - cf}{f}\right) \times h \)
\( \implies 525 = 500 + \left(\frac{50 - (36 + f_1)}{20}\right) \times 100 \)
\( \implies 25 = (14 - f_1) \times 5 \)
\( \implies 5 = 14 - f_1 \implies f_1 = 9 \)
Substituting \( f_1 = 9 \) into Equation 1:
\( \implies 9 + f_2 = 24 \implies f_2 = 15 \)
Thus, the missing frequencies are \( f_1 = 9 \) and \( f_2 = 15 \).
In simple words: Using our total count of 100 and the median value of 525, we find the cumulative frequencies and use the formula to calculate \( f_1 = 9 \) and \( f_2 = 15 \).
Exam Tip: Be careful with signs when subtracting the cumulative frequency term \( (36 + f_1) \). Remember that \( 50 - (36 + f_1) = 14 - f_1 \).
Question 16. Find the mean, median and the mode of the following data.
| Monthly consumption (in units) | 65-85 | 85-105 | 105-125 | 125-145 | 145-165 | 165-185 | 185-205 |
|---|---|---|---|---|---|---|---|
| No. of Families | 4 | 5 | 13 | 20 | 14 | 8 | 4 |
Answer: Let us prepare the combined calculation table for finding Mean, Median, and Mode:
| Class Interval | Frequency (\( f_i \)) | Class Mark (\( x_i \)) | \( f_i x_i \) | Cumulative Frequency (\( cf \)) |
|---|---|---|---|---|
| 65-85 | 4 | 75 | 300 | 4 |
| 85-105 | 5 | 95 | 475 | 9 |
| 105-125 | 13 | 115 | 1495 | 22 |
| 125-145 | 20 | 135 | 2700 | 42 |
| 145-165 | 14 | 155 | 2170 | 56 |
| 165-185 | 8 | 175 | 1400 | 64 |
| 185-205 | 4 | 195 | 780 | 68 |
| Total | \( N = 68 \) | - | \( 9320 \) | - |
1. Calculation of Mean:
\( \text{Mean} = \frac{\sum f_i x_i}{\sum f_i} = \frac{9320}{68} \approx 137.0588 \approx 137.06 \) units
2. Calculation of Median:
Total frequency \( N = 68 \), so \( \frac{N}{2} = 34 \).
The cumulative frequency just greater than 34 is 42, which falls in the class 125-145.
So, median class is 125-145.
We have: \( l = 125, \ cf = 22, \ f = 20, \ h = 20 \).
\( \text{Median} = l + \left(\frac{\frac{N}{2} - cf}{f}\right) \times h \)
\( \text{Median} = 125 + \left(\frac{34 - 22}{20}\right) \times 20 = 125 + 12 = 137 \) units
3. Calculation of Mode:
The class with the highest frequency is 125-145. So modal class is 125-145.
We have: \( l = 125, \ f_1 = 20, \ f_0 = 13, \ f_2 = 14, \ h = 20 \).
\( \text{Mode} = l + \left(\frac{f_1 - f_0}{2f_1 - f_0 - f_2}\right) \times h \)
\( \text{Mode} = 125 + \left(\frac{20 - 13}{2(20) - 13 - 14}\right) \times 20 \)
\( \text{Mode} = 125 + \left(\frac{7}{40 - 27}\right) \times 20 = 125 + \frac{140}{13} \approx 125 + 10.769 \approx 135.77 \) units
So, Mean = 137.06, Median = 137, and Mode = 135.77.
In simple words: We find the mean using our calculated totals to be 137.06, the median using cumulative sums to be 137, and the mode using the highest frequency to be 135.77.
Exam Tip: Always state your final units of measurement (e.g., units) along with the computed numerical values to score complete marks.
Question 17. Find the median of the following data.
| Classes | 118-126 | 127-135 | 136-144 | 145-153 | 154-162 | 163-171 | 172-180 |
|---|---|---|---|---|---|---|---|
| Frequency | 3 | 5 | 9 | 12 | 5 | 4 | 2 |
Answer: First, since the classes are discontinuous, we make them continuous by subtracting 0.5 from each lower limit and adding 0.5 to each upper limit:
| Continuous Class Interval | Frequency (\( f \)) | Cumulative Frequency (\( cf \)) |
|---|---|---|
| 117.5 - 126.5 | 3 | 3 |
| 126.5 - 135.5 | 5 | 8 |
| 135.5 - 144.5 | 9 | 17 |
| 144.5 - 153.5 | 12 | 29 |
| 153.5 - 162.5 | 5 | 34 |
| 162.5 - 171.5 | 4 | 38 |
| 171.5 - 180.5 | 2 | 40 |
Total frequency \( N = 40 \), so \( \frac{N}{2} = 20 \).
The cumulative frequency just greater than 20 is 29, which corresponds to the class 144.5 - 153.5.
Therefore, the median class is 144.5 - 153.5.
From this, we identify:
Lower limit (\( l \)) = 144.5
Frequency (\( f \)) = 12
Cumulative frequency of previous class (\( cf \)) = 17
Class size (\( h \)) = 9
Using the median formula:
\( \text{Median} = l + \left(\frac{\frac{N}{2} - cf}{f}\right) \times h \)
\( \implies \text{Median} = 144.5 + \left(\frac{20 - 17}{12}\right) \times 9 \)
\( \implies \text{Median} = 144.5 + \left(\frac{3}{12}\right) \times 9 \)
\( \implies \text{Median} = 144.5 + 2.25 = 146.75 \)
So, the median is 146.75.
In simple words: To find the median when the intervals are broken, we first make them continuous. We then find the middle point of frequencies at 20, choose the correct group, and calculate a median of 146.75.
Exam Tip: Making classes continuous is an essential step before calculating the median or mode. Always check if the upper limit of one class matches the lower limit of the next class.
Free study material for Mathematics
Download Class 10 Mathematics Chapter 13 Statistics Practice Worksheets
Mastering Chapter 13 Statistics with Printable Worksheets
Review targeted practice exercises for Class 10 Mathematics Chapter 13 Statistics. Curated to match official CBSE guidelines, these printable problem sets support daily revision and improve overall test readiness.
Verified Solutions and NCERT Alignment
Each worksheet draws directly from authorized standard textbooks to maintain academic accuracy. Evaluating your finished exercises against expert-verified solutions helps master the formal presentation standards expected in school evaluations.
Additional Study Resources for Class 10 Mathematics
Wrap up your chapter revision by testing your knowledge against standard objective question formats. Explore our full library of free, up-to-date printable assignments to maximize your academic results in upcoming CBSE evaluations.
FAQs
You can download the latest chapter-wise printable worksheets for Class 10 Mathematics Chapter 13 Statistics for free from StudiesToday.com. These have been made as per the latest CBSE curriculum for this academic year.
Yes, Class 10 Mathematics worksheets for Chapter 13 Statistics focus on activity-based learning and also competency-style questions. This helps students to apply theoretical knowledge to practical scenarios.
Yes, we have provided solved worksheets for Class 10 Mathematics Chapter 13 Statistics to help students verify their answers instantly.
Yes, our Class 10 Mathematics test sheets are mobile-friendly PDFs and can be printed by teachers for classroom.
For Chapter 13 Statistics, regular practice with our worksheets will improve question-handling speed and help students understand all technical terms and diagrams.