
Read and download the CBSE Class 10 Mathematics Statistics Worksheet Set 02 in PDF format. We have provided exhaustive and printable Class 10 Mathematics worksheets for Chapter 13 Statistics, designed by expert teachers. These resources align with the 2026-27 syllabus and examination patterns issued by NCERT, CBSE, and KVS, helping students master all important chapter topics.
Chapter-wise Worksheet for Class 10 Mathematics Chapter 13 Statistics
Students of Class 10 should use this Mathematics practice paper to check their understanding of Chapter 13 Statistics as it includes essential problems and detailed solutions. Regular self-testing with these will help you achieve higher marks in your school tests and final examinations.
Class 10 Mathematics Chapter 13 Statistics Worksheet with Answers
Question. Find the class marks of classes 10–20 and 35–55.
(a) 10, 35
(b) 20, 55
(c) 15, 45
(d) 17.5, 45
Answer: C
Question. If di = xi – 13, ∑fidi = 30 and ∑fi = 120 , then mean, x is equal to
(a) 13
(b) 12.75
(c) 13.25
(d) 14.25
Answer: C
Question. The mean of first ten odd natural numbers is
(a) 5
(b) 10
(c) 20
(d) 19
Answer: B
Question. If the mean of first n natural numbers is 5n/9, then n is equal to
(a) 5
(b) 9
(c) 10
(d) 11
Answer: B
Question. If the mean of x, x + 3, x + 6, x + 9 and x + 12 is 10, then x equals
(a) 1
(b) 2
(c) 4
(d) 6
Answer: C
Question. Four observations are 2, 4, 6 and 8. The frequencies of the first three observations are 3, 2 and 1 respectively. If the mean of the observations is 4, then find the frequency of the fourth observation.
(a) 8
(b) 4
(c) 1
(d) 2
Answer: C
Question. The following distribution shows the daily pocket allowance of children of a locality. The mean pocket allowance is ₹ 18. Find the missing frequency f.
| Daily pocket allowance (in₹) | 11-13 | 13-15 | 15-17 | 17-19 | 19-21 | 21-23 | 23-25 |
| Frequency | 7 | 6 | 9 | 13 | f | 5 | 4 |
(a) 18
(b) 20
(c) 22
(d) 19
Answer: B
Question. The mean of the following data is
| Class interval | 0-10 | 10-20 | 20-30 | 30-0 | 40-50 |
| Frequency | 3 | 5 | 9 | 5 | 3 |
(a) 20
(b) 24
(c) 22
(d) 25
Answer: D
Question. The mean of n observations x1, x2, x3, ..., xn is x̄ . If each observation is multiplied by p, then the mean of the new observations is
(a) x̄/p
(b) p x̄
(c) x̄
(d) p + x̄
Answer: B
Question. The algebraic sum of all the deviations of all the observations from their mean is always
(a) 0
(b) +ve
(c) –ve
(d) equal to the number of observations.
Answer: A
Question. Consider the following frequency distribution.
| Class interval | 0-10 | 10-20 | 20-30 | 30-40 | 40-50 | 50-60 |
| Frequency | 3 | 9 | 15 | 30 | 18 | 5 |
The modal class is
(a) 10-20
(b) 20-30
(c) 30-40
(d) 40-50
Answer: C
Question. Life time of electric bulbs are given in the following frequency distribution.
| Life time (in hours) | 250-300 | 300-50 | 350-00 | 400-450 | 450-500 |
| Number of bulbs | 5 | 14 | 21 | 12 | 10 |
Find the class mark of the modal class.
(a) 350
(b) 375
(c) 400
(d) 150
Answer: B
Question. The frequency of the class succeeding the modal class in the following frequency distribution is
| Class interval | Frequency |
| 10–15 15–20 20–25 25–30 30–35 35–40 40–45 | 3 7 16 12 9 5 3 |
(a) 3
(b) 6
(c) 9
(d) 12
Answer: D
Question. The modal class of data given below is 10–15, then
| Class interval | 0-5 | 5-10 | 10-15 | 15-20 | 20–25 |
| Frequency | 8 | 6 | f | 4 | 3 |
(a) f < 9
(b) f ≥ 9
(c) f > 9 only
(d) f < 3
Answer: B
Question. The mode for the following distribution is
| Marks | Number of students |
| 0–10 10–20 20–30 30–40 40–50 | 6 10 12 32 20 |
(a) 36
(b) 35.5
(c) 36.25
(d) 35
Answer: C
Question. Consider the following table:
| Class interval | 10-14 | 14-18 | 18-22 | 22-26 | 26-30 |
| Frequency | 5 | 11 | 16 | 25 | 19 |
The mode of the above data is
(a) 23.5
(b) 24
(c) 24.4
(d) 25
Answer: C
Question. If the median of the data: 6, 7, x – 2, x, 17, 20 written in ascending order, is 16. Then x is equal to
(a) 15
(b) 16
(c) 17
(d) 18
Answer: C
Question. Find the class mark of the modal class in the following distribution.
| Class interval | Frequency |
| 40–50 50–60 60–70 70–80 80–90 90–100 | 10 25 28 12 10 15 |
(a) 45
(b) 55
(c) 65
(d) 63
Answer: C
Question. The median class for the following data is
| Class interval | 20-40 | 40-60 | 60-80 | 80-100 |
| Frequency | 10 | 12 | 20 | 22 |
(a) 20–40
(b) 40–60
(c) 60–80
(d) 80–100
Answer: C
Question. For a frequency distribution, mean, median and mode are connected by the relation
(a) Mode = 3 Mean – 2 Median
(b) Mode = 2 Median – 3 Mean
(c) Mode = 3 Median – 2 Mean
(d) Mode = 3 Median + 2 Mean
Answer: C
Question. The mean and mode of a frequency distribution are 28 and 16 respectively. The median is
(a) 22
(b) 23.5
(c) 24
(d) 24.5
Answer: C
Question. If mode of a series exceeds its mean by 12, then mode exceeds the median by
(a) 4
(b) 8
(c) 6
(d) 10
Answer: B
Question. The mean of 1, 2, 3, 4, ........, n is given by
(a) n(n +1)/2
(b) (n +1)/4
(c) n/2
(d) (n +1)/2
Answer: D
Question. The mean of 15 numbers is 25. If each number is multiplied by 4, mean of the new numbers is
(a) 60
(b) 100
(c) 10
(d) none of these
Answer: B
Question. Consider the following frequency distribution.
| Class interval | 1-7 | 8-14 | 15-21 | 22-28 | 29-5 |
| Frequency | 3 | 10 | 5 | 8 | 12 |
The upper limit of the median class is
(a) 14.5
(b) 14.5
(c) 28
(d) 28.5
Answer: D
Question. Extreme value of a given data
(a) affect the median
(b) do not affect the median
(c) nothing can be said
(d) none of the options
Answer: B
Question. One of the properties of mode is
(a) Not easy to calculate
(b) It is not affected by greatest and least values
(c) Algebraic
(d) Difference of greatest and least values
Answer: B
Question. The mean of n observations is x̄. If the first item is increased by 1, second by 2 and so on, then the new mean is
(a) x̄ + n
(b) x̄ n + 2
(c) x̄ + (n + 1/2)
(d) None of the options
Answer: C
Question. Look at the frequency distribution table given below.
| Class interval | 35-45 | 45-55 | 55-65 | 65-75 |
| Frequency | 8 | 12 | 20 | 10 |
The median of the above distribution is
(a) 56.5
(b) 57.5
(c) 58.5
(d) 59
Answer: B
Question. The mean, mode and median of the observations, 7, 7, 5, 7 and x are the same. Then the observation x is
(a) 10
(b) 9
(c) 8
(d) 7
Answer: B
Question. Mean of 20 observations is 15. If each observation is multiplied by 2/3, then the mean of new observations is
(a) 10
(b) 30
(c) 45
(d) 15
Answer: A
Question. The mean of six numbers : x – 5, x – 1, x, x + 2, x + 4 and x + 12 is 15. Find the mean of first four numbers.
(a) 11
(b) 12
(c) 13
(d) 14
Answer: B
Question. The numbers are arranged in the descending order : 108, 94, 88, 82, x + 7, x – 7, 60, 58, 42, 39. If the median is 73, the value of x is
(a) 72
(b) 73
(c) 76
(d) 75
Answer: B
Question. If the mean of the following distribution is 2.6, then the value of y is
| Variable (xi) | 1 | 2 | 3 | 4 | 5 |
| Frequency | 4 | 5 | y | 1 | 2 |
(a) 3
(b) 8
(c) 13
(d) 24
Answer: B
Question. The mean of x1, x2,.......,xn is M. If xi, i = 1,2,......, n is replaced by 5xi, the mean becomes M1, then M1 is equal to
(a) 5M
(b) M + 5
(c) M + 100
(d) 10 M
Answer: A
Question. If mean of ten consecutive odd numbers is 120, then the mean of first five odd numbers among them is
(a) 113
(b) 115
(c) 114
(d) 116
Answer: B
Question. The numbers 3, 5, 7 and 9 have their respectively frequencies x – 2, x + 2, and x – 3, x + 3. If the mean is 6.5, then the value of x is
(a) 3
(b) 4
(c) 5
(d) 6
Answer: C
Short Answer Type Questions
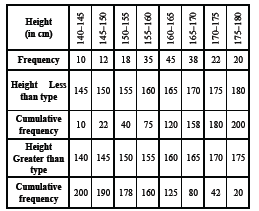
Question. Write down less than type cumulative frequency and greater than type cumulative frequency.
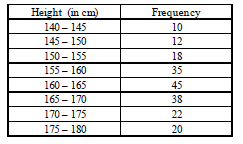
Answer: We have


Answer:

Free study material for Mathematics
CBSE Mathematics Class 10 Chapter 13 Statistics Worksheet
Students can use the practice questions and answers provided above for Chapter 13 Statistics to prepare for their upcoming school tests. This resource is designed by expert teachers as per the latest 2026 syllabus released by CBSE for Class 10. We suggest that Class 10 students solve these questions daily for a strong foundation in Mathematics.
Chapter 13 Statistics Solutions & NCERT Alignment
Our expert teachers have referred to the latest NCERT book for Class 10 Mathematics to create these exercises. After solving the questions you should compare your answers with our detailed solutions as they have been designed by expert teachers. You will understand the correct way to write answers for the CBSE exams. You can also see above MCQ questions for Mathematics to cover every important topic in the chapter.
Class 10 Exam Preparation Strategy
Regular practice of this Class 10 Mathematics study material helps you to be familiar with the most regularly asked exam topics. If you find any topic in Chapter 13 Statistics difficult then you can refer to our NCERT solutions for Class 10 Mathematics. All revision sheets and printable assignments on studiestoday.com are free and updated to help students get better scores in their school examinations.
FAQs
You can download the latest chapter-wise printable worksheets for Class 10 Mathematics Chapter 13 Statistics for free from StudiesToday.com. These have been made as per the latest CBSE curriculum for this academic year.
Yes, Class 10 Mathematics worksheets for Chapter 13 Statistics focus on activity-based learning and also competency-style questions. This helps students to apply theoretical knowledge to practical scenarios.
Yes, we have provided solved worksheets for Class 10 Mathematics Chapter 13 Statistics to help students verify their answers instantly.
Yes, our Class 10 Mathematics test sheets are mobile-friendly PDFs and can be printed by teachers for classroom.
For Chapter 13 Statistics, regular practice with our worksheets will improve question-handling speed and help students understand all technical terms and diagrams.