Question : Give five examples of data that you can collect from day to day life.
Answer: In our day to day life, we can collect the following data.
1. Number of females per 1000 males in various states of our country
2. Weights of students of our class
3. Production of wheat in the last 10 years in our country
4. Number of plants in our locality 5. Rainfall in our city in the last 10 years
Question : Classify the data in Q1 above as primary or secondary data.
Answer: The information which is collected by the investigator himself with a definite objective in his mind is called as primary data whereas when the information is gathered from a source which already had the information stored, it is called as secondary data. It can be observed that the data in 1, 3, and 5 is secondary data and the data in 2 and 4 is primary data.
Question : The blood groups of 30 students of Class VIII are recoded as follows:
A, B, O, O, AB, O, A, O, B, A, O, B, A, O, O,
A, AB, O, A, A, O, O, AB, B, A, O, B, A, B, O.
Represent this data in the form of a frequency distribution table. Which is the most common, and which is the rarest, blood group among these students?
Answer: It can be observed that 9 students have their blood group as A, 6 as B, 3 as AB, and 12 as O.
Therefore, the blood group of 30 students of the class can be represented as follows.
Blood group Number of students
A 9
B 6
AB 3
O 12
Total 30
It can be observed clearly that the most common blood group and the rarest blood group among these students is O and AB respectively as 12 (maximum number of students) have their blood group as O, and 3 (minimum number of students) have their blood group as AB.
Question : The distance (in km) of 40 engineers from their residence to their place of work were found as follows:
5 3 10 20 25 11 13 7 12 31
19 10 12 17 18 11 32 17 16 2 7 9
7 8 3 5 12 15 18 3
12 14 2 9 6 15 15 7 6 12
Construct a grouped frequency distribution table with class size 5 for the data given above taking the first interval as 0 - 5 (5 not included). What main feature do you observe from this tabular representation?
Answer: It is given that a grouped frequency distribution table of class size 5 has to be constructed. Therefore, the class intervals will be 0 − 5, 5 − 10, 10 − 15, 15 −20… By observing the data given as above, a grouped frequency distribution table can be constructed as follows.
It can be observed that there are very few engineers whose homes are at more than or equal to 20 km distance from their work place. Most of the engineers have their workplace up to 15 km distance from their homes.
Question : The relative humidity (in %) of a certain city for a month of 30 days was as follows:
98.1 98.6 99.2 90.3 86.5 95.3 92.9 96.3 94.2 95.1
89.2 92.3 97.1 93.5 92.7 95.1 97.2 93.3 95.2 97.3
96.2 92.1 84.9 90.2 95.7 98.3 97.3 96.1 92.1 89
(i) Construct a grouped frequency distribution table with classes
84 - 86, 86 - 88
(ii) Which month or season do you think this data is about?
(iii) What is the range of this data?
Answer:
(i) A grouped frequency distribution table of class size 2 has to be constructed. The
class intervals will be 84 − 86, 86 − 88, and 88 − 90…
By observing the data given above, the required table can be constructed as follows.
Relative humidity (in %) Number of days (frequency )
84 − 86 1
86 − 88 1
88 − 90 2
90 − 92 2
92 − 94 7
94 − 96 6
96 − 98 7
98 − 100 4
Total 30
(ii) It can be observed that the relative humidity is high. Therefore, the data is about
a month of rainy season.
(iii) Range of data = Maximum value − Minimum value
= 99.2 − 84.9 = 14.3
Question : The heights of 50 students, measured to the nearest centimeters, have been found to be as follows:161 150 154 165 168 161 154 162 150 151
162 164 171 165 158 154 156 172 160 170
153 159 161 170 162 165 166 168 165 164
154 152 153 156 158 162 160 161 173 166 161
159 162 167 168 159 158 153 154 159
(i) Represent the data given above by a grouped frequency distribution table, taking the class intervals as 160 - 165, 165 - 170, etc.
(ii) What can you conclude bout their heights from the table?
Answer:
(i) A grouped frequency distribution table has to be constructed taking class intervals 160 − 165, 165 − 170, etc. By observing the data given above, the required table can be constructed as follows.
Height (in cm) Number of students (frequency )
150 − 155 12
155 − 160 9
160− 165 14
165 − 170 10
170 − 175 5
Total 50
(ii) It can be concluded that more than 50% of the students are shorter than 165 cm.
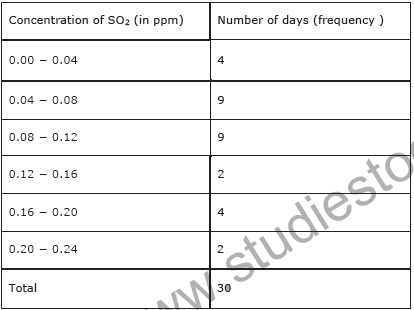
Question : A study was conducted to find out the concentration of sulphur dioxide in the air in parts per million (ppm) of a certain city. The data obtained for 30 days is as follows:
0.03 0.08 0.08 0.09 0.04 0.17
0.16 0.05 0.02 0.06 0.18 0.20
0.11 0.08 0.12 0.13 0.22 0.07
0.08 0.01 0.10 0.06 0.09 0.18
0.11 0.07 0.05 0.07 0.01 0.04
(i) Make a grouped frequency distribution table for this data with class intervals as 0.00 - 0.04, 0.04 - 0.08, and so on.
(ii) For how many days, was the concentration of sulphur dioxide more than 0.11 parts per million?
Answer : Taking class intervals as 0.00, −0.04, 0.04, −0.08, and so on, a grouped frequency table can be constructed as follows.
The number of days for which the concentration of SO2 is more than 0.11 is the number of days for which the concentration is in between 0.12 − 0.16, 0.16 − 0.20,
0.20 − 0.24.
Required number of days = 2 + 4 + 2 = 8
Therefore, for 8 days, the concentration of SO2 is more than 0.11 ppm.
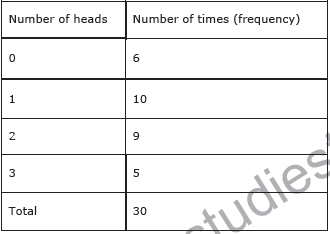
Question : Three coins were tossed 30 times simultaneously. Each time the number of heads occurring was noted down as follows:
0 1 2 2 1 2 3 1 3 0
1 3 1 1 2 2 0 1 2 1
3 0 0 1 1 2 3 2 2 0
Prepare a frequency distribution table for the data given above.
Answer: By observing the data given above, the required frequency distribution table can be constructed as follows.
Question : The value of π up to50 decimal places is given below:
3.14159265358979323846264338327950288419716939937510
(i) Make a frequency distribution of the digits from 0 to 9 after the decimal point.
(ii) What are the most and the least frequently occurring digits?
Answer:
(i) By observation of the digits after decimal point, the required table can be constructed as follows.
Digit Frequency
0 2
1 5
2 5
3 8
4 4
5 5
6 4
7 4
8 5
9 8
Total 50
(ii) It can be observed from the above table that the least frequency is 2 of digit 0, and the maximum frequency is 8 of digit 3 and 9. Therefore, the most frequently occurring digits are 3 and 9 and the least frequently occurring digit is 0.
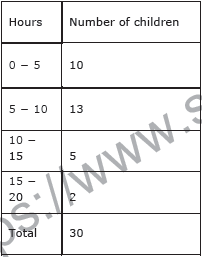
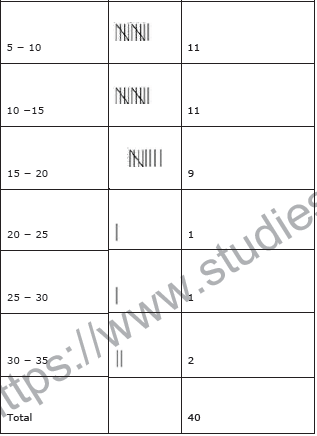
Question : Thirty children were asked about the number of hours they watched TV programmes in the previous week. The results were found as follows:
1 6 2 3 5 12 5 8 4 8
10 3 4 12 2 8 15 1 17 6
3 2 8 5 9 6 8 7 14 12
(i) Make a grouped frequency distribution table for this data, taking class width 5 and one of the class intervals as 5 - 10.
(ii) How many children watched television for 15 or more hours a week?
Answer:
(i) Our class intervals will be 0 − 5, 5 − 10, 10 −15…..
The grouped frequency distribution table can be constructed as follows.
(ii) The number of children who watched TV for 15 or more hours a week is 2 (i.e., the number of children in class interval 15 − 20).
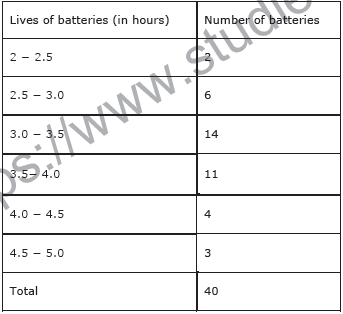
Question : A company manufactures car batteries of a particular type. The lives (in years) of 40 such batteries were recorded as follows:
2.6 3.0 3.7 3.2 2.2 4.1 3.5 4.5
3.5 2.3 3.2 3.4 3.8 3.2 4.6 3.7
2.5 4.4 3.4 3.3 2.9 3.0 4.3 2.8
3.5 3.2 3.9 3.2 3.2 3.1 3.7 3.4
4.6 3.8 3.2 2.6 3.5 4.2 2.9 3.6
Construct a grouped frequency distribution table for this data, using class intervals of size 0.5 starting from the intervals 2 − 2.5.
Answer: A grouped frequency table of class size 0.5 has to be constructed, starting from class interval 2 − 2.5.
Therefore, the class intervals will be 2 − 2.5, 2.5 − 3, 3 − 3.5…
By observing the data given above, the required grouped frequency distribution table can be constructed as follows.