
Read and download the CBSE Class 9 Mathematics Statistics Assignment Set 03 for the 2026-27 academic session. We have provided comprehensive Class 9 Mathematics school assignments that have important solved questions and answers for Chapter 12 Statistics. These resources have been carefuly prepared by expert teachers as per the latest NCERT, CBSE, and KVS syllabus guidelines.
Solved Assignment for Class 9 Mathematics Chapter 12 Statistics
Practicing these Class 9 Mathematics problems daily is must to improve your conceptual understanding and score better marks in school examinations. These printable assignments are a perfect assessment tool for Chapter 12 Statistics, covering both basic and advanced level questions to help you get more marks in exams.
Chapter 12 Statistics Class 9 Solved Questions and Answers


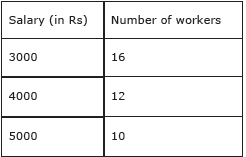

Question : 100 surnames were randomly picked up from a local telephone directory and a frequency distribution of the number of letters in the English alphabet in the surnames was found as follows:

(i) Draw a histogram to depict the given information.
(ii) Write the class interval in which the maximum number of surname lie.
Answer:
(i) Here, it can be observed that the data has class intervals of varying width. The proportion of the number of surnames per 2 letters interval can be calculated as follows.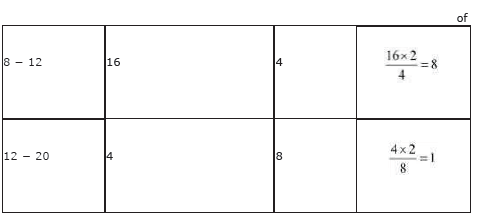
By taking the number of letters on x-axis and the proportion of the number of surnames per 2 letters interval on y-axis and choosing an appropriate scale (1 unit = 4 students for y axis), the histogram can be constructed as follows.
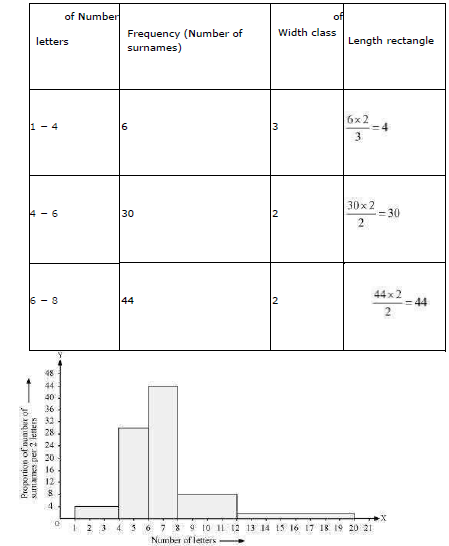
(ii) The class interval in which the maximum number of surnames lies is 6 − 8 as it has 44 surnames in it i.e., the maximum for this data.
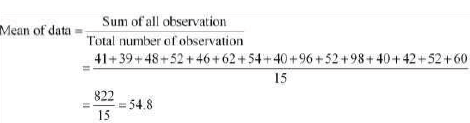
Question : In a mathematics test given to 15 students, the following marks (out of 100) are recorded:
41, 39, 48, 52, 46, 62, 54, 40, 96, 52, 98, 40, 42, 52, 60 Find the mean, median and mode of this data.
Answer:
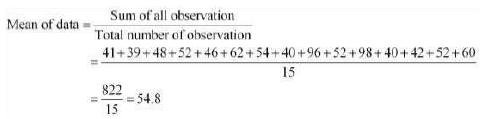
The marks of 15 students in mathematics test are
41, 39, 48, 52, 46, 62, 54, 40, 96, 52, 98, 40, 42, 52, 60
Arranging the scores obtained by 15 students in an ascending order,
39, 40, 40, 41, 42, 46, 48, 52, 52, 52, 54, 60, 62, 96, 98
As the number of observations is 15 which is odd, therefore, the median of data will be 15+1/2 = 8th observation whether the data is arranged in an ascending or descending order.
Therefore, median score of data = 52
Mode of data is the observation with the maximum frequency in data. Therefore, mode of this data is 52 having the highest frequency in data as 3.
Question : Find the mode of 14, 25, 14, 28, 18, 17, 18, 14, 23, 22, 14, 18.
Answer:
Arranging the data in an ascending order,
14, 14, 14, 14, 17, 18, 18, 18, 22, 23, 25, 28
It can be observed that 14 has the highest frequency, i.e. 4, in the given data.
Therefore, mode of the given data is 14.
Question : Give one example of a situation in which
(i) The mean is an appropriate measure of central tendency.
(ii) The mean is not an appropriate measure of central tendency but the median is an appropriate measure of central tendency.
Answer:
When any data has a few observations such that these are very far from the other observations in it, it is better to calculate the median than the mean of the data as median gives a better estimate of average in this case.
(i) Consider the following example − the following data represents the heights of the members of a family.
154.9 cm, 162.8 cm, 170.6 cm, 158.8 cm, 163.3 cm, 166.8 cm, 160.2 cm In this case, it can be observed that the observations in the given data are close to each other. Therefore, mean will be calculated as an appropriate measure of central tendency.
(ii) The following data represents the marks obtained by 12 students in a test.
48, 59, 46, 52, 54, 46, 97, 42, 49, 58, 60, 99
In this case, it can be observed that there are some observations which are very far from other observations. Therefore, here, median will be calculated as an appropriate measure of central tendency.
Click on link below to download CBSE Class 9 Mathematics Statistics Assignment Set C
Free study material for Mathematics
CBSE Class 9 Mathematics Chapter 12 Statistics Assignment
Access the latest Chapter 12 Statistics assignments designed as per the current CBSE syllabus for Class 9. We have included all question types, including MCQs, short answer questions, and long-form problems relating to Chapter 12 Statistics. You can easily download these assignments in PDF format for free. Our expert teachers have carefully looked at previous year exam patterns and have made sure that these questions help you prepare properly for your upcoming school tests.
Benefits of solving Assignments for Chapter 12 Statistics
Practicing these Class 9 Mathematics assignments has many advantages for you:
- Better Exam Scores: Regular practice will help you to understand Chapter 12 Statistics properly and you will be able to answer exam questions correctly.
- Latest Exam Pattern: All questions are aligned as per the latest CBSE sample papers and marking schemes.
- Huge Variety of Questions: These Chapter 12 Statistics sets include Case Studies, objective questions, and various descriptive problems with answers.
- Time Management: Solving these Chapter 12 Statistics test papers daily will improve your speed and accuracy.
How to solve Mathematics Chapter 12 Statistics Assignments effectively?
- Read the Chapter First: Start with the NCERT book for Class 9 Mathematics before attempting the assignment.
- Self-Assessment: Try solving the Chapter 12 Statistics questions by yourself and then check the solutions provided by us.
- Use Supporting Material: Refer to our Revision Notes and Class 9 worksheets if you get stuck on any topic.
- Track Mistakes: Maintain a notebook for tricky concepts and revise them using our online MCQ tests.
Best Practices for Class 9 Mathematics Preparation
For the best results, solve one assignment for Chapter 12 Statistics on daily basis. Using a timer while practicing will further improve your problem-solving skills and prepare you for the actual CBSE exam.
FAQs
You can download free PDF assignments for Class 9 Mathematics Chapter 12 Statistics from StudiesToday.com. These practice sheets have been updated for the 2026-27 session covering all concepts from latest NCERT textbook.
Yes, our teachers have given solutions for all questions in the Class 9 Mathematics Chapter 12 Statistics assignments. This will help you to understand step-by-step methodology to get full marks in school tests and exams.
Yes. These assignments are designed as per the latest CBSE syllabus for 2026. We have included huge variety of question formats such as MCQs, Case-study based questions and important diagram-based problems found in Chapter 12 Statistics.
Practicing topicw wise assignments will help Class 9 students understand every sub-topic of Chapter 12 Statistics. Daily practice will improve speed, accuracy and answering competency-based questions.
Yes, all printable assignments for Class 9 Mathematics Chapter 12 Statistics are available for free download in mobile-friendly PDF format.