

School Assignments for Class 9 Mathematics: Chapter 15 Probability
Review targeted academic assignments with the CBSE Class 9 Mathematics Probability Set 01. Built according to official CBSE standards for the 2026-27 term, these downloadable Class 9 Mathematics worksheets support effective daily practice for Chapter 15 Probability.
Practice Class 9 Mathematics Assignments: Chapter 15 Probability
Navigate directly to the solved Mathematics assignments using the digital viewer below. Each practice set includes detailed step-by-step solutions, allowing students to instantly cross-check their work and identify areas requiring further revision.
1 In an experiment, what is the sum of probabilities of all events?
(A) 0.5
(B) 1
(C) - 2
(D) 3/8
Answer : B
2 In a throw of a die, what is the probability of getting a prime number?
(A) 2
(B) 1/2
(C) 3/2
(D) 6
Answer : B
3 Find the probability that a vowel selected at random in the English alphabet is an "i".
(A) 1/5
(B) 1/26
(C) 1/6
(D) 4/5
Answer : A
4 Determine the probability of three coins falling all heads up when tossed simultaneously.
(A) 1/2
(B) 1/6
(C) 1/8
(D) 7/8
Answer : C
5 The probability of happening of an event is 45%. Find t he probability of that event.
(A) 45
(B) 4.5
(C) 0.45
(D) 0.045
Answer : C
6 When two dice are thrown, what is the probability of getting a number always greater than 4 on the second dice?
(A) 1/6
(B) 1/3
(C) 1/36
(D) 2/3
Answer : B
7 Determine the probability of getting an even number when a die is rolled.
(A) 1/6
(B) 1/36
(C) 1/2
(D) 1/3
Answer : C
8 Two numbers are chosen from 1 to 5. Find the probability for the two numbers to be consecut ive.
(A) 1/5
(B) 2/5
(C) 1/10
(D) 3/5
Answer : B
9 One card is drawn from a well-shuffled deck of 52 cards. Find the probability of drawing a '1 0' of a black suit.
(A) 1/13
(B) 1/26
(C) 5/13
(D) 1/52
Answer : B
10 Two dice are thrown at a time. What is the probability that the difference of the numbers shown on the dice is 1?
(A) 5/18
(B) 1/36
(C) 1/6
(D) 7/36
Answer : A
11 A bag contains 3 white and 5 red balls. If a ball is drawn at random, find the probability that it is red.
(A) 3/8
(B) 5/8
(C) 3/15
(D) 5/15
Answer : B
12 From a normal pack of cards, a card is drawn at random. What is t he probability of getting a jack or a king?
(A) 1/26
(B) 1/52
(C) 2/13
(D) 1/13
Answer : C
13 A card is drawn from a packet of 100 cards numbered 1 t o 1 00. Find the probability of drawing a number which is a square.
(A) 1/10
(B) 100
(C) 100
(D) 50
Answer : A
14 Find the probability for a randomly selected number out of 1, 2, 3, 4, ..... , 25 to be a prime number.
(A) 7/25
(B) 23/25
(C) 2/5
(D) 9/25
Answer : D
15 A bag contains 5 red balls and some blue balls. If the probability of drawing a blue ball is double that of a red ball, find the number of blue balls in t he bag.
(A) 15
(B) 12
(C) 5
(D) 10
Answer : D
16 A book containing 100 pages is opened at random. Find the probability that a doublet page is found.
(A) 9/100
(B) 9/10
(C) 1/10
(D) 1/5
Answer : A
17 If a coin is tossed twice, what is the probability of getting at least one head?
(A) 1/2
(B) 1/4
(C) 3/4
(D) 2/3
Answer : C
18 What is the probability of getting a number great er than 2 or an even number in a single throw of a fair die?
(A) 1/3
(B) 2/3
(C) 5/6
(D) 1/6
Answer : C
19 Find the probability that in a family of 3 children, there will be at least one boy.
(A) 3/4
(B) 1/8
(C) 3/8
(D) 5/8
Answer : A
20 What is the probability that a non-leap year cont ains 53 Saturdays?
(A) 2/7
(B) 1/7
(C) 2/365
(D) 1/365
Answer : B
21 A bag contains 12 balls out of which x are white. If one ball is drawn at random, what is the probability that it will be a white ball?
(A) x
(B) x/2
(C) x/12
(D) 12x
Answer : C
22 A coin is t ossed 150 t imes and data about the outcomes is given in the table
| Outcomes | H | T |
| Frequency | 90 | 60 |
What is the probabilit y of getting a head in a trial?
(A) 1/2
(B) 1/3
(C) 3/5
(D) 2/5
Answer : C
(23 - 24): Two coins are tossed simultaneously 80 times and data is recorded in the table given.
| Number of heads in a trial | 0 | 1 | 2 |
| Frequency | 20 | 35 | 25 |
23 What is the probability of get ting two heads?
(A) 1/4
(B) 1/2
(C) 7/16
(D) 5/16
Answer : D
24 What is the probability of getting atleast one head?
(A) 3/4
(B) 5/16
(C) 1/2
(D) 2/9
Answer : A
(25-26): A die is tossed 100 times and the data is recorded in the table.
| Outcomes | 1 | 2 | 3 | 4 | 5 | 6 |
| Frequency | 20 | 15 | 20 | 15 | 20 | 10 |
25 What is the probability that we get an even number in a trial?
(A) 0.4
(B) 0.5
(C) 0.3
(D) 0.35
Answer : A
26 What is the probability of getting a number less than 3?
(A) 0.2
(B) 0.25
(C) 0.35
(D) 0.5
Answer : C
27 A dent al survey of 400 students in a school revealed t hat 80 of them had two or more cavities. If the total school enrolment is 1500, about how many student s would you expect to have two or more cavities?
(A) 300
(B) 800
(C) 500
(D) 600
Answer : A
28 The most recent freshman class at Loyola consists of 880 students. Of these, 500
identified themselves as "smokers':
Compute the empirical probability that a randomly select ed freshman student from this class is not a "smoker':
(A) 8/22
(B) 19/44
(C) 15/44
(D) 9/44
Answer : B
29 If the probability of winning a game is 0.35, what is the probability of losing it?
(A) 0.55
(B) 0.75
(C) 0.65
(D) 0.56
Answer : C
30 There are 50 students in a class and their annual result is presented in the given table.
| Result | Fail | Pass |
| No. of Students | 7 | 43 |
If a student is selected at random, find the probability that the student has passed the examination.
(A) 0.85
(B) 0.68
(C) 0.86
(D) 0.76
Answer : C
31 If P (E) = 0.37, find P (not E).
(A) - 0.37
(B) 0.73
(C) -0.73
(D) 0.63
Answer : D
32 1000 tickets of a lottery were sold and there are 5 prizes on these tickets. If Monu has purchased one lottery ticket, what is her probability of winning a prize?
(A) 0.005
(B) 0.75
(C) 0.055
(D) 0.5
Answer : A
33 When at humbt ack is tossed, there are two possible out comes. If the empirical probability of" point up" is fixed to be 0.73, what should be the probability of"point down"?
(A) 0.37
(B) 0.20
(C) 0.27
(D) 0.51
Answer : C
34 A die is thrown once. What is the probability of getting a number 4 or 5?
(A) 2/3
(B) 1/3
(C) 1/6
(D) 1/2
Answer : B
35 A boy tosses a coin 1000 times and finds that it comes up tail 453 times. Find the probability of getting up head.
(A) 0.457
(B) 0.453
(C) 0.574
(D) 0.547
Answer : D
36 In a cricket match, a bat sman hits a sixer 8 times out of 32 balls played. Find the probability that a sixer is not hit in a ball.
(A) 0.75
(B) 0.25
(C) - 0.25
(D) 0.5
Answer : A
37 A coin is tossed 15 times and observed that head comes up 11 times. What is the probability for a tail to come up?
(A) 11/15
(B) 4/15
(C) 15/4
(D) 15/11
Answer : B
38 A die is tossed once. Which of the following is the probability of getting 3?
(A) 1/6
(B) 1/3
(C) 2/6
(D) 4/6
Answer : A
(39-41): Two coins are tossed 90 times and data recorded as given in the table.
| Number of heads in a trial | 0 | 1 | 2 |
| Frequency | 10 | 25 | 55 |
39 What is the probability of get ting one head?
(A) 0
(B) 1/9
(C) 11/18
(D) 5/18
Answer : D
40 What is the probability of getting two heads?
(A) 8/9
(B) 11/18
(C) 5/18
(D) 1/9
Answer : B
41 Find the proability of getting atleast one head.
(A) 8/9
(B) 1/9
(C) 5/18
(D) 11/18
Answer : A
42 Find the probability of not getting 1 or 6 in a single t oss of a die.
(A) 1/2
(B) 1/3
(C) 1/6
(D) 2/3
Answer : D
43 A child has a block in the shape of a cube with one letter written on each face as shown.
A B C D A E
If the cube is thrown once, what is the probability of getting A?
(A) 1/3
(B) 2/8
(C) 2/5
(D) 2/3
Answer : A
44 A bag contains 3 red balls, 5 black balls and 4 white balls. A ball is drawn at random from t he bag. What is the probability of get ting a black ball?
(A) 1/4
(B) 5/12
(C) 7/12
(D) 1
Answer : B
45 A die is rolled 100 times and the data is recorded as given in the table.
| Outcomes | 1 | 2 | 3 | 4 | 5 | 6 |
| Frequency | 22 | 13 | 20 | 10 | 25 | 10 |
Which of the following is the probability of getting an odd number in a trial?
(A)11/50
(B) 1/5
(C) 67/100
(D) 1/4
Answer : C
46 A card is drawn at random from a pack of well shuffled 52 cards. What is the probability of getting a queen of red suit?
(A) 1/26
(B) 1/13
(C) 1/52
(D) 1/14
Answer : A
47 Find the probability that a number selected at random from the numbers 1 to 25 is not a prime number when each of the given numbers is equally likely to be selected.
(A) 9/25
(B) 16/25
(C) 11/25
(D) 6/25
Answer : B
48 Find the probability of throwing an even number with an ordinary six faced die.
(A) 2/3
(B) 3/5
(C) 1/2
(D) 1/3
Answer : C
Short Answer Type Questions
Question : 1500 families with 2 children were selected randomly, and the following data were recorded:
Compute the probability of a family, chosen at random, having
(i) 2 girls (ii) 1 girl (iii) No girl
Also check whether the sum of these probabilities is 1.
Answer:
Total number of families = 475 + 814 + 211
= 1500
Question : Three coins are tossed simultaneously 200 times with the following frequencies of different outcomes: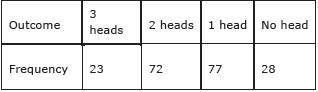
If the three coins are simultaneously tossed again, compute the probability of 2 heads coming up.
Answer:
Number of times 2 heads come up = 72
Total number of times the coins were tossed = 200

Question : A teacher wanted to analyse the performance of two sections of students in a mathematics test of 100 marks. Looking at their performances, she found that a few students got under 20 marks and a few got 70 marks or above. So she decided to group them into intervals of varying sizes as follows: 0 − 20, 20 − 30… 60 − 70, 70 − 100. Then she formed the following table:
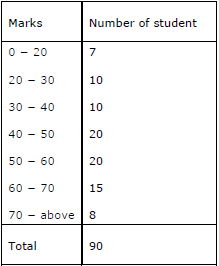
(i) Find the probability that a student obtained less than 20 % in the mathematics test.
(ii) Find the probability that a student obtained marks 60 or above.
Answer:
Total number of students = 90
(i) Number of students getting less than 20 % marks in the test = 7
Hence, required P = 7/90 probability,
(ii) Number of students P = 23/90 obtaining marks 60 or above = 15 + 8 = 23
Hence, required probability,
Question :
| Concentration of SO2 (in ppm) | Number of days (frequency ) |
| 0.00 − 0.04 | 4 |
| 0.04 − 0.08 | 9 |
| 0.08 − 0.12 | 9 |
| 0.12 − 0.16 | 2 |
| 0.16 − 0.20 | 4 |
0.20 − 0.24 | 2 |
| Total | 30 |
The above frequency distribution table represents the concentration of sulphur dioxide in the air in parts per million of a certain city for 30 days. Using this table, find the probability of the concentration of sulphur dioxide in the interval 0.12 − 0.16 on any of these days.
Answer:
Number days for which the concentration of sulphur dioxide was in the interval of
0.12 − 0.16 = 2
Total number of days = 30
Hence, required probability, P = 2/30 =1/15
Question : Tom draws a marble from a bag containing 12 marbles.There are 3 red marbles, 4 blue marbles and 5 green marbles, find the probability that he will draw a blue marble.
Answer: The total number of marbles inside the bag is 12. Out of these, 4 are blue. To find the probability of drawing a blue marble, we divide the count of blue marbles by the total number of marbles.
Number of favorable outcomes = 4
Total number of outcomes = 12
Probability of getting a blue marble = \( \frac{4}{12} = \frac{1}{3} \)
In simple words: There are 4 blue marbles out of 12 total marbles. This means the chance of pulling out a blue one is 4 out of 12, which is the same as 1 out of 3.
Exam Tip: Always state the probability formula first, and remember to reduce your fraction to its simplest terms to secure full marks.
Question : A basket has 5 apples, 10 oranges and 5 bananas. Find the probability of getting out an apple.
Answer: To find the total number of fruits in the basket, we add all the quantities together: 5 apples + 10 oranges + 5 bananas = 20 fruits. Since there are 5 apples, the probability of selecting an apple is the count of apples divided by the overall fruit count.
Number of favorable outcomes = 5
Total number of possible outcomes = 20
Probability of drawing an apple = \( \frac{5}{20} = \frac{1}{4} \)
In simple words: Out of 20 total fruits in the basket, 5 are apples. The chance of picking an apple is 5 out of 20, which simplifies to 1 in 4.
Exam Tip: Double check your addition when finding the total number of outcomes so that your denominator is correct.
Question : One card is drawn from a well-shuffled deck of 52 cards then find the probability that the card will be a king.
Answer: A standard playing deck consists of 52 cards, and there are exactly 4 kings inside the deck. To find the probability of drawing a king, we divide the number of kings by the total cards in the deck.
Number of favorable outcomes = 4
Total number of outcomes = 52
Probability of drawing a king = \( \frac{4}{52} = \frac{1}{13} \)
In simple words: There are 4 kings in a full deck of 52 cards. The probability of choosing a king is 4 out of 52, which simplifies to 1 out of 13.
Exam Tip: Briefly write down that there are 4 kings in a deck to show the examiner how you determined the favorable outcomes.
Question : Mr. And Mrs. X stays in a house along with their seven children. The female to male ratio in the family is 1:2. Find the probability that all the children are either boy or girl.
Answer: This question can be answered based on two common interpretations:
Interpretation 1: Since every child is biologically either a boy or a girl, the event that all the children are either a boy or a girl is a certain event. Therefore, the probability of this happening is 1.
Interpretation 2: If the question asks for the probability that all children are of the same sex (i.e., all are boys or all are girls):
The total number of family members = 7 children + Mr. X + Mrs. X = 9 people.
The female-to-male ratio in the family is given as 1 : 2.
Let the number of females be \( x \) and males be \( 2x \).
\( x + 2x = 9 \)
\( 3x = 9 \implies x = 3 \)
Thus, there are 3 females and 6 males in the house.
Since Mrs. X is female, the number of female children = 3 - 1 = 2 girls.
Since Mr. X is male, the number of male children = 6 - 1 = 5 boys.
Since the children consist of 2 girls and 5 boys, they are a mixed-gender group. Thus, the probability that all the children are of the same sex (either all boys or all girls) is 0.
In simple words: Since every child must be a boy or a girl, the chance is 100% (or 1). If the question means they are all the same gender, the chance is 0 because we already have a fixed mix of 5 boys and 2 girls.
Exam Tip: Since this question is open to interpretation, writing down both logical perspectives clearly ensures you receive full marks regardless of the official marking scheme.
Question : The record of a weather station shows that out of the past 200 consecutives days, its weather forecasts were correct 150 times then find the probability that on a given day it was correct .
Answer: The total number of observed days is 200. Out of these, the weather forecasts were correct 150 times. The probability of a correct forecast is the number of correct days divided by the total number of days.
Probability of a correct forecast = \( \frac{150}{200} = \frac{3}{4} = 0.75 \)
In simple words: The weather station was right 150 times out of 200 days. This means there is a 3 out of 4 chance, or 75%, that the forecast is correct.
Exam Tip: Express your final probability as both a simplified fraction and a decimal to show a thorough solution.
Question : The record of a weather station shows that out of the past 200 consecutives days, its weather forecasts were correct 150 times then find the probability that on a given day it was not correct.
Answer: First, we calculate the number of days the forecast was not correct: 200 - 150 = 50 days. The probability of an incorrect forecast is the number of incorrect days divided by the total days.
Probability of incorrect forecast = \( \frac{50}{200} = \frac{1}{4} = 0.25 \)
In simple words: The weather station made wrong forecasts on 50 of the 200 days. So, the chance of a wrong forecast is 50 out of 200, which is 1 out of 4, or 25%.
Exam Tip: You can also find this by subtracting the probability of a correct forecast from 1, since \( 1 - 0.75 = 0.25 \).
Question : A drawer contains 8 red socks, 3 white socks and 5 blue socks. Without looking, Mayank draws out a pair of socks. Find the probability that the pair of socks is white.
Answer: The total number of socks in the drawer = 8 red + 3 white + 5 blue = 16 socks.
We need to find the probability of drawing two white socks in a row without replacement.
Probability of the first sock being white = \( \frac{3}{16} \)
After drawing one white sock, there are 2 white socks left and 15 total socks remaining.
Probability of the second sock being white = \( \frac{2}{15} \)
Probability of drawing a white pair = \( \frac{3}{16} \times \frac{2}{15} = \frac{6}{240} = \frac{1}{40} \)
In simple words: There are 16 socks in total. The chance of the first sock being white is 3 in 16, and the second is 2 in 15. Multiplying these gives a 1 in 40 chance that both are white.
Exam Tip: When dealing with a "pair," remember that drawing is done without replacement, so both the numerator and the denominator decrease by 1 for the second selection.
Question : Two coins are tossed simultaneously 100 times and we get the following outcomes:(i) One head = 20 (ii) Two heads = 50. Find the probability that there is no head.
Answer: The total number of tosses is 100. The outcomes given are 1 head (20 times) and 2 heads (50 times). The only remaining outcome is 0 heads (no heads), which we find by subtracting the other outcomes from the total.
Number of times no head occurs = 100 - (20 + 50) = 30
Probability of getting no head = \( \frac{30}{100} = \frac{3}{10} = 0.3 \)
In simple words: Out of 100 flips, 20 had one head and 50 had two heads. The other 30 flips must have had no heads. This gives a probability of 30 out of 100, or 0.3.
Exam Tip: State clearly that the sum of all frequencies of outcomes must equal the total number of trials (100).
Question : Two coins are tossed simultaneously 100 times and we get the following outcomes:(i) No head = 30 (ii) Two heads = 50. Find the probability that there is only one head.
Answer: The total number of tosses is 100. We find the frequency of getting only one head by subtracting the frequencies of no head and two heads from the total tosses.
Number of times only one head occurs = 100 - (30 + 50) = 20
Probability of getting only one head = \( \frac{20}{100} = \frac{1}{5} = 0.2 \)
In simple words: Subtracting the 30 tosses with no heads and the 50 tosses with two heads from 100 leaves us with 20 tosses containing exactly one head. The probability is 20 out of 100, which is 1 out of 5.
Exam Tip: Be precise with your subtraction steps to find the correct value for the missing outcome.
Question : Two coins are tossed simultaneously 100 times and we get the following outcomes:(i) No head = 30 (ii) One head = 20. Find the probability of getting two heads.
Answer: The total number of tosses is 100. To find how many times two heads occurred, we subtract the frequencies of no head and one head from the total.
Number of times two heads occur = 100 - (30 + 20) = 50
Probability of getting two heads = \( \frac{50}{100} = \frac{1}{2} = 0.5 \)
In simple words: Since no heads appeared 30 times and one head appeared 20 times, two heads must have appeared the other 50 times. The chance of this is 50 out of 100, which simplifies to 1 in 2.
Exam Tip: Always verify your work by checking if the calculated probabilities of all possible events sum up to exactly 1.
Question : A coin is tossed 23 times and observed that 10 times head comes up. Find the probability that a tail comes up.
Answer: The total number of coin tosses is 23. Head comes up 10 times, which means tail must come up on the remaining tosses.
Number of times tail comes up = 23 - 10 = 13
Probability of getting a tail = \( \frac{13}{23} \)
In simple words: Out of 23 coin flips, 10 were heads, so the other 13 must be tails. The probability of getting a tail is 13 out of 23.
Exam Tip: Since 23 is a prime number, the fraction \( \frac{13}{23} \) cannot be simplified further. Leave it as is.
Question 12. A coin is tossed 100 times. It is observed that 60 times head comes up and 40 times tail comes up then find the probability that neither a head nor a tail comes up.
Answer: In a standard coin toss, the coin can only land on heads or tails. Since the sum of head and tail outcomes equals the total number of tosses (60 + 40 = 100), there are 0 tosses where neither outcome occurred.
Probability of neither head nor tail occurring = \( \frac{0}{100} = 0 \)
In simple words: A coin must land on either heads or tails. Since all 100 tosses did so, there is a 0% chance of getting neither.
Exam Tip: This is an impossible event. Remember that the probability of any impossible event is always 0.
Question : A coin is tossed 100 times with the following frequencies: Head: 45, tail: 55. Compute the probability for each event.
Answer: The total number of tosses is 100.
1) Probability of getting a Head:
\( P(\text{Head}) = \frac{\text{Frequency of Head}}{\text{Total tosses}} = \frac{45}{100} = 0.45 \)
2) Probability of getting a Tail:
\( P(\text{Tail}) = \frac{\text{Frequency of Tail}}{\text{Total tosses}} = \frac{55}{100} = 0.55 \)
In simple words: Out of 100 flips, heads came up 45 times (0.45 chance) and tails came up 55 times (0.55 chance).
Exam Tip: Clearly list the calculations for both events separately to ensure you get full marks for multi-part questions.
Question : The percentage of marks obtained by a student in monthly unit tests is given below: Find the probability that the student gets more than 68% marks.
| Unit test | I | II | III | IV | V |
|---|---|---|---|---|---|
| Percentage | 69 | 71 | 73 | 68 | 76 |
Answer: The total number of unit tests is 5. We need to find the number of tests where the student scored strictly more than 68%.
Let us look at the scores:
Unit test I: 69% (more than 68%)
Unit test II: 71% (more than 68%)
Unit test III: 73% (more than 68%)
Unit test IV: 68% (not more than 68%)
Unit test V: 76% (more than 68%)
The number of tests where the score was more than 68% is 4.
Probability = \( \frac{4}{5} = 0.8 \)
In simple words: The student got more than 68% in 4 out of the 5 tests. So, the probability is 4 out of 5, which is 80%.
Exam Tip: Pay close attention to words like "more than." A score of exactly 68% in Unit Test IV is not included because it is not strictly greater than 68%.
Question : A die is thrown 200 times with the following frequency, for the outcomes 1,2,3,4,5,6 , as given below: Find the probability that the outcome is less than 5.
| Outcomes | 1 | 2 | 3 | 4 | 5 | 6 |
|---|---|---|---|---|---|---|
| Frequency | 30 | 40 | 50 | 20 | 30 | 30 |
Answer: The total number of times the die is thrown is 200. We need to calculate the probability of getting an outcome less than 5.
Outcomes less than 5 are 1, 2, 3, and 4.
Sum of frequencies for these outcomes = Frequency of 1 + Frequency of 2 + Frequency of 3 + Frequency of 4
Favorable outcomes = 30 + 40 + 50 + 20 = 140.
Probability of outcome less than 5 = \( \frac{140}{200} = \frac{7}{10} = 0.7 \)
In simple words: The numbers less than 5 are 1, 2, 3, and 4. Adding their frequencies gives 140. The probability is 140 out of 200, which simplifies to 7 out of 10.
Exam Tip: Do not count the frequency of 5 itself, since "less than 5" means numbers strictly below 5.
Question : 1000 families with 2 children were selected randomly and the following data was recorded: If a family is chosen at random, compute the probability that it has 1. no girl, 2. at least one girl.
| Number of girls in a family | 0 | 1 | 2 |
|---|---|---|---|
| Number of families | 200 | 500 | 300 |
Answer: The total number of randomly selected families is 1000.
1. Probability of having no girls (0 girls):
Number of families with 0 girls = 200.
Probability = \( \frac{200}{1000} = \frac{1}{5} = 0.2 \).
2. Probability of having at least one girl (1 or 2 girls):
Number of families with at least one girl = Families with 1 girl + Families with 2 girls
Favorable outcomes = 500 + 300 = 800.
Probability = \( \frac{800}{1000} = \frac{4}{5} = 0.8 \).
In simple words: 1) 200 out of 1000 families have no girls (0.2 chance). 2) 800 out of 1000 families have either 1 or 2 girls (0.8 chance).
Exam Tip: "At least one" means you must sum up all categories containing 1 or more of the specified item.
Question : To know the opinion of students about mathematics, a survey of 100 students was conducted. The data is recorded in the following table: Find the probability that a student chosen at random 1. likes mathematics, 2. dislikes mathematics.
| Opinion | Like | Dislike |
|---|---|---|
| Number of Students | 70 | 30 |
Answer: The total number of surveyed students is 100.
1. Probability that a student chosen at random likes mathematics:
Number of students who like mathematics = 70.
Probability = \( \frac{70}{100} = \frac{7}{10} = 0.7 \).
2. Probability that a student chosen at random dislikes mathematics:
Number of students who dislike mathematics = 30.
Probability = \( \frac{30}{100} = \frac{3}{10} = 0.3 \).
In simple words: 70 out of 100 students like math (0.7 probability), and the other 30 dislike it (0.3 probability).
Exam Tip: Confirm that the sum of all individual probabilities of the sample space is equal to 1 (\( 0.7 + 0.3 = 1 \)) to verify your result.
Question : 8 bags of wheat flour, each marked 10 kg, actually contained the following weights of flour(in kg) 10.01, 9.97, 10.03, 9.96, 10.04, 10.06, 10.02, 9.98 Find the probability that any of these bags chosen at random contain less than 10 kg of wheat.
Answer: The total number of wheat flour bags is 8.
We need to find how many bags weigh less than 10 kg. Checking the list of weights:
9.97 kg, 9.96 kg, and 9.98 kg are less than 10 kg.
So, the number of bags weighing less than 10 kg is 3.
Probability = \( \frac{3}{8} = 0.375 \).
In simple words: Out of 8 total bags, only 3 weigh less than 10 kg. So, the chance of picking a lighter bag is 3 out of 8.
Exam Tip: Examine each decimal value closely so you do not overlook any number that is slightly below 10 kg.
Question : A cycle manufacturing company kept a record of recycling of tyres and maintained the record of distance covered by it. Table given below shows the record of 100 tyres: What will be the probability to replace a tyre less than 5000 km ?
| Distance (in km) | 0-2000 | 2000-5000 | 5000-7000 | 7000-10000 |
|---|---|---|---|---|
| Frequency | 30 | 50 | 10 | 10 |
Answer: The total number of tyres recorded is 100.
We need to find the probability of replacing a tyre that has covered less than 5000 km.
The categories representing distances less than 5000 km are "0-2000" and "2000-5000".
Number of tyres with less than 5000 km = 30 + 50 = 80.
Probability = \( \frac{80}{100} = \frac{4}{5} = 0.8 \).
In simple words: 80 out of 100 tyres lasted less than 5000 km. The probability of choosing one of these tyres is 80 out of 100, which simplifies to 4 out of 5.
Exam Tip: Combine the frequencies of all intervals that fall entirely below the target value (5000 km).
Question : In a match, a batsman hits a boundary 6 times out of 30 balls he plays. Find the probability that he did not hit a boundary.
Answer: The total number of balls played is 30. The batsman hits a boundary on 6 balls.
Number of balls on which he did not hit a boundary = 30 - 6 = 24.
Probability of not hitting a boundary = \( \frac{24}{30} = \frac{4}{5} = 0.8 \).
In simple words: Out of 30 balls, the batsman did not hit a boundary on 24 of them. The probability is 24 out of 30, which simplifies to 4 in 5 (or 80%).
Exam Tip: An alternative method is to compute \( 1 - P(\text{boundary}) = 1 - \frac{6}{30} = 1 - \frac{1}{5} = \frac{4}{5} \).
Question : On one page of a telephone directory, there were 210 telephone numbers. The frequency distribution of their unit place is given as follows: Without looking at the page, the pencil is placed on one of these number and the number is chosen at random.What is the probability that the digit in its unit place is multiple of 3?
| Digits | 0 | 1 | 2 | 3 | 4 | 5 | 6 | 7 | 8 | 9 |
|---|---|---|---|---|---|---|---|---|---|---|
| Frequency | 10 | 20 | 30 | 40 | 10 | 20 | 30 | 5 | 30 | 15 |
Answer: The total number of telephone numbers is 210.
The digits from 0 to 9 that are multiples of 3 are 3, 6, and 9.
Sum of frequencies for 3, 6, and 9 = Frequency of 3 + Frequency of 6 + Frequency of 9
Favorable outcomes = 40 + 30 + 15 = 85.
Probability = \( \frac{85}{210} = \frac{17}{42} \).
In simple words: The unit place digits that can be divided by 3 are 3, 6, and 9. They appear 85 times in total. So, the probability is 85 out of 210, which simplifies to 17 out of 42.
Exam Tip: Clearly write down which digits are considered "multiples of 3" (3, 6, and 9) to justify your favorable outcomes.
Question : The record of a weather station shows that out of the past 200 consecutive days,its weather forecasts were correct 180 times. What is the probability that on a given day it was correct and also find the probability on a given day it was not correct?
Answer: The total number of recorded days is 200.
1. Probability of a correct forecast:
Number of correct forecast days = 180.
Probability = \( \frac{180}{200} = \frac{9}{10} = 0.9 \).
2. Probability of an incorrect forecast:
Number of incorrect forecast days = 200 - 180 = 20.
Probability = \( \frac{20}{200} = \frac{1}{10} = 0.1 \).
In simple words: The weather station was correct 90% of the time (0.9 probability) and incorrect 10% of the time (0.1 probability) over 200 days.
Exam Tip: Check that your calculated probabilities add up to exactly 1 (\( 0.9 + 0.1 = 1 \)) to confirm accuracy.
Question : A die is thrown, find the probability of getting (i) a prime number (ii) an even number.
Answer: When throwing a standard six-sided die, the possible outcomes are {1, 2, 3, 4, 5, 6}, which is 6 outcomes in total.
(i) Probability of getting a prime number:
The prime numbers on a die are 2, 3, and 5 (note that 1 is not prime).
Number of favorable outcomes = 3.
Probability = \( \frac{3}{6} = \frac{1}{2} = 0.5 \).
(ii) Probability of getting an even number:
The even numbers on a die are 2, 4, and 6.
Number of favorable outcomes = 3.
Probability = \( \frac{3}{6} = \frac{1}{2} = 0.5 \).
In simple words: (i) Out of 6 numbers on a die, 3 are prime (2, 3, 5), giving a 1 in 2 chance. (ii) 3 numbers are even (2, 4, 6), also giving a 1 in 2 chance.
Exam Tip: Keep in mind that 1 is neither a prime nor a composite number, so do not count it as a prime number.
Question : 10 bags of rice, each marked 6 kg, actually contained the following weights of rice (in kg): 5.96 6.06 6.09 6.04 6.00 6.07 5.99 6.11 5.93 6.00 Then find the probability that any of these bags chosen at random contains more than 6 kg.
Answer: There are 10 bags of rice in total.
We need to count how many bags weigh more than 6 kg.
The weights strictly greater than 6 kg are: 6.06 kg, 6.09 kg, 6.04 kg, 6.07 kg, and 6.11 kg.
There are 5 bags that satisfy this condition.
Probability = \( \frac{5}{10} = \frac{1}{2} = 0.5 \).
In simple words: Exactly 5 out of the 10 bags weigh more than 6 kg. So, the chance of choosing one of these bags is 5 out of 10, which is 1 in 2.
Exam Tip: Do not count bags that weigh exactly 6.00 kg when the question asks for "more than 6 kg."
Question : The distance (in km) of 40 engineers from their residence to their place of work were found as follows. 5 3 10 20 25 11 13 7 12 31 19 10 12 17 18 11 32 17 16 2 7 9 7 8 3 5 12 15 18 3 12 14 2 9 6 15 15 7 6 12 What is the empirical probability that an engineer lives: (i) less than 7 km from her place of work? (ii) more than or equal to 7 km from her place of work? (iii) within ½ km from her place of work?
Answer: The total number of engineers is 40.
(i) Probability that an engineer lives less than 7 km from work:
Distances strictly less than 7 km are: 5, 3, 2, 3, 5, 3, 2, 6, 6.
There are 9 engineers in this range.
Probability = \( \frac{9}{40} = 0.225 \).
(ii) Probability that an engineer lives more than or equal to 7 km from work:
The number of such engineers = Total engineers - Engineers living less than 7 km = 40 - 9 = 31.
Probability = \( \frac{31}{40} = 0.775 \).
(iii) Probability that an engineer lives within ½ km from work:
There are no recorded distances less than or equal to 0.5 km.
Number of engineers = 0.
Probability = \( \frac{0}{40} = 0 \).
In simple words: (i) 9 engineers live under 7 km away (probability 9/40). (ii) 31 engineers live 7 km or more away (probability 31/40). (iii) No engineer lives under 0.5 km away, so the probability is 0.
Exam Tip: "Within ½ km" is an impossible event in this sample since the smallest value in the dataset is 2. The probability of an impossible event is always 0.
Question : In Cherrapunji, it rains for 200 days in an ordinary year, find the probability that (i) there will not be rain in that year, (ii) there will be rain in that year.
Answer: An ordinary year has 365 days. We assume the question is asking for the probability of rain on a randomly selected day in that year.
(i) Probability of no rain on a given day:
Number of non-rainy days = 365 - 200 = 165 days.
Probability = \( \frac{165}{365} = \frac{33}{73} \).
(ii) Probability of rain on a given day:
Number of rainy days = 200 days.
Probability = \( \frac{200}{365} = \frac{40}{73} \).
In simple words: Out of 365 days in a standard year, it rains on 200 days and does not rain on 165 days. On a random day, the chance of rain is 40/73, and the chance of no rain is 33/73.
Exam Tip: Be sure to write down the total number of days in an ordinary year (365 days) before calculating.
Question : In a cricket match, a batsman hits the ball 24 times out of 72 balls he plays. Find the probability that he did not hit the ball.
Answer: The total number of balls played is 72. The batsman hits the ball 24 times.
Number of times he did not hit the ball = 72 - 24 = 48.
Probability of not hitting the ball = \( \frac{48}{72} = \frac{2}{3} \).
In simple words: Out of 72 balls, the batsman missed hitting the ball 48 times. This means there is a 2 in 3 chance that he did not hit the ball.
Exam Tip: Simplify your final fraction to its simplest form. Dividing the numerator and denominator of \( \frac{48}{72} \) by 24 yields \( \frac{2}{3} \).
Question : 100 plants each, were planted in 100 schools during Van Mahotsava. After one month, the no. of plants that survived were recorded as in data below: When a school is selected of random for inspection what is the probability of (i) more than 25 plants survived in school? (ii)less than 61 plants survived in the school?
| No. of plants survived | less than 25 | 26-50 | 51-60 | 61-70 | more than 70 | total no. of schools |
|---|---|---|---|---|---|---|
| No. of schools = frequency | 15 | 20 | 30 | 30 | 5 | 100 |
Answer: The total number of schools is 100.
(i) Probability of more than 25 plants surviving in a school:
This includes all categories except "less than 25".
Number of schools = 20 + 30 + 30 + 5 = 85.
Probability = \( \frac{85}{100} = \frac{17}{20} = 0.85 \).
(ii) Probability of less than 61 plants surviving in a school:
This includes the classes "less than 25", "26-50", and "51-60".
Number of schools = 15 + 20 + 30 = 65.
Probability = \( \frac{65}{100} = \frac{13}{20} = 0.65 \).
In simple words: (i) There are 85 schools where more than 25 plants lived (85% probability). (ii) There are 65 schools where less than 61 plants lived (65% probability).
Exam Tip: Be careful with boundaries; "less than 61" means you sum up all categories up to the "51-60" group, excluding "61-70."
Question : A teacher wanted to analyse the performance of two sections of students in a mathematics test of 100 marks. Looking at their performances, she found that a few students got under 20 marks and a few got 70 marks or above. So she decided to group them into intervals of varying sizes as follows: 0 − 20, 20 − 30… 60 − 70, 70 − above. Then she formed the following table: (i) Find the probability that a student obtained less than 20 % in the mathematics test. (ii) Find the probability that a student obtained marks 60 or above.
| Marks | Number of student |
|---|---|
| 0 - 20 | 7 |
| 20 - 30 | 10 |
| 30 - 40 | 10 |
| 40 - 50 | 20 |
| 50 - 60 | 20 |
| 60 - 70 | 15 |
| 70 - above | 8 |
| Total | 90 |
Answer: The total number of students is 90.
(i) Probability that a student obtained less than 20% (less than 20 marks out of 100):
The number of students in the "0-20" marks interval is 7.
Probability = \( \frac{7}{90} \).
(ii) Probability that a student obtained marks 60 or above:
This includes students in the "60-70" and "70-above" intervals.
Number of students = 15 + 8 = 23.
Probability = \( \frac{23}{90} \).
In simple words: (i) Only 7 out of 90 students got below 20% on the test (probability 7/90). (ii) 23 students got 60 marks or more, which gives a probability of 23/90.
Exam Tip: Since a 100-mark test is used, "less than 20%" translates directly to "less than 20 marks." Identify the class interval matching this definition.
Question : To know the opinion of the students about the subject Maths, a survey of 200 students was conducted. The data is recorded in the following table. Find the probability that a student chosen at random (i) likes Maths, (ii) does not like it.
| Opinion | Number of students |
|---|---|
| like | 135 |
| dislike | 65 |
Answer: The total number of students is 200.
(i) Probability that a randomly chosen student likes Maths:
Number of students who like Maths = 135.
Probability = \( \frac{135}{200} = \frac{27}{40} = 0.675 \).
(ii) Probability that a randomly chosen student does not like Maths:
Number of students who dislike Maths = 65.
Probability = \( \frac{65}{200} = \frac{13}{40} = 0.325 \).
In simple words: (i) 135 out of 200 students like math, so the chance is 27/40. (ii) 65 out of 200 students dislike math, which gives a chance of 13/40.
Exam Tip: Simplify fractions like \( \frac{135}{200} \) and \( \frac{65}{200} \) by dividing both the numerator and the denominator by their greatest common divisor, which is 5.
Question : An organization selected 2400 families at random and surveyed them to determine a relationship between income level and the number of vehicles in a family. The information gathered is listed in the table below: Suppose a family is chosen, find the probability that the family chosen is (i) earning Rs 10000 − 13000 per month and owning exactly 2 vehicles. (ii) earning Rs 16000 or more per month and owning exactly 1 vehicle. (iii) earning less than Rs 7000 per month and does not own any vehicle. (iv) earning Rs 13000 − 16000 per month and owning more than 2 vehicles.
| Monthly income (in Rs) | Vehicles per family | |||
|---|---|---|---|---|
| 0 | 1 | 2 | Above 2 | |
| Less than 7000 | 10 | 160 | 25 | 0 |
| 7000 - 10000 | 0 | 305 | 27 | 2 |
| 10000 - 13000 | 1 | 535 | 29 | 1 |
| 13000 - 16000 | 2 | 469 | 59 | 25 |
| 16000 or more | 1 | 579 | 82 | 88 |
Answer: The total number of families surveyed is 2400.
(i) Probability of choosing a family earning Rs 10000 - 13000 per month and owning exactly 2 vehicles:
Number of families = 29.
Probability = \( \frac{29}{2400} \).
(ii) Probability of choosing a family earning Rs 16000 or more per month and owning exactly 1 vehicle:
Number of families = 579.
Probability = \( \frac{579}{2400} = \frac{193}{800} \).
(iii) Probability of choosing a family earning less than Rs 7000 per month and owning 0 vehicles:
Number of families = 10.
Probability = \( \frac{10}{2400} = \frac{1}{240} \).
(iv) Probability of choosing a family earning Rs 13000 - 16000 per month and owning more than 2 vehicles:
Number of families = 25.
Probability = \( \frac{25}{2400} = \frac{1}{96} \).
In simple words: Reading directly from the table: (i) 29 families out of 2400 meet this condition. (ii) 579 out of 2400 meet this. (iii) 10 out of 2400 own no vehicle. (iv) 25 out of 2400 own more than 2 vehicles.
Exam Tip: Locate the specified income row first, and then trace horizontally to the correct column of vehicle counts to avoid picking the wrong number.
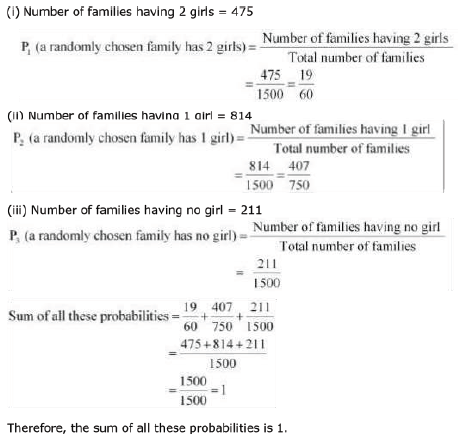
Question : 1500 families with 2 children were selected randomly, and the following data were recorded: Compute the probability of a family, chosen at random, having (i) 2 girls (ii) 1 girls (iii) No girl.
| Number of girls in a family | 2 | 1 | 0 |
|---|---|---|---|
| Number of families | 475 | 814 | 211 |
Answer: The total number of families is 1500.
(i) Probability of choosing a family having 2 girls:
Number of families with 2 girls = 475.
Probability = \( \frac{475}{1500} = \frac{19}{60} \).
(ii) Probability of choosing a family having 1 girl:
Number of families with 1 girl = 814.
Probability = \( \frac{814}{1500} = \frac{407}{750} \).
(iii) Probability of choosing a family having no girls (0 girls):
Number of families with 0 girls = 211.
Probability = \( \frac{211}{1500} \).
In simple words: Out of 1500 families: (i) 475 have 2 girls, giving a chance of 19/60. (ii) 814 have 1 girl, giving a chance of 407/750. (iii) 211 have no girls, giving a chance of 211/1500.
Exam Tip: You can verify that your calculations are correct by adding the three fractions: \( \frac{475}{1500} + \frac{814}{1500} + \frac{211}{1500} = \frac{1500}{1500} = 1 \).
Question : 50 seeds were selected at random from each of 5 bags of seeds, and were kept under stadardised conditions favourable to germination. After 20 days, the number of seeds which had germinated in each collection were counted and recorded as follows: What is the probability of germination of (i)more than 40 seeds in a bag? (ii)49 seeds in a bag? (iii)more that 35 seeds in a bag?
| Bag | 1 | 2 | 3 | 4 | 5 |
|---|---|---|---|---|---|
| Number of seeds germinated | 40 | 48 | 42 | 29 | 41 |
Answer: The total number of bags under observation is 5.
(i) Probability that more than 40 seeds germinated in a bag:
The bags with more than 40 germinated seeds are Bag 2 (48), Bag 3 (42), and Bag 5 (41).
Number of bags = 3.
Probability = \( \frac{3}{5} = 0.6 \).
(ii) Probability that exactly 49 seeds germinated in a bag:
There is no bag in the table with exactly 49 germinated seeds.
Number of bags = 0.
Probability = \( \frac{0}{5} = 0 \).
(iii) Probability that more than 35 seeds germinated in a bag:
The bags with more than 35 germinated seeds are Bag 1 (40), Bag 2 (48), Bag 3 (42), and Bag 5 (41).
Number of bags = 4.
Probability = \( \frac{4}{5} = 0.8 \).
In simple words: (i) 3 out of 5 bags had more than 40 seeds sprout (0.6 chance). (ii) No bag had exactly 49 seeds sprout (0 chance). (iii) 4 out of 5 bags had more than 35 seeds sprout (0.8 chance).
Exam Tip: Be careful with strict inequalities: "more than 40" does not include the bag with exactly 40, whereas "more than 35" does include the bag with 40 seeds.
Free study material for Mathematics
CBSE Class 9 Mathematics Assignments for Chapter 15 Probability
Chapter Practice Questions for Class 9 Mathematics
Explore reliable practice questions for Chapter 15 Probability tailored for Class 9 learners. Use these structured worksheets to evaluate preparedness and strengthen core problem-solving skills.
Why Practice Class 9 Mathematics Assignments?
- Exam Alignment: Questions strictly follow contemporary CBSE sample papers and grading schemes.
- Comprehensive Coverage: Features objective drills, case studies, and structured descriptive problems for Chapter 15 Probability.
- Pacing & Precision: Regular problem-solving builds critical calculation speed and test-taking accuracy.
How to Approach Mathematics Chapter 15 Probability Assignments
- Textbook Review: Always study the core NCERT book for Class 9 Mathematics prior to beginning the assignment.
- Independent Attempt: Solve Chapter 15 Probability questions on your own initially before cross-checking with expert solutions.
- Error Tracking: Record challenging concepts in a dedicated notebook and practice online MCQ tests for revision.
FAQs
You can download free PDF assignments for Class 9 Mathematics Chapter 15 Probability from StudiesToday.com. These practice sheets have been updated for the 2026-27 session covering all concepts from latest NCERT textbook.
Yes, our teachers have given solutions for all questions in the Class 9 Mathematics Chapter 15 Probability assignments. This will help you to understand step-by-step methodology to get full marks in school tests and exams.
Yes. These assignments are designed as per the latest CBSE syllabus for 2026. We have included huge variety of question formats such as MCQs, Case-study based questions and important diagram-based problems found in Chapter 15 Probability.
Practicing topicw wise assignments will help Class 9 students understand every sub-topic of Chapter 15 Probability. Daily practice will improve speed, accuracy and answering competency-based questions.
Yes, all printable assignments for Class 9 Mathematics Chapter 15 Probability are available for free download in mobile-friendly PDF format.