

Download Class 8 Mathematics Practice Worksheets
Review targeted academic worksheets with the CBSE Class 8 Mathematics Data Handling Worksheet Set 03. Built according to official educational standards for the 2026-27 term, these downloadable Class 8 Mathematics resources support effective daily practice and detailed self-evaluation for Chapter 05 Data Handling.
Access Chapter 05 Data Handling Practice Papers and Solutions
View or download the dedicated CBSE Class 8 Mathematics Data Handling Worksheet Set 03 resource below. Engaging with these practice papers under focused study conditions ensures continuous academic progress and mastery of the 2026-27 curriculum for Chapter 05 Data Handling.
1 From the frequency table, the percentage of families with less than 3 children is x/40 X 100 %.
| Number of children | 0 | 1 | 2 | 3 | 4 |
| Number of families | 2 | 5 | 11 | 15 | 7 |
Find the value of ·x:
(A) 7
(B) 15
(C) 11
(D) 18
Answer : D
2 A survey was carried out for the purpose of determining the number of children in each family. The results are shown in the table.
| Number of children | 0 | 1 | 2 | 3 | 4 |
| No . of families | 1 | 4 | 7 | 6 | 2 |
Calculate the percentage of families which have more than 2 children.
(A) 35%
(B) 40%
(C) 60%
(D) 75%
Answer : B
3 The scores obtained by a group of participants in a game are shown in the table. A participant who scores more than 3 points receives a hamper.
| Number of children | 2 | 3 | 4 | 5 |
| No . of families | 104 | 16 | y | 34 |
If the number of participants who do not receive hampers is twice the number of those who do, find the value of Y
(A) 2
(B) 26
(C) 32
(D) 68
Answer : B
4 The table shows the distr ibution of marks in an English test. Grade B is given to marks ranging from 40 to 54.
| Marks | Frequen |
| 30 - 34 | 2 |
| 35 - 39 | 8 |
| 40 - 44 | 13 |
| 45 - 49 | 8 |
| 50 - 54 | 5 |
| 55 - 59 | 4 |
Calculate the percentage of pupils who obta ined grade B.
(A) 26%
(B) 52%
(C) 65%
(D) 75%
Answer : C
5 The table shows the type and number of cakes sold by a bakery. In a pictograph, one symbol represents 5 cakes.
| Types of cakes | Number of cakes |
| P | 50 |
| Q | 35 |
| R | 45 |
How many symbols are required to represent the number of the best-selling type of cake ?
(A) 5
(B) 9
(C) 10
(D) 15
Answer : C
6 The pictogram shows the number of pupils who cycle to school
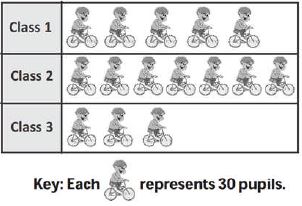
What i s the total number of pupils who cycle to school ?
(A) 15
(B) 300
(C) 420
(D) 450
Answer : D
7 The pictogram shows the number of visitors to an exhibition in a particular week.
| Monday | 🙂🙂🙂🙂 |
| Tuesday | 🙂🙂 |
| Wednesday | 🙂🙂🙂 |
| Wednesday | 🙂🙂🙂🙂🙂🙂 |
| Friday | 🙂🙂🙂🙂 |
Key: Each 🙂 represents 6 visitors.
What is the number of visitors recorded after Wednesday ?
(A) 10
(B) 18
(C) 60
(D) 70
Answer : C
8 The bar chart shows the number of cellphones sold by a shop on 5 days of a certain week. The difference between the highest number and the lowest number of cell phones sold is 15.
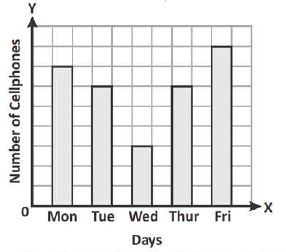
Find the number of cellphones sold on Thursday.
(A) 6
(B) 12
(C) 18
(D) 24
Answer : C
9 Which of the following experiments has equally likely outcomes ?
(A) Choose a number at random from 1 to 7.
(B) Toss a coin.
(C) Roll a die.
(D) All the above.
Answer : D
10 The bar chart shows the number of television sets sold by a shop in 5 months.
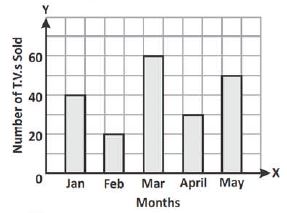
What is the sales in May, as a percentage of the total sales in the 5 months ?
(A) 25%
(B) 33(1/3)%
(C) 50%
(D) 66(2/3)%
Answer : A
11 The table shows the frequency distribution of grades obtained by 120 students. The data is represented in the following pie chart.
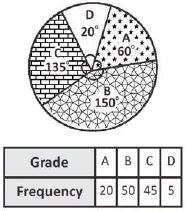
Which sector is labelled incorrectly ?
(A) A
(B) B
(C) C
(D) D CD
Answer : D
12 Which of the following is an outcome?
(A) Rolling a pair of dice.
(B) A die landing on red.
(C) Choosing 2 marbles from ajar.
(D) Picking a card from a pack of 52 cards.
Answer : B
13 The table shows the number of cups of four different beverages sold by a coffee shop on a certain day.
| Beverage | Number of cups |
| Coffee | 60 |
| Tea | 75 |
| Hot chocolate | 25 |
| Milk | 40 |
What is the angle of sector in a pie chart representing tea ?
(A) 40°
(B) 135°
(C) 108°
(D) no
Answer : B
14 The pie chart shows the examination grades obtained by a group of students

Which of the following statements about the pie chart is true ?
(A) 15% of the students scored grade B.
(B) 90% of the students scored grade A.
(C) 1/3 of the students scored grade C.
(D) 1/4 of the students scored grade B .
Answer : C
15 What is the probability of choosing a vowel from the alphabet ?
(A) 21/26
(B) 5/26
(C) 1/21
(D) 5/21
Answer : B
16 The pie chart shows the number of participants from four countries P. Q, Rand S taking part in a tennis tournament.
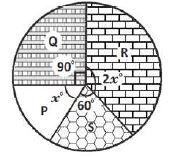
Given that there are 18 participants from country S, find the number of participants from country R.
(A) 18
(C) 27
(B) 21
(D) 42
Answer : D
17 The table shows the number of three different brands of laptops sold by a certain store. The data is represented by the pie chart which shows a semicircle divided into six equal sectors.
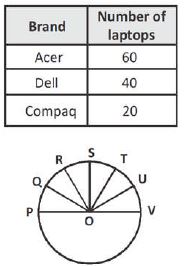
What is the angle of sector representing the number of Dell laptops sold ?
(A) ∠ POR
(C) ∠ QOT
(B) ∠ ROV
(D) ∠ POU
Answer : B
(18-21): The histogram shows the number of members in the families of the pupi Is of Class VIII.
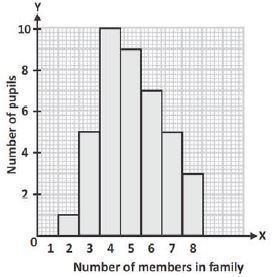
18 Study the histogram and answer the following questions.
What is the enrolment of Class VIII?
(A) 40
(B) 50
(C) 60
(D) 70
Answer : A
19 The ma ximum number of pupils have families with 'n' members. What is the value of 'n'?
(A) n = 1
(C) n = 2
(B) n = 4
(D) n = 3
Answer : B
20 What is the total number of people in 5- member fami lies ?
(A) 22
(C) 45
(B) 25
(D) 50
Answer : C
21 What pe rcentage of the pupils co me from fami lies w ith more than 5 members?
(A) 20.5%
(C) 50%
(B) 21.5%
(D) 37.5%
Answer : D
22 What is the probability of getting an ace from a well shuffled deck of 52 playing cards?
(A) 1/13
(B) 2/13
(C) 3/13
(D) 4/13
Answer : A
23 The pie chart shows the distribution of grades obtained by a group of students in a test. The number of students who scored grade C is twice the number who scored grade B, and 3/5 of the students scored grades B an d C.
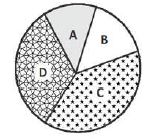
Find the angle of the sector which represents grade C.
(A) 108°
(B) 144°
(C) 216°
(D) 288°
Answer : B
24 Which of the following is an experiment?
(A) Tossing a coin.
(B) Rolling a single 6-sided die.
(C) Choosing a marble from a jar.
(D) All of the above.
Answer : D
25 A number from 1 to 11 is chosen at random. What is the probability of choosing an odd number ?
(A) 1/11
(B) 5/11
(C) 6/11
(D) 3/26
Answer : C
26 The following frequency table shows the number of occupants in each flat in an apartment.
| Num ber of occupants | Num ber of units (frequency) |
| 1 | 2 |
| 2 | 5 |
| 3 | 8 |
| 4 | 14 |
| 5 | 12 |
| 6 | 9 |
| 7 | 4 |
Find the percentage of the flats with fewer than 4 occupants.
(A) 25%
(B) 27.8%
(C) 42 %
(D) 35 %
Answer : B
27 The table shows the grades obtained by a group of students in an examination
| Grade | Number of students |
| A | 45 |
| B | 60 |
| C | 80 |
| D | 15 |
If the given information is illustrated using a pie chart, what is the angle of the sector that represents grade A ?
(A) 45°
(B) 65°
(B) 81°
(D) 100°
Answer : B
(28-31): Numbers 1 to 10 are written on ten separate slips (one number on one slip), kept in a box and mixed well. One slip is chosen from the box without looking into it.
28 What is the probability of getting the number 6?
(A) 1/10
(B) 2/20
(C) 1/30
(D) 1/15
Answer : A
29 What is the probability of getting a number less than 6?
(A) 1/3
(B) 1/2
(C) 2/3
(D) 4/3
Answer : B
30 What is the probability of getting a number greater than 6 ?
(A) 1/5
(B) 3/5
(C) 2/5
(D) 4/5
Answer : C
31 What is the probability of getting a 1-digit number ?
(A) 2/10
(B) 3/10
(C) 4/10
(D) 9/10
Answer : D
32 A school has a strength of 2000 students.
The following pie chart shows the interests of students indifferent subjects.

What is the number of students interested in Maths ?
(A) 700
(C) 200
(B) 600
(D) 500
Answer : A
Please refer to the link below for CBSE Class 8 Mathematics Worksheet - Data Handling
5. Data Handling
Q 1 Define raw data.
Answer: Data available in an unorganized form or as initial observations collected from a survey or experiment is called raw data.
In simple words: Raw data is the starting set of facts and figures before any sorting or analysis.
Exam Tip: Use keywords like "unorganized form" and "initial observations" to secure full marks.
Q 2 Define frequency.
Answer: Frequency is the number of times a particular observation or data value occurs in a given set of data.
In simple words: Frequency tells you how often a specific item or number appears in a list.
Exam Tip: Remember that frequency is simply a count of occurrences.
Q 3 Define width or size of the class interval.
Answer: The width or size of a class interval is the difference between its upper class limit and its lower class limit. Formula: Width = Upper limit - Lower limit.
In simple words: It is the range or length covered by each group in a grouped frequency table.
Exam Tip: Always state the formula \(\text{Upper limit} - \text{Lower limit}\) for clarity.
Q 4 Define upper class limit and lower class limit.
Answer: In a class interval, the lower value is called the lower class limit, and the higher value is called the upper class limit. For example, in the interval 10 - 20, 10 is the lower class limit and 20 is the upper class limit.
In simple words: The lower limit is the starting number of a group, and the upper limit is the ending number.
Exam Tip: Give a numerical example to clearly illustrate both limits.
Q 5 What is a circle graph or pie chart?
Answer: A circle graph or pie chart is a circular chart divided into sectors, where each sector represents the proportion of a part to the whole data.
In simple words: It is a pie-shaped graph used to show percentages or fractions of a total amount.
Exam Tip: Mention that the total angle of the circle is \(360^\circ\) and total percentage is 100 percent.
Q 6 Define an event.
Answer: An event in probability is a collection of one or more outcomes of an experiment.
In simple words: An event is the specific result or set of results you are looking for from an activity.
Exam Tip: Keep the definition concise and directly linked to experimental outcomes.
Q 7 What is the probability of an event?
Answer: The probability of an event is a measure of the likelihood that the event will occur. Formula: Probability = \(\frac{\text{Number of favorable outcomes}}{\text{Total number of possible outcomes}}\).
In simple words: Probability is the mathematical chance of something happening, expressed as a fraction or decimal between 0 and 1.
Q 8 In an experiment of tossing a coin once, what is the probability of getting a head?
Answer: Total possible outcomes when tossing a coin = 2 (Head, Tail)
Number of favorable outcomes (getting a head) = 1
Probability of getting a head = \(\frac{1}{2}\)
In simple words: Since a coin has two equal sides and one is a head, the chance is 1 out of 2.
Exam Tip: List total outcomes explicitly to avoid silly errors.
Q 9 If a die marked with 1, 2, 3, 4, 5, 6 on its faces is thrown, what is the probability of getting the number 3?
Answer: Total possible outcomes when throwing a die = 6 (1, 2, 3, 4, 5, 6)
Number of favorable outcomes (getting the number 3) = 1
Probability = \(\frac{1}{6}\)
In simple words: A die has 6 faces, and the number 3 appears only once, so the probability is \(\frac{1}{6}\).
Exam Tip: Mention the sample space {1, 2, 3, 4, 5, 6} for complete presentation.
Q 10 On spinning the wheel, (i) what will be the probability of getting a green (G) sector? (ii) what will be the probability of not getting a green (G) sector?
Answer: Total sectors on the wheel = 8
Number of green (G) sectors = 5
Number of red (R) sectors = 3
(i) Probability of getting a green sector = \(\frac{5}{8}\)
(ii) Probability of not getting a green sector = \(1 - \frac{5}{8} = \frac{3}{8}\)
In simple words: Count the green sectors for the first part, and count the non-green (red) sectors for the second part.
Exam Tip: You can also find the second part by subtracting the probability of the event from 1 (\(P(\text{not G}) = 1 - P(\text{G})\)).
Q 11 A bag has 10 red marbles and 6 blue marbles. A marble is drawn from the bag without looking into the bag. What is the probability of getting a blue marble?
Answer: Number of red marbles = 10
Number of blue marbles = 6
Total number of marbles = \(10 + 6 = 16\)
Number of favorable outcomes (blue marbles) = 6
Probability of getting a blue marble = \(\frac{6}{16} = \frac{3}{8}\)
In simple words: Divide the number of blue marbles by the total number of marbles and simplify the fraction.
Exam Tip: Always reduce fractions to their simplest form (\(\frac{6}{16}\) reduces to \(\frac{3}{8}\)).
Q 12 A bag has 4 red balls and 6 yellow balls. A ball is drawn from the bag without looking into the bag. Find the probability of getting a red ball.
Answer: Number of red balls = 4
Number of yellow balls = 6
Total number of balls = \(4 + 6 = 10\)
Number of favorable outcomes (red balls) = 4
Probability of getting a red ball = \(\frac{4}{10} = \frac{2}{5}\)
In simple words: Out of 10 total balls, 4 are red, giving a probability of \(\frac{4}{10}\) or \(\frac{2}{5}\).
Exam Tip: Show addition of total balls clearly before calculating probability.
Q 13 Define random experiment.
Answer: A random experiment is an experiment in which all possible outcomes are known beforehand, but the exact outcome that will occur in any particular trial cannot be predicted in advance.
In simple words: An activity where you know what could happen, but you do not know for sure what will happen each time you do it.
Exam Tip: Give examples like tossing a coin or rolling a die to strengthen your answer.
Q 14
| Subject | Number of students |
|---|---|
| Art | 7 |
| Maths | 8 |
| Science | 6 |
| English | 5 |
Answer the following question from the table given above.
1. Which is the most liked subject?
2. Which is the least liked subject?
Answer:
1. Most liked subject: Maths (highest number of students = 8)
2. Least liked subject: English (lowest number of students = 5)
In simple words: Look for the highest number for most liked and lowest number for least liked.
Exam Tip: Directly reference the table values in your answer.
Q 15 Answer the following questions from the above histogram.
1. How many teachers are of age 45 years or more but less than 50 years?
2. How many teachers are of age less than 35 years?
Answer:
1. Number of teachers of age 45 to 50 years = 5
2. Number of teachers of age less than 35 years = Sum of frequencies for intervals 20-25, 25-30, and 30-35 = \(4 + 5 + 6 = 15\)
In simple words: Read the bar heights directly for the first part, and add the bar heights for all age groups below 35 for the second part.
Exam Tip: Be careful with interval ranges when summing frequencies.
Q 16 Frequency distribution of income of 20 workers
Class interval: 100 - 125, Frequency: 5
Class interval: 125 - 150, Frequency: 6
Class interval: 150 - 200, Frequency: 4
Class interval: 200 - 250, Frequency: 3
Class interval: 250 - 300, Frequency: 2
Answer the following questions from the frequency table.
1) What is the class size of the class interval?
2) Which class has the highest frequency?
3) Which class has the lowest frequency?
4) Which class has 3 as its frequency?
Answer:
1) Class size for 100 - 125 is \(125 - 100 = 25\)
2) Class with highest frequency: 125 - 150 (frequency = 6)
3) Class with lowest frequency: 250 - 300 (frequency = 2)
4) Class with 3 as frequency: 200 - 250
In simple words: Subtract limits to find class size, and inspect the table to answer the remaining questions.
Exam Tip: Note that class sizes may vary across intervals, but for 100-125 it is 25.
Q 17 Make a discrete frequency distribution table for the given ages of 25 students of class VIII.
15, 16, 16, 14, 17, 17, 16, 15, 15, 16, 16, 17, 15, 16, 16, 14, 16, 15, 14, 15, 16, 16, 15, 14, 15
Answer:
Let us count the frequency of each age:
| Age (in years) | Tally Marks | Frequency |
|---|---|---|
| 14 | IIII | 4 |
| 15 | HH II | 9 |
| 16 | HH HH | 9 |
| 17 | III | 3 |
| Total | - | 25 |
In simple words: Count how many times each age appears and record it in a table using tally marks.
Exam Tip: Always verify that the sum of all frequencies equals the total number of students (25).
Q 18 Answer the following questions based on the given pie chart.
1. What proportion of the sector for hours is spent in sleeping?
2. What proportion of the sector for hours is spent in school?
Answer:
Total hours in a day = 24 hours
1. Proportion spent in sleeping = \(\frac{8}{24} = \frac{1}{3}\)
2. Proportion spent in school = \(\frac{6}{24} = \frac{1}{4}\)
In simple words: Divide the hours spent on the activity by the total 24 hours in a day and simplify the fraction.
Exam Tip: Always reduce fractions representing proportions to their simplest form.
Q 19 Draw a pie chart for the following data:
Chocolate: 25%, Strawberry: 25%, Vanilla: 50%
Answer:
Calculate central angles for each flavor:
Chocolate: \(25\% \text{ of } 360^\circ = \frac{25}{100} \times 360^\circ = 90^\circ\)
Strawberry: \(25\% \text{ of } 360^\circ = \frac{25}{100} \times 360^\circ = 90^\circ\)
Vanilla: \(50\% \text{ of } 360^\circ = \frac{50}{100} \times 360^\circ = 180^\circ\)
In simple words: Convert each percentage into degrees out of \(360^\circ\) and draw the sectors in a circle.
Exam Tip: The sum of all central angles must equal \(360^\circ\) (\(90^\circ + 90^\circ + 180^\circ = 360^\circ\)).
Q 20 List the outcomes of tossing two coins together.
Answer: When two coins are tossed together, the possible outcomes are:
{ (Head, Head), (Head, Tail), (Tail, Head), (Tail, Tail) } or { HH, HT, TH, TT }
In simple words: There are 4 possible combinations when tossing two coins.
Exam Tip: Write all outcomes inside curly braces as a proper set.
Q 21 A card is drawn at random from a pack of 52 cards. Find the probability that the card drawn is a black king.
Answer: Total number of cards in a deck = 52
Number of black kings in a deck = 2 (King of Spades and King of Clubs)
Probability of drawing a black king = \(\frac{2}{52} = \frac{1}{26}\)
In simple words: There are 2 black kings out of 52 cards, which simplifies to \(\frac{1}{26}\).
Exam Tip: Remember that black suits are Spades and Clubs, each containing 1 king.
Q 22 The marks scored by 20 students in a test are given below:
54, 42, 68, 56, 62, 71, 78, 51, 72, 53, 44, 58, 47, 64, 41, 57, 89, 53, 84, 57
(i) Complete the following frequency table.
| Marks as class intervals | Tally marks | Frequency (no. of students) |
|---|---|---|
| 40 - 50 | HH I | 6 |
| 50 - 60 | HH HH | 8 |
| 60 - 70 | III | 3 |
| 70 - 80 | III | 3 |
| 80 - 90 | II | 2 |
(ii) In which class interval the greatest frequency occurs?
Answer: The greatest frequency (8) occurs in the class interval 50 - 60.
In simple words: Count the numbers falling in each interval to fill the table and find the highest frequency.
Exam Tip: Ensure upper limits are counted in the next interval (e.g., 50 goes into 50-60, not 40-50).
Q 23 When a die is thrown, list the outcomes of an event of getting
(i) a prime number.
(ii) a number greater than 5.
(iii) a composite number.
Answer: Sample space when a die is thrown = {1, 2, 3, 4, 5, 6}
(i) Prime numbers: {2, 3, 5}
(ii) Number greater than 5: {6}
(iii) Composite numbers: {4, 6} (Note: 1 is neither prime nor composite)
In simple words: Select the numbers from 1 to 6 that satisfy each given condition.
Exam Tip: Remember that 1 is neither prime nor composite.
Q 24 A bag contains 3 red and 2 blue marbles. A marble is drawn at random. What is the probability of drawing a blue marble?
Answer: Number of red marbles = 3
Number of blue marbles = 2
Total number of marbles = \(3 + 2 = 5\)
Probability of drawing a blue marble = \(\frac{2}{5}\)
In simple words: Divide the number of blue marbles by the total number of marbles.
Exam Tip: State the total number of items clearly before writing the probability fraction.
Q 25 Draw a histogram for the following data:
Class Interval: 10-15, 15-20, 20-25, 25-30, 30-35, 35-40, 40-45, 45-50, 50-55, 55-60
Frequency: 30, 20, 10, 90, 50, 10, 30, 10, 10, 40
Answer:
To draw the histogram:
1. Represent class intervals along the horizontal axis (X-axis).
2. Represent frequencies along the vertical axis (Y-axis).
3. Draw adjacent rectangular bars of equal width with heights proportional to their respective frequencies (e.g., bar for 25-30 has height 90, bar for 30-35 has height 50).
In simple words: Make adjacent vertical bars where width represents the class interval and height represents the frequency.
Exam Tip: Since class intervals are continuous, there should be no gaps between the bars.
Q 26 The following pie chart gives the expenditure (in percentage) on various items and savings of a family during a month.
(1) On which item the expenditure is minimum?
(2) Expenditure on which item is equal to the total savings of the family?
(3) If the monthly savings is Rs 4500, what is the monthly expenditure on clothes?
Answer:
From the pie chart percentages:
- Food: 25%
- Others: 20%
- Education per children: 15%
- Savings: 15%
- Home Rent: 10%
- Clothes: 10%
- Transport: 5%
(1) Minimum expenditure is on Transport (5%).
(2) Expenditure on Education and Savings are both 15%, so Education expenditure is equal to total savings.
(3) Savings = 15% = Rs 4500
1% = \(\frac{4500}{15} = \text{Rs } 300\)
Expenditure on clothes = 10% = \(10 \times 300 = \text{Rs } 3000\)
In simple words: Read the lowest percentage for minimum, find equal values for the second part, and use unitary method to find the amount for clothes.
Exam Tip: Show the step-by-step unitary method calculation clearly for percentage problems.
Q 27 One card is drawn from a pack of 52 cards... Find the probability that the card drawn is
(i) an ace.
(ii) a face card.
(iii) red.
(iv) 2 of spades.
Answer: Total number of cards = 52
(i) Number of aces = 4
Probability of getting an ace = \(\frac{4}{52} = \frac{1}{13}\)
(ii) Number of face cards (Jacks, Queens, Kings) = 12
Probability of getting a face card = \(\frac{12}{52} = \frac{3}{13}\)
(iii) Number of red cards = 26
Probability of getting a red card = \(\frac{26}{52} = \frac{1}{2}\)
(iv) Number of 2 of spades = 1
Probability of getting 2 of spades = \(\frac{1}{52}\)
In simple words: Divide the number of favorable cards by the total 52 cards for each case and simplify.
Q 28 The number of apples collected from 50 trees is recorded below:
35, 67, 24, 111, 78, 45, 38, 52, 15, 25, 73, 84, 65, 18, 82, 63, 78, 142, 23, 69, 32, 56, 12, 15, 55, 98, 71, 12, 9, 62, 6, 138, 102, 123, 46, 89, 110, 128, 48, 19, 53, 85, 70, 112, 148, 133, 63, 80, 98, 96.
Make a group frequency table and represent the data by using a histogram.
Answer:
Let us choose class intervals of width 30 (e.g., 0-30, 30-60, 60-90, 90-120, 120-150):
| Class Interval | Tally Marks | Frequency |
|---|---|---|
| 0 - 30 | HH HH I | 11 |
| 30 - 60 | HH HH II | 12 |
| 60 - 90 | HH HH HH I | 16 |
| 90 - 120 | HH II | 7 |
| 120 - 150 | HH II | 4 |
| Total | - | 50 |
To represent on a histogram, plot class intervals on the X-axis and frequencies on the Y-axis, drawing adjacent rectangular bars for each interval.
In simple words: Group the numbers into ranges of equal size, count them using tally marks, and draw adjacent bars to represent the frequencies.
Exam Tip: Double-check that the sum of all frequencies matches the total number of observations (50).
Q 29 When a die is thrown, list the outcomes of an event of getting a
(a) composite number.
(b) non-composite number.
(c) number greater than 4.
(d) number not greater than 3.
Answer: Sample space = {1, 2, 3, 4, 5, 6}
(a) Composite numbers: {4, 6}
(b) Non-composite numbers: {1, 2, 3, 5}
(c) Number greater than 4: {5, 6}
(d) Number not greater than 3: {1, 2, 3}
In simple words: List the numbers from a die that match each description.
Exam Tip: Remember that 1 is neither prime nor composite, so it falls under non-composite.
Q 30 Numbers 1 to 20 are written on twenty separate slips... What is the probability of getting
(i) number 7?
(ii) a number less than 15?
(iii) a number greater than 8?
(iv) a 2-digit number?
Answer: Total number of slips = 20 (Numbers 1 to 20)
(i) Favorable outcome = {7} (1 outcome)
Probability = \(\frac{1}{20}\)
(ii) Favorable outcomes = {1, 2, 3, ..., 14} (14 outcomes)
Probability = \(\frac{14}{20} = \frac{7}{10}\)
(iii) Favorable outcomes = {9, 10, 11, ..., 20} (12 outcomes)
Probability = \(\frac{12}{20} = \frac{3}{5}\)
(iv) Favorable outcomes = {10, 11, 12, ..., 20} (11 outcomes)
Probability = \(\frac{11}{20}\)
In simple words: Count how many numbers from 1 to 20 fit each condition and divide by 20.
Exam Tip: Be careful with inclusive and exclusive limits (e.g., "less than 15" means up to 14).
Q 31 Numbers 1 to 10 are written on ten separate slips... What is the probability of
(i) getting a number 6?
(ii) getting a number less than 7?
(iii) getting a number greater than 8?
(iv) getting a one-digit number?
(v) getting a two-digit number?
Answer: Total number of slips = 10 (Numbers 1 to 10)
(i) Probability of getting 6 = \(\frac{1}{10}\)
(ii) Numbers less than 7 = {1, 2, 3, 4, 5, 6} (6 outcomes)
Probability = \(\frac{6}{10} = \frac{3}{5}\)
(iii) Numbers greater than 8 = {9, 10} (2 outcomes)
Probability = \(\frac{2}{10} = \frac{1}{5}\)
(iv) One-digit numbers = {1, 2, 3, 4, 5, 6, 7, 8, 9} (9 outcomes)
Probability = \(\frac{9}{10}\)
(v) Two-digit number = {10} (1 outcome)
Probability = \(\frac{1}{10}\)
In simple words: Identify the matching slips for each question out of the 10 total slips and simplify fractions.
Free study material for Mathematics
Download Class 8 Mathematics Chapter 05 Data Handling Practice Worksheets
Practice Exercises for Class 8 Mathematics Chapter 05 Data Handling
Review targeted practice exercises for Class 8 Mathematics Chapter 05 Data Handling. Curated to match official CBSE guidelines, these printable problem sets support daily revision and improve overall test readiness.
Step-by-Step Solutions and Practice Guidelines
Designed around the official curriculum for Class 8 Mathematics, these practice sheets guarantee standard compliance. Reviewing step-by-step solutions after completion sharpens your accuracy and clarifies complex sub-topics within Chapter 05 Data Handling.
Enhance Speed with Online Practice
Wrap up your chapter revision by testing your knowledge against standard objective question formats. Explore our full library of free, up-to-date printable assignments to maximize your academic results in upcoming CBSE evaluations.
FAQs
You can download the latest chapter-wise printable worksheets for Class 8 Mathematics Chapter 05 Data Handling for free from StudiesToday.com. These have been made as per the latest CBSE curriculum for this academic year.
Yes, Class 8 Mathematics worksheets for Chapter 05 Data Handling focus on activity-based learning and also competency-style questions. This helps students to apply theoretical knowledge to practical scenarios.
Yes, we have provided solved worksheets for Class 8 Mathematics Chapter 05 Data Handling to help students verify their answers instantly.
Yes, our Class 8 Mathematics test sheets are mobile-friendly PDFs and can be printed by teachers for classroom.
For Chapter 05 Data Handling, regular practice with our worksheets will improve question-handling speed and help students understand all technical terms and diagrams.