

Official Class 8 Mathematics Worksheets: Chapter 15 Introduction to Graphs
Explore structured practice materials through the CBSE Class 8 Mathematics Introduction To Graphs Worksheet Set 01. Tailored for Class 8 learners, utilizing these Mathematics worksheets ensures thorough preparation and strengthens problem-solving accuracy before final school evaluations.
Solved Practice Worksheets for Mathematics
Navigate directly to the solved Mathematics worksheets using the digital viewer below. Each practice set includes detailed step-by-step solutions, allowing students to instantly cross-check their work and identify areas requiring further revision.
CBSE Class 8 Introduction to Graphs Worksheet (1)
Question. Which axis will be intersected by the extended line segment joining the points A(2, 3) and B(2, 5).
Answer : x–axis
Question. Two points C(3, 3) and D(5, 3) are joined and the line segment so obtained is extended in both the directions. Find the co-ordinates of the point of intersection this intended line segment and y-axis.
Answer : (0, 3)
Read the following graph carefully in which runs scored by three batsman A, B and C are shown. Answer the questions that follow (1 – 6)
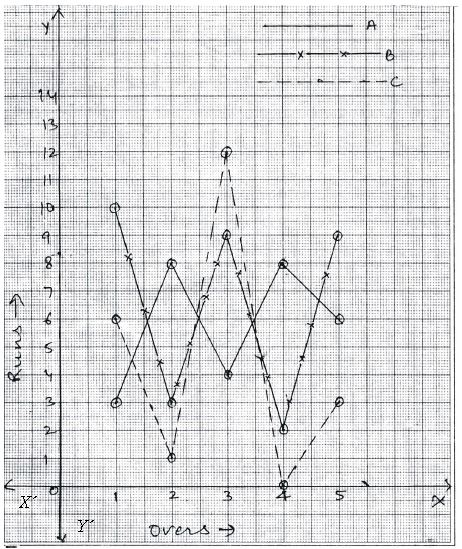
Question. Name the batsman who scored 9 runs twice in his allotted 5 overs.
Answer : B
Question. Which of the three batsman could not score even a single run in any of the 5 overs?
Answer : C
Question. Whose performance was most steady?
Answer : A
Question. What is the total score of batsman A after 5 overs?
Answer : 29
Question. Which batsman scored highest runs in an over?
Answer : C
Question. Which batsman scored thrice the score more than 8?
Answer : B
The following bar graph shows comparative sale of different vegetables of a store for two days. Study it and answer the questions that follows (22–26) :
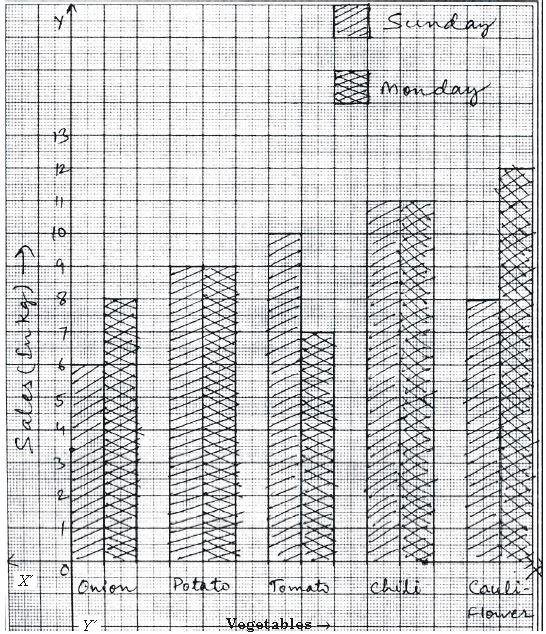
Question. Which vegetables experienced same amount of sale on both days?
Answer : Potato and chili
Question. Which vegetable experienced biggest decrease in consecutive days?
Answer : Tomato
Question. For which vegetable the increase is highest and what is the percent increase for this vegetable?
Answer : Cauliflower, 50%
Question. What is the lowest total sell in kg for any of the vegetables?
Answer : 14 kg for Onion
Question. In terms of total sells of both days, which is the most demanded vegetable?
Answer : Chili
Study the following graph and answer the following questions (38–42) :

Question. Which year experienced better overall rainfall for these five days?
Answer : (2007)
Question. On how many days the rainfall was same?
Answer : Two
Question. Name the only date on which 2008 got more rainfall?
Answer : 5 July
Question. On which date the difference between the rainfall of the two years was biggest?
Answer : 8 July
Question. If the average rainfall for a day is 4 ml, then in 2008 how many dates were there on which the rainfall was more than average?
Answer : Three
INTRODUCTION TO GRAPH
Exercise 15.1
Question 1. Find the coordinates of the points P, Q, R, S, T, L and M from the following graph.
Answer: To find the coordinates of each point, read its perpendicular distance from the y-axis (x-coordinate or abscissa) and from the x-axis (y-coordinate or ordinate).
P = \((-4, 2)\)
Q = \((3, 4)\)
R = \((6, 0)\)
S = \((5, -3)\)
T = \((-2, -5)\)
L = \((-5, 0)\)
M = \((0, -3)\)
In simple words: The coordinates are written as (x, y) by looking at the horizontal position first and then the vertical position.
Exam Tip: Always write the x-coordinate (horizontal axis value) first, followed by the y-coordinate (vertical axis value) in parentheses.
Question 2. Plot the following points on graph and name the quadrant/axis.
(i) \(A(-3, 7)\)
(ii) \(B(-2, -5)\)
(iii) \(C(3, -4)\)
(iv) \(D(-9, 0)\)
(v) \(E(-7, -7)\)
(vi) \(F(6, -3)\)
(vii) \(G(0, -3)\)
(viii) \(H(4, 0)\)
(ix) \(I(-4, 3)\)
(x) \(J(6, 5)\)
Answer: (i) \(A(-3, 7)\): 2nd Quadrant (Negative x, Positive y)
(ii) \(B(-2, -5)\): 3rd Quadrant (Negative x, Negative y)
(iii) \(C(3, -4)\): 4th Quadrant (Positive x, Negative y)
(iv) \(D(-9, 0)\): Negative x-axis
(v) \(E(-7, -7)\): 3rd Quadrant (Negative x, Negative y)
(vi) \(F(6, -3)\): 4th Quadrant (Positive x, Negative y)
(vii) \(G(0, -3)\): Negative y-axis
(viii) \(H(4, 0)\): Positive x-axis
(ix) \(I(-4, 3)\): 2nd Quadrant (Negative x, Positive y)
(x) \(J(6, 5)\): 1st Quadrant (Positive x, Positive y)
In simple words: The signs of the x and y coordinates tell us exactly which quadrant the point falls into.
Exam Tip: If one of the coordinates is zero, the point lies on an axis, not in any quadrant.
Question 3. Without plotting on the graph, name the quadrant/axis of the following coordinates.
(i) \(Q(-3, -10)\)
(ii) \(L(7, -5)\)
(iii) \(R(3, 0)\)
(iv) \(S(4, 2)\)
(v) \(T(-8, 4)\)
(vi) \(Z(0, -11)\)
Answer: (i) \(Q(-3, -10)\): Both coordinates are negative, so it lies in the 3rd Quadrant.
(ii) \(L(7, -5)\): x is positive and y is negative, so it lies in the 4th Quadrant.
(iii) \(R(3, 0)\): y-coordinate is 0, so it lies on the x-axis.
(iv) \(S(4, 2)\): Both coordinates are positive, so it lies in the 1st Quadrant.
(v) \(T(-8, 4)\): x is negative and y is positive, so it lies in the 2nd Quadrant.
(vi) \(Z(0, -11)\): x-coordinate is 0, so it lies on the y-axis.
In simple words: Check the positive or negative signs of x and y to find the quadrant instantly.
Exam Tip: (+, +) is 1st quadrant, (-, +) is 2nd, (-, -) is 3rd, and (+, -) is 4th.
Question 4. Find the coordinates of the following points from the given graph. Also, name the quadrant in which they lie.
Answer: Based on standard reference from coordinate geometry graphs:
Points reading from standard grid layout -
Point P = \((-3, 2)\), 2nd Quadrant
Point Q = \((2, 4)\), 1st Quadrant
Point R = \((5, -2)\), 4th Quadrant
Point S = \((-4, -4)\), 3rd Quadrant
In simple words: Follow the grid lines to read horizontal and vertical distances from the origin.
Exam Tip: Always double check your counting from the axes lines (0,0).
Question 5. Using the following data of the temperature at 12 o'clock during a certain week. Plot the graph between temperature versus day.
Day: Mon, Tue, Wed, Thu, Fri, Sat, Sun
Temp. (in C): 35 C, 34 C, 37 C, 39 C, 42 C, 36 C, 40 C
Answer: To plot this line graph, take Days along the horizontal x-axis and Temperature (in C) along the vertical y-axis. Mark the points (Mon, 35), (Tue, 34), (Wed, 37), (Thu, 39), (Fri, 42), (Sat, 36), (Sun, 40) on the graph paper and join them consecutively with line segments.
In simple words: Connect the temperature dots day by day to see how the weather changes over the week.
Exam Tip: Choose an appropriate scale on the y-axis (e.g., 1 unit = 2 C or 5 C) so that all data points fit neatly.
Question 6. Draw the graph between side of a cube and volume of a cube. Is it a linear graph?
Side in cm: 2, 3, 4, 5
Vol in cm3: 8, 27, 64, 125
Answer: Volume of a cube = \((\text{side})^3\).
For side = 2 cm, Volume = \(2^3 = 8 \text{ cm}^3\)
For side = 3 cm, Volume = \(3^3 = 27 \text{ cm}^3\)
For side = 4 cm, Volume = \(4^3 = 64 \text{ cm}^3\)
For side = 5 cm, Volume = \(5^3 = 125 \text{ cm}^3\)
Plotting these points on a graph gives a curved line, not a straight line.
Answer: No, it is not a linear graph.
In simple words: Because volume increases cubically rather than steadily in a straight line, the resulting graph curves upwards.
Exam Tip: Linear graphs always form a straight line and follow a constant rate of change.
Question 7. Plot the graph of 7 and its multiples. Is it a linear graph?
Answer: Multiples of 7 are: \(7 \times 1 = 7\), \(7 \times 2 = 14\), \(7 \times 3 = 21\), \(7 \times 4 = 28\), etc.
Let n be the multiplier and M be the multiple. Points to plot: \((1, 7), (2, 14), (3, 21), (4, 28)\).
Joining these points gives a straight line passing through the origin.
Answer: Yes, it is a linear graph.
In simple words: Since multiples increase by a constant amount every time, they form a straight line graph.
Question 1. The growth of a plant was recorded as a graph shown below. Read it carefully and find:
(i) At the end of which week(s) was the plant no more than 12 cm?
(ii) Between which two weeks was there the greatest increase in height?
(iii) How much did the plant grow from 3rd week to 4th week?
Answer: (i) Looking at the height values on the y-axis, the plant's height is 12 cm or less at the end of the 1st week, 2nd week, and 3rd week.
(ii) The steepest slope on the graph occurs between the 2nd week and 3rd week, showing the greatest increase in height.
(iii) Height at 3rd week = 12 cm, Height at 4th week = 15 cm.
Growth = \(15 - 12 = 3 \text{ cm}\).
In simple words: Read values directly from the axes of the growth chart to answer each part.
Exam Tip: Steeper lines on a time-distance or growth graph indicate faster rates of change.
Question 2. A distance-time table of a moving car is given below.
Time: 10:20 a.m., 10:30 a.m., 10:40 a.m., 10:50 a.m., 11:00 a.m., 11:10 a.m., 11:20 a.m.
Distance (in km): 0, 5, 12, 22, 26, 28, 38
(i) Using graph paper, plot the graph of distance versus time.
(ii) When was the car travelling at the greatest speed?
(iii) What is the speed between 10:40 to 10:50 a.m.?
(iv) What is the average speed of the car?
[Hint: Average speed = Total distance travelled / total time taken.]
Answer: (i) Plot Time on the x-axis and Distance on the y-axis and connect consecutive points with line segments.
(ii) The car travels the greatest distance in a 10-minute interval between 11:10 a.m. and 11:20 a.m. (distance increases from 28 km to 38 km, which is 10 km in 10 minutes).
(iii) Distance at 10:40 a.m. = 12 km, Distance at 10:50 a.m. = 22 km.
Distance covered = \(22 - 12 = 10 \text{ km}\) in 10 minutes (\(\frac{1}{6} \text{ hour}\)).
Speed = \(\frac{10 \text{ km}}{\frac{1}{6} \text{ hr}} = 60 \text{ km/h}\).
(iv) Total distance = 38 km, Total time = 60 minutes = 1 hour.
Average speed = \(\frac{38 \text{ km}}{1 \text{ hr}} = 38 \text{ km/h}\).
In simple words: Speed is calculated as distance divided by time.
Exam Tip: Always convert time units correctly when calculating speed in km/h.
Question 3. Read the following distance-time graph of a car and find:
(i) Distance travelled from C to E.
(ii) Speed of the car between 20 - 40 seconds.
(iii) When is the speed of the car zero?
Answer: (i) Read the vertical distance corresponding to points C and E on the graph and find their difference.
(ii) Speed = \(\frac{\text{Distance at 40s} - \text{Distance at 20s}}{40 - 20}\).
(iii) The speed is zero when the distance-time graph is a horizontal flat line (parallel to the x-axis), meaning no distance is being covered over time.
In simple words: A flat horizontal line on a distance-time graph means the object is stationary.
Exam Tip: Slope of a distance-time graph represents speed.
I. Multiple Choice Questions.
Question 1. The x-coordinate of an ordered pair is called:
(i) ordinate
(ii) abscissa
(iii) intercept
(iv) origin
Answer: (ii) abscissa
The x-coordinate is termed the abscissa, while the y-coordinate is the ordinate.
In simple words: Abscissa is the official mathematical name for the x-coordinate.
Exam Tip: Alphabetical order helps: Abscissa (x) comes before Ordinate (y).
Question 2. A linear function is denoted by:
(i) \(x = y + 2\)
(ii) \(2 = b - a\)
(iii) \(a = cx + yb\)
(iv) \(y = mx + c\)
Answer: (iv) \(y = mx + c\)
The standard equation of a linear function representing a straight line is \(y = mx + c\).
In simple words: This is the standard slope-intercept form of a straight line equation.
Exam Tip: Remember \(y = mx + c\) where m is slope and c is y-intercept.
Question 3. The coordinate P(3, 0) lies on:
(i) origin
(ii) x-axis
(iii) y-axis
(iv) none of the options
Answer: (ii) x-axis
Since the y-coordinate is 0, the point lies directly on the horizontal x-axis.
In simple words: Any point with a zero y-coordinate sits on the x-axis.
Exam Tip: Points on the x-axis have the form \((x, 0)\).
Question 4. The coordinate (-2, 3) lies in:
(i) 1st quadrant
(ii) 3rd quadrant
(iii) 2nd quadrant
(iv) 4th quadrant
Answer: (iii) 2nd quadrant
A negative x-coordinate and positive y-coordinate \((-, +)\) fall in the 2nd quadrant.
In simple words: Moving left then up puts you in the second quadrant.
Exam Tip: Quadrants are numbered counter-clockwise starting from the top-right.
Question 5. The Cartesian plane has:
(i) 2 quadrants
(ii) 3 quadrants
(iii) 4 quadrants
(iv) 5 quadrants
Answer: (iii) 4 quadrants
The two perpendicular axes divide the plane into 4 regions called quadrants.
In simple words: The coordinate plane is split into four quarters (quadrants).
Exam Tip: 'Quad' means four.
II. Fill in the blanks.
Question 6. The signs of a coordinate in 2nd quadrant are __________.
Answer: (-, +)
In simple words: x is negative and y is positive in the second quadrant.
Exam Tip: Memorize quadrant sign rules: I(+,+), II(-,+), III(-,-), IV(+,-).
Question 7. The ordered pair of origin 'O' is written as __________.
Answer: (0, 0)
In simple words: The center point where axes cross is zero on both axes.
Question 8. The coordinate T(-3, -5) lies in __________ quadrant.
Answer: 3rd
In simple words: Both negative signs indicate the third quadrant.
Exam Tip: Both coordinates negative means quadrant 3.
Question 9. The horizontal axis of a Cartesian plane is called __________.
Answer: x-axis
In simple words: The flat sleeping line is the x-axis.
Exam Tip: Horizontal = x-axis, Vertical = y-axis.
Question 10. The coordinate L(0, -7) lies in/on __________.
Answer: y-axis (negative y-axis)
In simple words: Zero x-coordinate means it lies directly on the y-axis.
Exam Tip: Any point of form \((0, y)\) is on the y-axis.
III. Tick for 'True' and (X) for 'False'.
Question 11. The origin of the axes system lies in 1st quadrant.
Answer: False
The origin \((0, 0)\) is the intersection point of the axes and does not belong to any quadrant.
In simple words: The origin is right in the middle, not inside any single quadrant.
Exam Tip: Origin separates all four quadrants.
Question 12. The linear graphs are represented as lines.
Answer: True
Linear graphs form unbroken straight lines.
In simple words: Linear means straight line.
Exam Tip: 'Line' is right inside the word 'linear'.
Question 13. The quadrants of the Cartesian plane are named in clockwise direction.
Answer: False
Quadrants are named in counter-clockwise (anticlockwise) order starting from top-right.
In simple words: They go counter-clockwise: I, II, III, IV.
Exam Tip: Always count quadrants counter-clockwise.
Question 14. The vertical axis of the Cartesian plane is denoted as YOY'.
Answer: True
The vertical line is labeled YOY' with positive y upwards and negative y' downwards.
In simple words: YOY' is the standard label for the vertical axis.
Exam Tip: XOX' is horizontal and YOY' is vertical.
Question 15. In P(x, y), y is the abscissa.
Answer: False
In the ordered pair \(P(x, y)\), x is the abscissa and y is the ordinate.
In simple words: y is called the ordinate, not the abscissa.
Exam Tip: Remember x = abscissa, y = ordinate.
Free study material for Mathematics
CBSE Class 8 Mathematics Worksheets for Chapter 15 Introduction to Graphs
Practice Exercises for Class 8 Mathematics Chapter 15 Introduction to Graphs
Access structured practice worksheets for Chapter 15 Introduction to Graphs aligned with the 2026 CBSE curriculum. These downloadable exercises for Class 8 Mathematics help students build accuracy and reinforce core concepts for upcoming school tests.
Step-by-Step Solutions and Practice Guidelines
Designed around the official curriculum for Class 8 Mathematics, these practice sheets guarantee standard compliance. Reviewing step-by-step solutions after completion sharpens your accuracy and clarifies complex sub-topics within Chapter 15 Introduction to Graphs.
Enhance Speed with Online Practice
Wrap up your chapter revision by testing your knowledge against standard objective question formats. Explore our full library of free, up-to-date printable assignments to maximize your academic results in upcoming CBSE evaluations.
FAQs
You can download the latest chapter-wise printable worksheets for Class 8 Mathematics Chapter 15 Introduction to Graphs for free from StudiesToday.com. These have been made as per the latest CBSE curriculum for this academic year.
Yes, Class 8 Mathematics worksheets for Chapter 15 Introduction to Graphs focus on activity-based learning and also competency-style questions. This helps students to apply theoretical knowledge to practical scenarios.
Yes, we have provided solved worksheets for Class 8 Mathematics Chapter 15 Introduction to Graphs to help students verify their answers instantly.
Yes, our Class 8 Mathematics test sheets are mobile-friendly PDFs and can be printed by teachers for classroom.
For Chapter 15 Introduction to Graphs, regular practice with our worksheets will improve question-handling speed and help students understand all technical terms and diagrams.