
Read and download the CBSE Class 8 Mathematics Introduction To Graphs Worksheet Set 02 in PDF format. We have provided exhaustive and printable Class 8 Mathematics worksheets for Chapter 15 Introduction to Graphs, designed by expert teachers. These resources align with the 2026-27 syllabus and examination patterns issued by NCERT, CBSE, and KVS, helping students master all important chapter topics.
Chapter-wise Worksheet for Class 8 Mathematics Chapter 15 Introduction to Graphs
Students of Class 8 should use this Mathematics practice paper to check their understanding of Chapter 15 Introduction to Graphs as it includes essential problems and detailed solutions. Regular self-testing with these will help you achieve higher marks in your school tests and final examinations.
Class 8 Mathematics Chapter 15 Introduction to Graphs Worksheet with Answers
1 Which of the following statements is true?
(A) The X-a xis is a vertical line.
(B) TheY-a xi s is a horizontal line .
(C) The scale on both the axes must be the same in a Cartesian plane .
(D) The point of intersection between the X-a xis andY-axis is called the origin .
Answer : D
2 Which of t h e points given is a poi nt on the X-axis?
(A) (5, 0)
(B) (0, 5)
(C) (5, 3)
(D) (3, 5)
Answer : A
(3-7): The bar-graph provided gives the sales of books (in thousand numbers) by six branches of a publishing company during two consecutive years 2013 and 2014.
Sales of books (in thousand numbers) in different branches
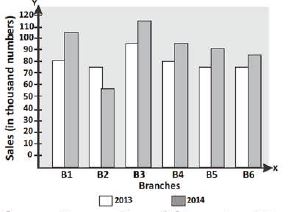
Answer the questions 5-9 based on this bar-graph.
3 What is the tota l sa l es of branc hes B1, B3 and B5 together for both the yea r s (i n thousand numbers) ?
(A) 250
(B) 310
(C) 435
(D) 565
Answer : D
4 What percent of the total sales of branch B3 for both the years is the total sales of branch B6 for both the years ?
(A) 68 .5 4%
(B) 71.11 %
(C) 76.19%
(D) 75 .55%
Answer : C
5 What is the average sale of all the branches (in thousand numbers) for the year 2013?
(A) 73
(B) 81
(C) 83
(D) 88
Answer : B
6 What is the ratio of the total sales of branch B2 for both yea rs to the total sales of branch B4 for both the years?
(A) 2: 3
(B) 3 : 5
(C) 4 : 5
(D) 13: 18
Answer : D
7 What percent of the average sa les of branches B1, B and B3 in 2014 is the average sales of branches B1, B3 and B6 in 20 13?
(A) 7 5%
(B) 77.5 %
(C) 91%
(D) 87.5%
Answer : C
(8-12): The following pie charts show the distribution of students of graduate and post-graduate levels in seven different institutes M, N, P, Q, R, S and T in a town.
Distribution of students at graduate and post-graduate levels in seven institutes M, N, P, Q, R, S, and T.
Total number of students of graduate level = 27300
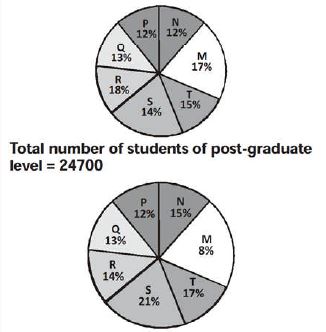
Note : Pie charts are not drawn to scale.
8 How many students of institutes M and S are studying at graduate level ?
(A) 75 16
(B) 8463
(C) 9127
(D) 9409
Answer : B
9 What is the total number of students studying at post-graduate level from institutes Nand P?
(A) 5601
(B) 5944
(C) 6669
(D) 7004
Answer : C
10 What is the total number of graduate and post-graduate level students in the instituteR ?
(A) 8320
(B) 7916
(C) 91 16
(D) 8372
Answer : D
11 What is the ratio of the number of students studying at post-graduate and graduate levels respectively in institute S ?
(A) 14 : 19
(B) 19 : 14
(C) 17 : 21
(D) 19: 21
Answer : B
12 What is the ratio of the number of students at post-graduate level in institute S and the number of students studying at graduate level in institute Q?
(A) 13:19
(B) 21:13
(C) 13:8
(D) 19:13
Answer : D
13 The bar chart shows the number of workers employed by a trading company in three years
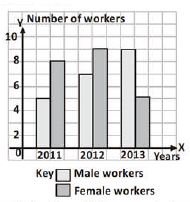
Calculate the difference between the total number of male and female workers employed over those three years.
(A) 1
(B) 2
(C) 4
(D) 6
Answer : A
14 The line graph shows the sale of dolls by Suhas from Monday to Saturday in a particular week.
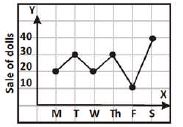
Given that the cost of one doll is~ 35, how much did Suhas receive from the sale of dolls on Saturday ?
(A) ₹ 200
(B) ₹ 700
(C) ₹ 1050
(D) ₹ 1400
Answer : D
15 The bar chart shows the number of 'Maruti' and 'Benz' cars sold by three dealers, A, B and C.
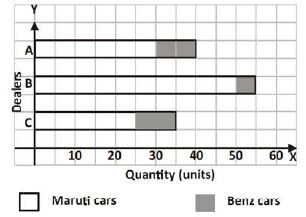
Which of the following statements is true?
(A) Dealer A sold 40 Maruti cars less than dealer B.
(B) Dealer B sold 50 Maruti cars more than dealer C.
(C) Dealer B sold the most number of Benz cars.
(D) The total number of Benz cars by dealers B and C is 15.
Answer : C
16 The line graph shows the price of chicken in towns M and N.
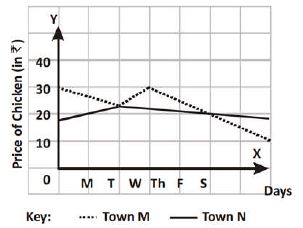
On which days are the price of chicken the same in both the towns ?
(A) Tuesday and Friday only
(B) Friday only
(C) Wednesday and Friday only
(D) Tuesday only
Answer : A
17 The line graph shows the sale of watches in a company.
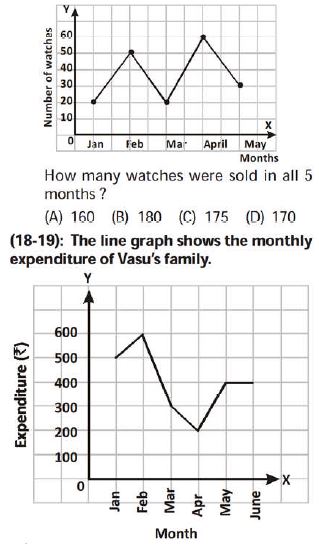
18 What is the total expenditure over the first 3 months ?
(A) ₹ 1400
(B) ₹ 600
(C) ₹ 1100
(D) ₹ 1320
Answer 17: B
Answer 18: A
19 Find the difference between their highest and lowest monthly expenditures.
(A) ₹ 100
(B) ₹ 400
(C) ₹ 300
(D) ₹ 200
Answer : B
20 Which of the following statements is correct?
(A) The coordinates of the origin are (0, 1).
(B) The point (5, 0) lies on theY-axis.
(C) The point (0, 7) lies on theY-axis.
(D) The point (3, 2) lies on the X-axis.
Answer : C
21 The line graph shows the number of road accidents over the first four months of a certain year.
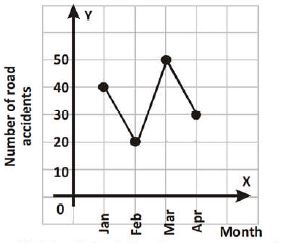
Which of the following statements is false?
(A) The number of accidents is the highest in March.
(B) The number of accidents fell by 50% in February compared to the number in January.
(C) The total number of accidents over the four months is 140.
(D) The number of accidents increased by 3 times in March as compared to the number in February.
Answer : D
(22-23): The graph given shows the simple interest given on deposits in a bank.
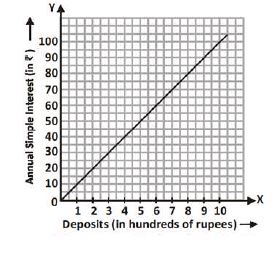
22 Find the amount to be deposited to earn an interest of '{ 45.
(A) ₹ 250
(B) ₹ 450
(C) ₹ 400
(C) ₹ 550
Answer : B
23 How much interest is paid on a deposit of ₹ 750?
(A) ₹ 7 5
(B) ₹ 65
(C) ₹ 70
(D) ₹ 80
Answer : A
(24-28): 1200 students wer e asked to choose a game for their CCA. The pie chart given represents their choices.
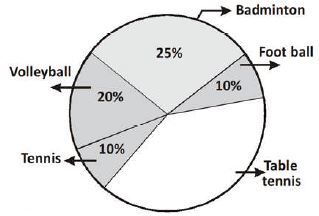
24 What percentage of the pupils chose table tennis ?
(A) 30%
(B) 40%
(C) 35%
(D) 45%
Answer : C
25 How many more pupils chose table tennis than foot ball?
(A) 120
(B) 30
(C) 250
(D) 300
Answer : D
26 The table-tennis group and the volley ball group should have the same number of pupils. How many pupils should be transferred from the table tennis group to the volleyball group?
(A) 50
(B) 27
(C) 90
(D) 11 2
Answer : C
27 What is the ratio of the number of pupils who chose tennis and table tennis to the number of pupils who chose the other games?
(A) 7 : 13
(B) 9 : 11
(C) 11 : 9
(D) 9 : 13
Answer : B
28 Which of the following is correct ?
| Game | No. of pupils | |
| (A) | Badm inton | 300 |
| (B) | Volley ball | 300 |
| (C) | Tennis | 240 |
| (D) | Soccer | 360 |
Answer : A
(29-33): The histogram shows the petrol consumption per week of a number of cars in a city.
29 What is the total number of cars ?
(A) 70
(B) 68
(C) 74
(D) 76
Answer : C
30 What is the frequency of the modal class?
(A) 16
(B) 14
(C) 4
(D) 10
Answer : A
31 How many cars consume less than 40.5 l of petrol per week ?
(A) 4
(B) 14
(C) 10
(D) 6
Answer : B
32 How many cars consume more than 50.5 l of petrol ?
(A) 28
(B) 14
(C) 16
(D) 30
Answer : D
33 How many litres of petrol do 1 0 cars consume?
(A) 45.5 - 50.5
(B) 30.5 - 35.5
(C) 40.5 - 45.5
(D) 35.5 - 40.5
Answer : D
(34-36): The line graph given shows the rate of the production of toys in a factory.
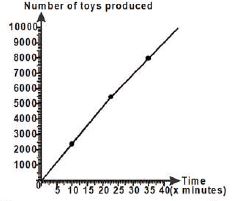
34 How many toys were produced in 10 minutes?
(A) 2100
(B) 2300
(C) 2200
(D) 2000
Answer : B
35 Find the time taken to produce 5400 toys.
(A) 35 minutes
(B) 30 minutes
(C) 23.5 minutes
(D) 20 minutes
Answer : C
36 Find the expected time to complete producing 8000 toys if the production starts at 3.45 p.m .
(A) 3 :50 p.m
(B) 4 : 20 p.m
(C) 4 : 15p.m
(D) 4 :35p.m
Answer : B
(37-38): The line graph shows the earning of a daily wage employee in a small firm.

37 By how much did his income fa ll on Wednesday from that on Monday ?
(A) ₹ 20
(B) ₹ 15
(C) ₹ 10
(D) ₹ 40
Answer : A
38 Between which two days was the increase in the income of the person the same as that between Monday and Tuesday?
(A) Wednesday and Thursday
(B) Wednesday and Friday
(C) Tuesday and Wednesday
(D) Fr iday and Saturday
Answer : A
Please refer to the link below for CBSE Class 8 Mathematics Worksheet - Introduction to Graphs
Free study material for Mathematics
CBSE Mathematics Class 8 Chapter 15 Introduction to Graphs Worksheet
Students can use the practice questions and answers provided above for Chapter 15 Introduction to Graphs to prepare for their upcoming school tests. This resource is designed by expert teachers as per the latest 2026 syllabus released by CBSE for Class 8. We suggest that Class 8 students solve these questions daily for a strong foundation in Mathematics.
Chapter 15 Introduction to Graphs Solutions & NCERT Alignment
Our expert teachers have referred to the latest NCERT book for Class 8 Mathematics to create these exercises. After solving the questions you should compare your answers with our detailed solutions as they have been designed by expert teachers. You will understand the correct way to write answers for the CBSE exams. You can also see above MCQ questions for Mathematics to cover every important topic in the chapter.
Class 8 Exam Preparation Strategy
Regular practice of this Class 8 Mathematics study material helps you to be familiar with the most regularly asked exam topics. If you find any topic in Chapter 15 Introduction to Graphs difficult then you can refer to our NCERT solutions for Class 8 Mathematics. All revision sheets and printable assignments on studiestoday.com are free and updated to help students get better scores in their school examinations.
FAQs
You can download the latest chapter-wise printable worksheets for Class 8 Mathematics Chapter 15 Introduction to Graphs for free from StudiesToday.com. These have been made as per the latest CBSE curriculum for this academic year.
Yes, Class 8 Mathematics worksheets for Chapter 15 Introduction to Graphs focus on activity-based learning and also competency-style questions. This helps students to apply theoretical knowledge to practical scenarios.
Yes, we have provided solved worksheets for Class 8 Mathematics Chapter 15 Introduction to Graphs to help students verify their answers instantly.
Yes, our Class 8 Mathematics test sheets are mobile-friendly PDFs and can be printed by teachers for classroom.
For Chapter 15 Introduction to Graphs, regular practice with our worksheets will improve question-handling speed and help students understand all technical terms and diagrams.