
Read and download the CBSE Class 5 Mathematics Data Handling Worksheet in PDF format. We have provided exhaustive and printable Class 5 Mathematics worksheets for Data Handling, designed by expert teachers. These resources align with the 2026-27 syllabus and examination patterns issued by NCERT, CBSE, and KVS, helping students master all important chapter topics.
Chapter-wise Worksheet for Class 5 Mathematics Data Handling
Students of Class 5 should use this Mathematics practice paper to check their understanding of Data Handling as it includes essential problems and detailed solutions. Regular self-testing with these will help you achieve higher marks in your school tests and final examinations.
Class 5 Mathematics Data Handling Worksheet with Answers
Directions (Qs. 1 to 5): Answer the following questions based on the following pictograph.
1. To make the pictograph 1000 children were asked about their hobbies. The children who told about their hobby, has been shown in the above pictograph. But some children did not reply. Which one of the following is the correct pictorial representation for the children who did not reply?
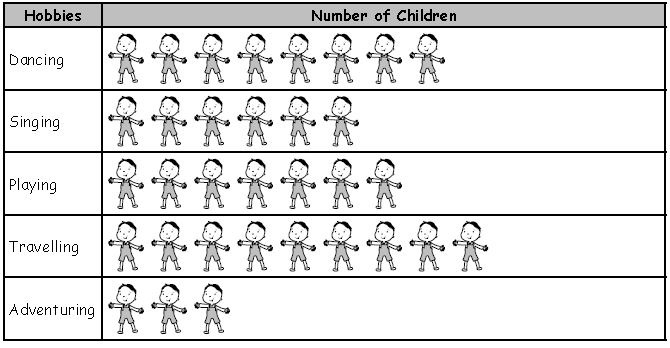
Answer : D
2. How many children are there whose hobby is adventuring?
(a) 200 children
(b) 175 children
(c) 100 children
(d) 75 children
Answer : D
3. Which one of the following hobbies is liked by least number of children?
(a) Dancing
(b) Adventuring
(c) Singing
(d) Playing
Answer : B
4. Find the number of children whose hobby is either travelling or adventuring?
(a) 300
(b) 200
(c) 100
(d) 50
Answer : A
5. Jack: Playing is the most favourite hobby among the children.
Codi: Not playing, it is travelling which is the most favourite hobby among the childrens.
Who is correct?
(a) Jack
(b) Codi
(c) Both are correct
(d) Both are incorrect
Answer : B
6. The marks obtained in 4 subjects in an examination are 200. If the average of marks obtained in 3 subjects is 48, then how many marks are obtained in fourth subject?
(a) 50
(b) 144
(c) 152
(d) 56
Answer : D
7. From the following table tell the S.No. of the area from which the minimum numbers of pedestrians passed :
| S. No. | Area | Female | Male |
| 1 | From Ghadi Chowk to Jai Stambh | 132 | 318 |
| 2 | From Ghadi Chowk to Railway station | 14 | 286 |
| 3 | From Ghadi Chowk to Shankar Nagar | 15 | 185 |
| 4 | From Ghadi Chowk to Kali Badi | 22 | 128 |
(a) 3
(b) 1
(c) 2
(d) 4
Answer : D
8. In a village the number of members in 20 family are as follows : (2010)
6, 8, 6, 3, 2, 5, 7, 8, 6, 5, 5, 7, 7, 8, 6, 6, 7, 7, 6, 4.
The frequency of families having 6 members are :
(a) 7
(b) 5
(c) 6
(d) 4
Answer :C
Directions (Qs. 9 to 15) : The number of dolls produced by a factory in different years has been shown in the following pictograph.
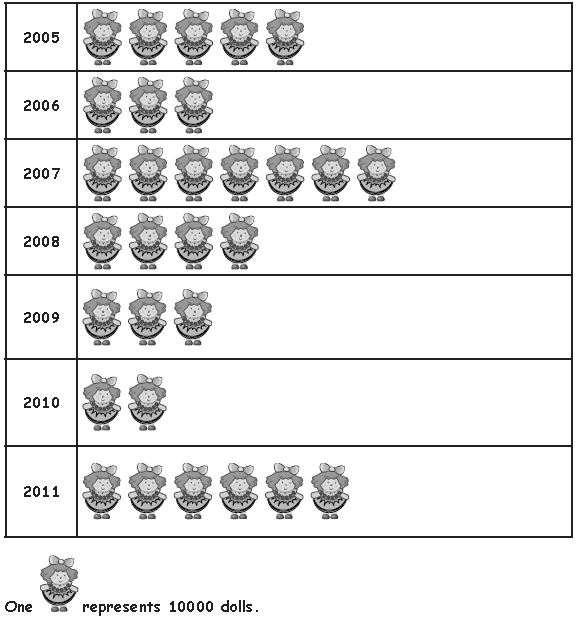
Read the above given pictograph and answer the following questions.
9. In which year did the factory produce maximum number of dolls?
(a) 2007
(b) 2011
(c) 2005
(d) 2009
Answer : A
10. How many dolls were produced in 2008?
(a) 50,000
(b) 40,000
(c) 30,000
(d) 10,000
Answer : B
11. In which years did the factory produce equal number of dolls?
(a) 2005 and 2006
(b) 2007 and 2011
(c) 2006 and 2009
(d) 2008 and 2009
Answer : C
12. Find the total number of dolls which the factory produced during 2005 to 2010.
(a) 2,60,000
(b) 2,80,000
(c) 2,40,000
(d) 2,00,000
Answer : C
13. How many more dolls were produced in 2007 than 2006?
(a) 20,000
(b) 30,000
(c) 40,000
(d) 10,000
Answer : C
14. By how much, production of the dolls increased in 2011 in comparison to previous year.
(a) 20,000
(b) 30,000
(c) 10,000
(d) 40,000
Answer : D
15. In which year 60,000 dolls were produced?
(a) 2011
(b) 2007
(c) 2005
(d) 2008
Answer : A
Directions (Qs. 16 to 18) : Read the given bar graph and answer the following questions:
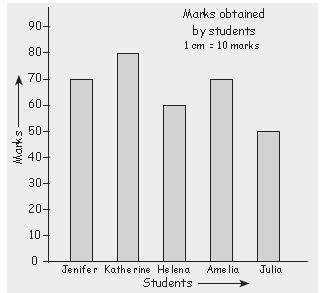
16. Name the student who got the highest mark.
(a) Katherine
(b) Jenifer
(c) Amelia
(d) Julia
Answer : A
17. Find the marks obtained by Amelia.
(a) 60 (b) 80
(c) 70
(d) 50
Answer : C
18. What scale has been chosen in the bar graph.
(a) 1 cm = 10 marks
(b) 2 cm = 10 marks
(c) 10 cm = 20 marks
(d) 10 cm = 1 mark
Answer : A
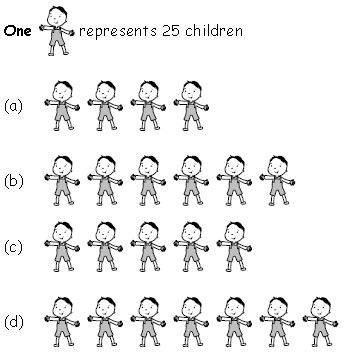
19. If. ↑ represents 5 houses, then the number of houses represented by ↑ ↑ ↑ ↑ are:
(a) 4
(b) 20
(c) 5
(d) 40
Answer : B
20. A symbol is used to represent 10 flowers. Number of symbols to be drawn to show 60 flowers is:
(a) 6
(b) 12
(c) 10
(d) 10
Answer : A
21. A graph drawn using pictures is called:
(a) pictograph
(b) circle graph
(c) column graph
(d) line graph
Answer : A
22. A graph drawn using vertical bars is called:
(a) bar graph
(b) line graph
(c) pictograph
(d) pie graph
Answer : A
23. A pictorial representation of data is called __________.
(a) attractive graph
(b) pictograph
(c) bar graph
(d) pie diagram
Answer : B
24. The pictograph shows the distances of towns W, X and Y from town Z.
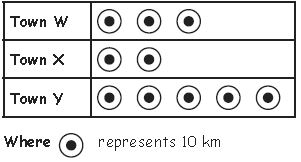
Which of the following road maps shows the correct positions of towns W, X, Y and Z?
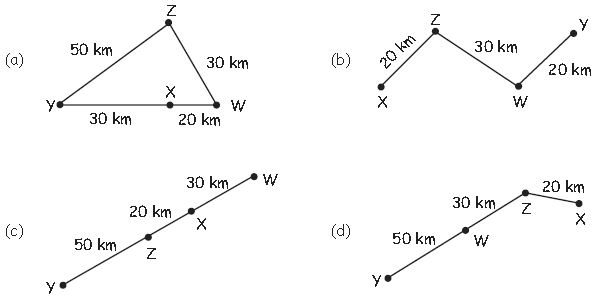
Answer : B
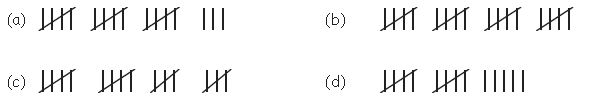
25. Which of the following represents 18?
Answer : A
26. The pictograph shows the number of eggs sold by a trader in three days.
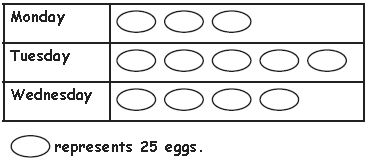
If the trader still had 115 eggs left after the three days, calculate the number of eggs he had at first.
(a) 185
(b) 300
(c) 215
(d) 415
Answer : D
27. The bar graph shows the grades obtained by a group of pupils in a test.
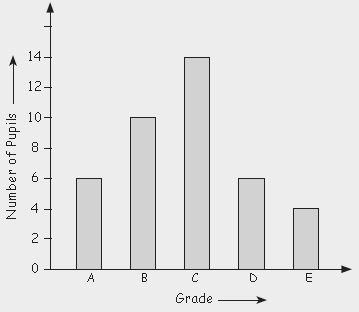
If grade C is the passing mark, how many pupils passed the test?
(a) 10
(b) 14
(c) 24
(d) 30
Answer : D
Directions (Qs. 28 to 32) : Read the following graph and answer the questions given below:
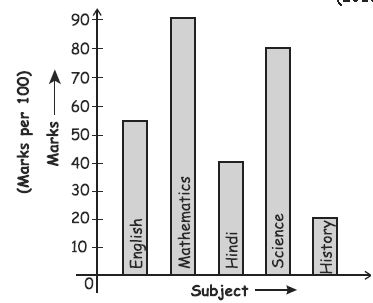
28. At what subject is the student sharp ?
(a) English
(b) Mathematics
(c) Science
(d) History
Answer : B
29. In which subject the student gets the least marks ?
(a) English
(b) Mathematics
(c) Science
(d) History
Answer : D
30. What are the average marks obtained by the student ?
(a) 57
(b) 63
(c) 80
(d) 48
Answer : A
31. What is the percentage obtained by the student?
(a) 80%
(b) 63%
(c) 57%
(d) 90%
Answer : C
32. What is the ratio of the highest marks to the lowest marks obtained by the student?
(a) 2 : 11
(b) 9 : 2
(c) 2 : 9
(d) 11 : 2
Answer : B
33. The mode of a set of observations is the value which
(a) occurs most frequently
(b) is central
(c) is between maximum and minimum
(d) none of the foregoing
Answer : A
34. The difference between the maximum and the minimum observations in the data is
(a) class interval
(b) frequency
(c) cumulative frequency
(d) range
Answer : D
35. The number of times a particular item occurs in a class interval is called its
(a) mean
(b) frequency
(c) cumulative frequency
(d) none of these
Answer : B
36. The statistical data are of two types. These types are
(a) technical data and presentation data
(b) primary data and secondary data
(c) primary data and personal data
(d) none of the above
Answer : B
37. Following are the percentages of marks of 10 students of a class:
50, 60, 70, 72, 74, 75, 80, 88, 75, 100
Frequency of students in the class (60 – 68) will be:
(a) 5
(b) 1
(c) 6
(d) 3
Answer : B
38. The mode of the following data:
| Size | 1 | 3 | 5 | 7 | 9 |
| Frequency | 6 | 9 | 12 | 3 | 15 |
is
(a) 9
(b) 7
(c) 5
(d) 3
Answer : A
39. A photographer came to take the pictures of a student. There was a choice of five different picture packages. The given chart shows how the number of wallet-sized pictures increases from package to package. If the increase is the same from one package to the next, how many wallet-sized pictures should be in package C?
| Package A | 8 wallet-sized pictures |
| Package B | 16 wallet-sized pictures |
| Package C | ? |
| Package D | 32 wallet-sized pictures |
| Package E | 40 wallet-sized pictures |
(a) 18
(b) 20
(c) 22
(d) 24
Answer : D
40. The given table shows that for Science class, Mr. Satish is ordering kits that contain caterpillars. Based on the data in the table, what will be the total number of caterpillars in 8 kits?
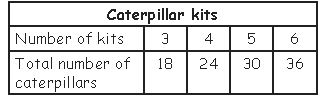
(a) 48
(b) 38
(c) 40
(d) 42
Answer : A
41. Riya asked the students in her class if they have any pets. Her results are shownbelow.
• 4 students have cats.
• 8 students have fish.
• 5 students have parrots.
• 12 students have dogs.
• No student has a frog.
(a) Cats are better pets than Fishes
(b) Fishes are better pets than Dogs
(c) Frogs are the most popular pet
(d) Frogs are the least popular pet
Answer : D
42. Megha has holidays on every second and fourth Saturday of a month. On which dates she has holidays in January 2013?
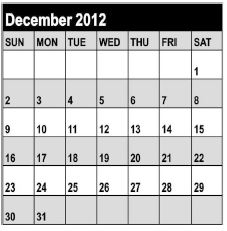
(a) 1st and 15th
(b) 8th and 29th
(c) 1st and 22nd
(d) 12th and 26th
Answer : D
43. The given graph shows the number of children who visited an old age home in 5 days. Study the graph carefully and answer the given questions.
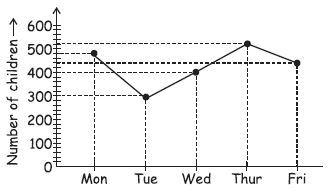
On which two consecutive days was there a difference of 80 in the number of children who visited the old age home?
(a) Monday, Tuesday
(b) Tuesday, Wednesday
(c) Wednesday, Thursday
(d) Thursday, Friday
Answer : D
44. If one is added to the second digit of each number in given set of numbers, then which number will be lowest?
489 441 454 473 483
(a) 441
(b) 489
(c) 454
(d) 473
Answer : A
45. The given bar graph shows the weight of old newpapers collected by 2 classes over 5 days. What is the difference between the total weight collected by class 5A and class 5B?
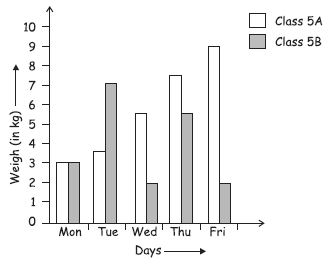
(a) 20 kg
(b) 16 kg
(c) 24 kg
(d) 9 kg
Answer : D
46. There is a connection between the numbers in the first row and those in the second row. Find the missing number.
First row : 15 21 34 12 19
Second row : 105 147 238 84 ?
(a) 133
(b) 143
(c) 193
(d) 173
Answer : A
47. Study the graph carefully.
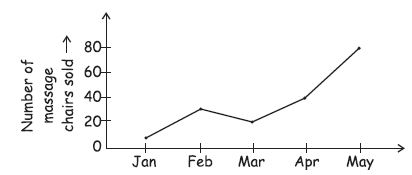
If the salesman earned ₹ 150 from the sale of each massage chair, how much did he earn in May?
(a) ₹ 6000
(b) ₹ 9000
(c) ₹ 12000
(d) ₹ 15000
Answer : C
48. The table below shows a baby’s weight on the first day of each month from April to August.
| Date | Weight (in kg) |
| 1st April | 3.6 |
| 1st May | 5.0 |
| 1st June | 6.0 |
| 1st July | 6.7 |
| 1st August | 7.2 |
In which month did the baby’s weight increases the most?
(a) April
(b) May
(c) June
(d) July
Answer : B
49. The given graph shows the number of toy cars some children have.
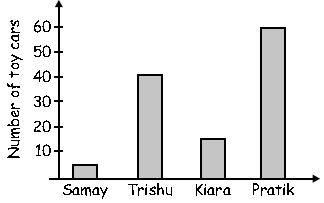
________ has thrice as many toy cars as the total number of toy cars Samay and Kiara have.
(a) Trishu
(b) Kiara
(c) Pratik
(d) Samay
Answer : C
50. The given bar graph shows the number of people like different types of fruits.'
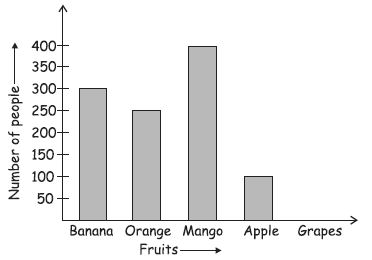
Study the graph and answer the question that follows If number of poeple like grapes is double to the number of people like apple, then find the total number of people in the survey.
(a) 1450
(b) 1500
(c) 1400
(d) 1350
Answer : C
Students must free download and practice these worksheets to gain more marks in exams. CBSE Class 5 Maths Revision Worksheets - Data Handling
Free study material for Mathematics
CBSE Mathematics Class 5 Data Handling Worksheet
Students can use the practice questions and answers provided above for Data Handling to prepare for their upcoming school tests. This resource is designed by expert teachers as per the latest 2026 syllabus released by CBSE for Class 5. We suggest that Class 5 students solve these questions daily for a strong foundation in Mathematics.
Data Handling Solutions & NCERT Alignment
Our expert teachers have referred to the latest NCERT book for Class 5 Mathematics to create these exercises. After solving the questions you should compare your answers with our detailed solutions as they have been designed by expert teachers. You will understand the correct way to write answers for the CBSE exams. You can also see above MCQ questions for Mathematics to cover every important topic in the chapter.
Class 5 Exam Preparation Strategy
Regular practice of this Class 5 Mathematics study material helps you to be familiar with the most regularly asked exam topics. If you find any topic in Data Handling difficult then you can refer to our NCERT solutions for Class 5 Mathematics. All revision sheets and printable assignments on studiestoday.com are free and updated to help students get better scores in their school examinations.
FAQs
You can download the latest chapter-wise printable worksheets for Class 5 Mathematics Data Handling for free from StudiesToday.com. These have been made as per the latest CBSE curriculum for this academic year.
Yes, Class 5 Mathematics worksheets for Data Handling focus on activity-based learning and also competency-style questions. This helps students to apply theoretical knowledge to practical scenarios.
Yes, we have provided solved worksheets for Class 5 Mathematics Data Handling to help students verify their answers instantly.
Yes, our Class 5 Mathematics test sheets are mobile-friendly PDFs and can be printed by teachers for classroom.
For Data Handling, regular practice with our worksheets will improve question-handling speed and help students understand all technical terms and diagrams.