

Official Class 5 Mathematics Worksheets: Math-Magic Chapter 12 Smart Charts
Review targeted academic worksheets with the CBSE Class 5 Mathematics Smart Charts Worksheet Set 02. Built according to official educational standards for the 2026-27 term, these downloadable Class 5 Mathematics resources support effective daily practice and detailed self-evaluation for Math-Magic Chapter 12 Smart Charts.
Solved Practice Worksheets for Mathematics
Navigate directly to the solved Mathematics worksheets using the digital viewer below. Each practice set includes detailed step-by-step solutions, allowing students to instantly cross-check their work and identify areas requiring further revision.
Question 1. In a class of 100 students data of fruits liked was collected as follows. Represent this using chapatti chart / pie chart.
Pine apple - 20
orange - 15
Banana - 40
Apple - 25
Answer: To represent the data in a pie chart (chapatti chart), we calculate the angle for each fruit out of a total of \(360^\circ\) (since total students = 100):
Pineapple: \(\frac{20}{100} \times 360^\circ = 72^\circ\)
Orange: \(\frac{15}{100} \times 360^\circ = 54^\circ\)
Banana: \(\frac{40}{100} \times 360^\circ = 144^\circ\)
Apple: \(\frac{25}{100} \times 360^\circ = 90^\circ\)
In simple words: A pie chart divides a circle into proportional slices based on the given quantities.
Exam Tip: Always verify that the sum of all percentages equals 100 and the sum of all angles equals 360 degrees.
Question 2. a. Which is the most favourite fruit?
Answer: Banana
In simple words: Banana has the highest number of students (40 out of 100).
Exam Tip: Look for the highest numerical value in the given dataset to find the most popular item.
Question 3. b. Which is least favourite fruit?
Answer: Orange
In simple words: Orange has the lowest number of students (15 out of 100).
Exam Tip: Look for the lowest numerical value in the given dataset to find the least popular item.
Question 4. c. How many students like oranges?
Answer: 15 students
In simple words: Reading directly from the data given for oranges, we get 15.
Question 5. d. The difference between the number of students that like oranges and bananas is
Answer: 25
Number of students who like bananas = 40
Number of students who like oranges = 15
Difference = \(40 - 15 = 25\)
In simple words: Subtract the smaller quantity from the larger quantity to find the difference.
Exam Tip: The word 'difference' always indicates subtraction between the two values.
Look at the pie chart showing different sports liked by people
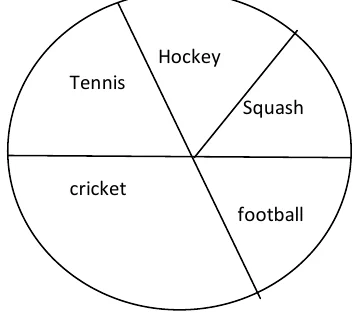
Question 6. (a) Which is the most popular sport
Answer: Cricket
In simple words: Cricket occupies the largest section in the given pie chart.
Exam Tip: In visual charts, the largest area or sector represents the highest frequency.
Question 7. (b) Which is the least popular sport
Answer: Squash
In simple words: Squash occupies the smallest section in the given pie chart (about 51 degrees, less than Hockey).
Exam Tip: The smallest sector in a pie chart corresponds to the least popular category.
Question 8. (c) Do more children enjoy Hockey or tennis?
Answer: Tennis
In simple words: The sector size for tennis is noticeably larger than the sector for hockey.
Exam Tip: Compare the visual sizes of the two sectors when exact numbers are not provided.
Question 9. (d) Arrange the sports liked by children in increasing order.
Answer: Squash, Hockey, Football, Tennis, Cricket
In simple words: Squash (smallest), then Hockey, Football, Tennis, and Cricket (largest).
Exam Tip: Increasing order means starting from the smallest value/size to the largest.
Corrected answers for (b) and (d): (b) Squash. (d) Squash, Hockey, Football, Tennis, Cricket.
Free study material for Mathematics
Download Class 5 Mathematics Math-Magic Chapter 12 Smart Charts Practice Worksheets
Download Chapter Worksheets: Class 5 Mathematics
Access structured practice worksheets for Math-Magic Chapter 12 Smart Charts aligned with the 2026 CBSE curriculum. These downloadable exercises for Class 5 Mathematics help students build accuracy and reinforce core concepts for upcoming school tests.
Concept Clarification for Math-Magic Chapter 12 Smart Charts
Each worksheet draws directly from authorized standard textbooks to maintain academic accuracy. Evaluating your finished exercises against expert-verified solutions helps master the formal presentation standards expected in school evaluations.
Effective Revision Strategies for School Exams
Wrap up your chapter revision by testing your knowledge against standard objective question formats. Explore our full library of free, up-to-date printable assignments to maximize your academic results in upcoming CBSE evaluations.
FAQs
You can download the latest chapter-wise printable worksheets for Class 5 Mathematics Math-Magic Chapter 12 Smart Charts for free from StudiesToday.com. These have been made as per the latest CBSE curriculum for this academic year.
Yes, Class 5 Mathematics worksheets for Math-Magic Chapter 12 Smart Charts focus on activity-based learning and also competency-style questions. This helps students to apply theoretical knowledge to practical scenarios.
Yes, we have provided solved worksheets for Class 5 Mathematics Math-Magic Chapter 12 Smart Charts to help students verify their answers instantly.
Yes, our Class 5 Mathematics test sheets are mobile-friendly PDFs and can be printed by teachers for classroom.
For Math-Magic Chapter 12 Smart Charts, regular practice with our worksheets will improve question-handling speed and help students understand all technical terms and diagrams.