
Read and download the CBSE Class 12 Economics Determination of Income and Employment Assignment Set 01 for the 2026-27 academic session. We have provided comprehensive Class 12 Economics school assignments that have important solved questions and answers for Part B Macroeconomics Chapter 4 Determination Of Income And Employment. These resources have been carefuly prepared by expert teachers as per the latest NCERT, CBSE, and KVS syllabus guidelines.
Solved Assignment for Class 12 Economics Part B Macroeconomics Chapter 4 Determination Of Income And Employment
Practicing these Class 12 Economics problems daily is must to improve your conceptual understanding and score better marks in school examinations. These printable assignments are a perfect assessment tool for Part B Macroeconomics Chapter 4 Determination Of Income And Employment, covering both basic and advanced level questions to help you get more marks in exams.
Part B Macroeconomics Chapter 4 Determination Of Income And Employment Class 12 Solved Questions and Answers
POINTS TO REMEMBER
❑ Aggregate demand refers to total demand for goods and services in the economy. AD represents the total expenditure on goods and services in an economy.
❑ Main components of Aggregate demand are :
(i) Household consumption expenditure (C).
(ii) Investment expenditure (I).
(iii) Govt. consumption expenditure (G).
(iv) Net export (X – M).
In two sector economy AD = C + I.
❑ Aggregate supply is the total supply of goods and services in the economy.
It is also the value of total output available is an economy during a given period of time.
AS = C + S
❑ Aggregate supply represents the national income of the country.
AS = Y (National Income)
❑ Consumption function shows functional relationship between consumption and Income.
C = F(Y)
where C = Consumption
Y = National Income
F = Functional relationship.
❑ Consumption function (propensity to consume) is of two types.
(a) Average propensity to consume (APC)
(b) Marginal propensity to consume (MPC)
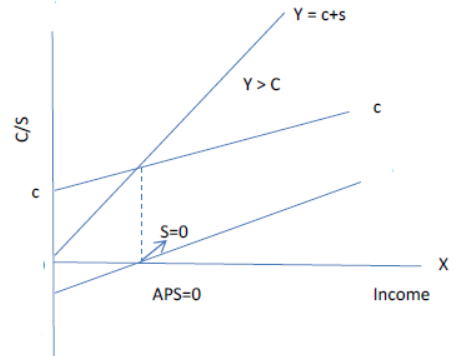
❑ Average propensity to Consume (APC) : Average propensity to consume refers to the ratio of consumption expenditure to the corresponding level of income.
APC = Consumption(C)/Income(Y)
Important Points about APC
(i) APC is more than 1 : as long as consumption is more than national income before the break-even point, APC > 1.
(ii) APC = 1, at the break-even point, consumption is equal to national income.
(iii) APC is less than 1 : beyond the break-even point. Consumption is less than national income.
(iv) APC falls with increase in income.
(v) APC can never be zero : because even at zero level of national income, there is autonomous consumption.
❑ Marginal Propensity to Consume (MPC) : Marginal propensity to consume refers to the ratio of change in consumption expenditure to change in total income.
MPC = Change in consumption ΔC/Change in Income ΔY
Important Points about MPC
(1) Value of MPC varies between O and 1 : If the entire additional income is consumed, then ΔC = DY, making MPC = 1. However, if entire additional income is saved, then ΔC = 0, making MPC = 0
❑ Saving function refers to the functional relationship between saving and national income.
S = f (y)
where S = saving
Y = National Income
F = Functional relationship.
❑ Saving function (Propensity to Save) is of two types.
(i) Average Propensity to Save (APS)
(ii) Marginal propensity to Save (MPS)
❑ Average Propensity to Save (APS) : Average propensity to save refers to the ratio of savings to the corresponding level of income.
APS = Savings(S)/Income(Y)
❑ Important Point about APS
(1) APS can never be 1 or more than 1 : As saving can never be equal to or more than income.
(2) APS can be zero : At break even point C = Y, hence S = 0
(3) APS can be negative or less than 1 : At income levels which are lower than the break-even point, APS can be negative as there will be dissavings in the economy.
(4) APS rises with increase in income.
❑ Marginal Propensity to Save (MPS) : Marginal propensity to save refers to the ratio of change in savings to change in total income.
MPS = Change in Savings ΔC/Change in Income Change ΔY
❑ MPS varies between 0 and 1
(i) MPS = 1 if the entire additional income is saved. In such a case, ΔS = ΔY.
(ii) MPS = 0 If the entire additional income is consumed. In such a case, ΔS = 0
❑ Relationship between APC and APS
The sum of APC and APS is equal to one. It can be proved as under we
know :
Y = C + S
Dividing both sides by Y, we get
❑ Investment refers to the expenditure incurred on creation of new capital
assets.
❑ The investment expenditure is classified under two heads :
(i) Induced investment (ii) Autonomous investment.
❑ Induced Investment : Induced investment refers to the investment which depends on the profit expectations and is directly influenced by income level.
❑ Autonomous Investment : Autonomous investment refers to the investment which is not affected by changes in the Level of income and is not induced solely by profit motive.
❑ Marginal Efficiency of Investment (MEI) : MEI refers to the expected rate of return from an additional investment.
❑ Ex-Ante Savings : Ex-ante saving refers to amount of savings which household intended to save at different levels of income in the economy.
❑ Ex-Ante Investment : Ex-ante investments refers to amount of investment which firm plan to invest at different level of income in the economy.
❑ Ex-Post Saving : Ex-post savings refer to the actual or realised savings in an economy during a financial year.
❑ Ex-Post Investment : Ex-post investment refers to the actual or realised investment in an economy during a financial year.
❑ Equilibrium level of income is determined only at the point where AD = AS or S = I. But it cannot always be at full employment level also as it can be at less than full employment.
❑ Full employment is a situation when all those who are able and willing to work at prevailing wage rate, get the opportunity to work.
❑ Voluntary unemployment is a situation where person is able to work but not willing to work at prevailing wage rate.
❑ Involuntary unemployment is a situation where worker is able to willing to work at current wage rate but does not get work.
❑ Under employment is a situation where AD is less than required AS at full employment level.
❑ Investment multiplier (K) is the ratio of increase in income (ΔY) due to change in investment ΔI.
K = ΔY/ΔI
K = 1/1-MPC or K = 1/MPS
❑ Excess demand refers to the situations when aggregate demand is in excess of aggregate supply corresponding to full employment.
❑ Deficient demand refers to a situation when aggregate demand is short of aggregate supply corresponding to full employment.
❑ Inflationary gap is the gap by which actual aggregate demand exceeds the level of aggregate demand required to establish full employment. It measures the amount of excess of aggregate demand.
❑ Deflationary gap is the gap by which actual aggregate demand is less than the level of aggregate demand required to establish full employment. It
measures the amount of deficiency of aggregate demand.
Important Questions for NCERT Class 12 Economics Determination of Income and Employment
Fill in the blanks: (MCQ)
Question. The value of multiplier is: …………….
(a) 1/ MPC
(b) 1/ MPS
(c) 1/ 1-MPS
(d) 1/ MPC-1
Answer. B
Question. --------------- represents the slope of the consumption function.
(a) MPC
(b) MPS
(c) Neither MPC nor MPS
(d) Both MPC &MPS
Answer. A
Question. Desired consumption during an accounting year is called as:
(a) ex-ante consumption
(b) ex-post consumption
(c) Autonomous consumption
(d) None of these.
Answer. A
Question. If the value of investment multiplier increases, it would mean that:
(a) MPS has increased
(b) MPC has increased
(c) MPC has decreased
(d) MPS has decreased.
Answer. B
Question. The value of investment multiplier lies between:
(a) 0 and 1
(b) 0 and infinity
(c) 1 and infinity
(d) None of these
Answer. C
Question. Excess demand in an economy may give birth to:
(a) Deflationary gap
(b) Inflationary gap
(c) Low level of employment
(d) excess capacity.
Answer. B
Question. Saving is a ………………. function of disposable income.
(a) Negative
(b) positive
(c) constant
(d) none of these.
Answer. B
Question. If MPC is 0.5, the value of investment multiplier equals:
(a) 4
(b) 2
(c) 1
(d) 0.2
Answer. B
Assertion and Reason Questions:
Question. Read the following statements
Assertion and Reason and choose the correct option:
Assertion (A): During the deflationary situation public expenditure is to be increased.
Reason(R): Additional public expenditure always leads to additional income in the economy.
a) Both Assertion and Reason are true and Reason is the correct explanation of Assertion.
b) Both Assertion and Reason are true and Reason is not the correct explanation of Assertion.
c) Assertion is true but Reason is false.
d) Assertion is false but Reason is true.
Answer. A
Question. Read the following statements
Assertion and Reason and choose the correct option:
Assertion (A): Average propensity to consume is directly proportional to income.
Reason(R): An increase in income leads to an increase in consumption.
a) Both Assertion and Reason are true and Reason is the correct explanation of Assertion.
b) Both Assertion and Reason are true and Reason is not the correct explanation of Assertion.
c) Assertion is true but Reason is false.
d) Assertion is false but Reason is true.
Answer. A
(CASE BASED QUESTIONS)
Read the following passage carefully and Answer: the given questions:
Changes in aggregate demand bring about changes in the level of output, employment, income, and price. These changes are generally cyclical in nature. These changes, more generally, follow a cycle of four different stages namely boom, recession, depression and recovery. The cyclical nature of economic activity is known as trade cycle or business cycle. Boom is a stage of economic activity characterized by rising prices, rising employment, rising purchasing power. During the boom period economy may get overheated, if it so happens, the monetary authorities, the financial institutions begin to play cautiously. There may be cuts in investment, resulting in cuts in employment; decline in purchasing power, economy may be caught in a web of pessimism, leads to recession. During this stage, if effective corrective measures are not undertaken, the economy may find itself caught in the whirlpool of depression. It is a stage where investment, employment, output touches the bottom. As the economy moves out of depression, it enters the phase of recovery. Keynesian diagnosis of trade cycles is given in terms of changes in aggregate demand. These are ‘excess demand’ and ‘deficient demand ‘that cause trade cycle.
Question. During the time of ‘excess demand’, Govt. should ……………… the public expenditure.
a) Reduce
b) increase
c) unchanged
d) none of these.
Answer: Reduce
Question. Investment depends on:
a) Supply
b) income
c) saving
d) Both (a) and (c)
Answer: Income.
Read the following passage carefully and Answer: the given questions:
There is a big difference between the term disinflation and deflation. When an economy undergoes a deflationary shock, the implication can be both positive and negative for consumers and businesses. Disinflation usually occurs during a period of recession and manifests itself by slowing down the rate at which prices increases.
If the inflation rate drops to a lower level than before, technically that difference is disinflation. Deflation, on the other hand, can be thought as the opposite of inflation or a negative inflation and it occurs when the supply of goods or services rises faster than the supply of money.
Question. …………………. helps to correct the situation of deflationary shock in a country through its credit control policy.
a) Central bank
b) Commercial bank
c) Neither (a) or (b)
d) None of the above.
Answer: Central bank
Question. Which of the following step is to be taken by the central bank to boost demand in the economy during deflationary gap?
a) Increase in public expenditure
b) Reduce the rate of tax
c) Decrease legal reserve requirements
d) Increase in foreign exchange reserve.
Answer:- Decrease legal reserve requirements
Very Short Answer: questions:
Question. What is meant by Ex-Post investment?
Answer: Ex-post investment refers to the actual or realised investment in an economy during a financial year.
Question. What is meant by average propensity to consume?
Answer: Average propensity to consume is the ratios of consumption expenditure to income.
APC = C/Y
Question. Define marginal propensity to consume.
Answer: Marginal propensity to consume is the ratio of change in consumption to change in income.
Question. What is autonomous consumption?
Answer: Autonomous consumption refers to minimum level of consumption, even when income is zero.
Question. What is Ex-ante aggregate demand?
Answer: Estimated demand of goods and service in an economy during a financial year.
Question. Can the value of APC be greater than one?
Answer: Yes, the value of APC > 1 before the break-even point is attained.
Question. Can APC be ever zero?
Answer: APC can never be equal to zero as consumption can never be zero at any level of income.
Question. What is the relationship between APC and APS?
Answer: The sum of APC and APS is equal to one.
APC + APS = 1
Question. If APS is 0.6, how much will be the APC?
Answer: APC = 1 – APS = 1 – 0.6 = 0.4
Question. What is meant by Ex-ante saving?
Answer: Exante-saving refers to amount of saving which household intended to save at different level of income in an economy.
Question. What can be the minimum value of investment multiplier?
Answer: The minimum value of K = 1, when MPC = O
Question. What can be the maximum value of multiplier?
Answer: The maximum value of k = ∞ when MPC = 1
Question. Can average propensity to consume be negative?
Answer: No, because consumption can never be zero even at zero level of income.
Question. What do you mean by investment multiplier?
Answer: Investment multiplier measures the ratio of change in investment and change in income.
Question. What will be the impact of increase in cash reserve ratio on the aggregate demand?
Answer: Aggregate demand will fall.
Question. What is investment?
Answer: Investment is an addition to capital stock. It is also called capital formation.
Question. Why can the value of marginal propensity to consume not be greater than one?
Answer: It is because change in consumption cannot be greater than change in income.
Question. Define Aggregate Demand.
Answer. Aggregate Demand refers to the total planned demand (ex-ante) for final goods and services in an economy during an accounting year.
Question. Define Aggregate Supply.
Answer. Aggregate Supply refers to the total planned availability of final goods and services in an economy during an accounting year.
Question. What are the components of Aggregate Demand?
Answer. 1. Private final consumption expenditure (C)
2. Government final consumption expenditure. (G)
3. Investment expenditure (I)
4. Net Exports (x-m)
AD = C + G + I + (X-M)
Question. Mention two components of Aggregate Supply.
Answer. i) Consumption i) saving
Question. What is consumption function?
Answer. Consumption function refers to the functional relationship between national income and consumption.
Question. What is meant by break-even point?
Answer. Break-even point refers to the point at which consumption is equal to national income. At this point saving is zero.
Question. What are the two kinds of propensity to save?
Answer. i) Average propensity to save (ii) Marginal propensity to save.
Question. Define Marginal propensity to save.
Answer. MPS refers to the ratio of change in saving (ΔS) to change in income (ΔY).
MPS = change in saving / change in income
Question. What is meant by effective demand?
Answer. Effective demand refers to that level of aggregate demand which is equal to aggregate supply.
Question. Define the term ‘investment multiplier.
Answer. Multiplier refers to the ratio of change in income to the change in investment.
Question. What is the relationship between the MPS and Multiplier?
Answer. Multiplier is inversely proportional to MPS, higher the MPS the lower the value of Multiplier.
Question. What is the minimum and maximum value of investment multiplier?
Answer. Minimum value of investment multiplier is one (MPC= Zero) and the maximum value is infinity (MPC= 1).
Question. Define inflationary gap.
Answer. It refers to the gap by which actual aggregate demand exceeds the Aggregate demand required for the full employment equilibrium.
Question. Give the meaning of ‘deficient demand’.
Answer. Deficient demand refers to the situation when aggregate demand is less than aggregate supply corresponding to the full employment level in the economy.
Question. Can Average propensity to consume be ever zero?
Answer. APC can never be equal to zero as consumption can never be zero at any level of income.
HOTS.
Question. What is the impact of deficient demand on production and employment?
Answer: Production and employment will decrease due to shortage of aggregate demand.
Question. Define inflationary gap.
Answer: Inflationary gap refers the situation under which AD is excess than required AS at full employment equilibrium.
Question. Under which situation is consumption function represented by a straight line.
Answer: When marginal propensity to consume remains constant.
Question. What is the impact of continuous increase in income on average propensity to consume?
Answer: APC falls with continuous increase in income.
Question. How much additional income will be generated in an economy with additional investment of Rs. 100 crore, when MPC = 1/2?
Answer: and ΔY = K . ΔI
= 2 x 100
= 200 Crore.
Short Answer: questions (3 & 4 Marks)
Question. Explain the consumption function with the help of schedule and diagram.
Answer.
• Consumption function refers to the functional relationship between national income and consumption.
• It shows the consumption level at different levels of income in an economy.
• It is a psychological concept.
C = ƒ ﴾Y﴿
The relationship between consumption and income can be seen with the help of the following schedule and diagram.
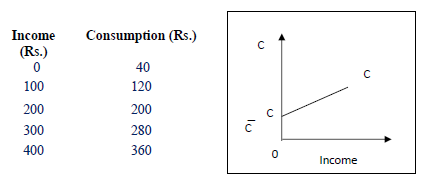
Consumption curve starts from point ‘C’ on OY axis; this indicates that there is ‘Autonomous consumption’ of ‘OC’, even when the national income is zero.
It is an upward sloping curve, but the rise in consumption is less than proportionate rise in income since apart of income is saved.
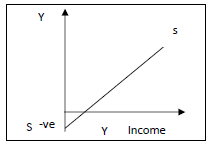
Question. Explain the saving function with the help of schedule and diagram.
Answer.
• Saving function refers to the functional relationship between saving and national income.
• It shows the saving at different levels of income in an economy.
S = ƒ ﴾Y﴿
The relationship between saving and income can be seen with the help of the following schedule and diagram.
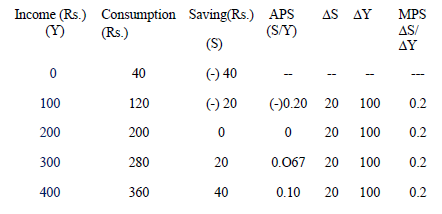
Income (Rs.) Consumption (Rs.) Saving(Rs.)
0 40 (-) 40
100 120 (-) 20
200 200 0
300 280 20
400 360 40
Saving curve starts from point ‘S’ on the OY axis, this indicates that there is negative saving (equal to the amount of ‘Autonomous consumption), when the national income is zero. It is an upward sloping curve, indicates a positive relationship between saving and income.
Question. What are the different components of Aggregate demand? Explain.
Answer.
Major components of AD are: -
1. Private final consumption expenditure (C) It refers to the total final expenditures incurred by households or films on purchase of final goods and services during an accounting year. It depends upon the disposable income. 2. Government final consumption expenditure. (G) It refers to the final expenditures incurred by government on purchase of goods and services to satisfy the needs of an economy. 3. Investment expenditure (I) It refers to the total expenditure increased by all private firms on capital goods. It includes gross domestic fixed capital formation and change in stock. 4. Net Exports (x-m). It is the difference between value of exports of goods and services and values Import of goods and services
Question. Distinguish between Average propensity to save and Marginal propensity to save. Give a numerical example.
Answer. There are TWO types of saving function. They are:
1. Average Propensity to Save (APS): APS refers to the ratio of saving to the corresponding level of national income. APS = Saving / Income (S/Y)
2. Marginal Propensity to Save (MPS): MPS refers to the ratio of change in saving (ΔS) to change in income (ΔY). MPS = Change in saving / change in income (ΔS / ΔY)
Following table shows the numerical illustrations of APS and MPS
Question. Define investment multiplier. Write the relationship between investment multiplier with MPC and MPS.
Answer.
Investment Multiplier refers to a multiple change in income (Δ Y).as a result of a small change in investment (Δ I) .
k = Δ Y/ Δ I
Relation between ‘k’ & MPC
k = 1/ 1-MPC (POSITIVE RELATION)
If MPC value is 0.25, then k= 1/1-0.25, k= 1/ 0.75 k = 1.33
If MPC value is 0.75, then k= 1/1- 0.75, k= 1/ 0.25, k=4
POSITIVE RELATION BETWEEN MPC & k
Relation between ‘k’ & MPS
k= 1/ MPS (NEGATIVE RELATION)
If MPS value is 0.25, then k= 1/0.25, k= 4
If MPS value is 0.75, then k= 1/0.75, k= 1.33.
Question. Explain the working of investment multiplier with the help of a numerical example.
Answer.
• The working of multiplier is based on the fact that ‘One person’s expenditure is another person’s income’.
• When an additional investment is made, then income increases many times more than the increase in investment.
• It depends upon the value of MPC.
The working of investment multiplier can be able to see with the help of the following example.
Increase in investment (Δ I) = 100 crores, MPC= 0.9
k = 1/1- MPC, 1/1-0.9, 1/0.1 = 10
Total increase in income (Δ Y) = k x Δ I, 10 x 100= 1000 crores.
The minimum value of k = 1(one) k = 1 / 1 - MPC
The maximum value of k= Infinity Total increase in income= k X Δ I
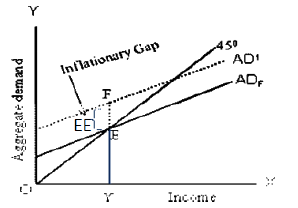
Question. Explain the meaning of excess demand with the help of a diagram.
Answer.
A situation where planned Aggregate Demand is greater than the required Aggregate Supply in an economy, corresponding to the full employment, is known as excess demand.
AD > AS (Corresponding to full employment)
In other words, any excess of planned aggregate expenditure (AD) over the full employment level of expenditure is known as EXCESS DEMAND.
Excess demand leads to inflationary situation in the economy.
There for the excess demand situation is also known as inflationary gap.
Thus inflationary gap represents the situation where the actual AD exceeds the AD required to maintain full employment level.
This situation can be expressed in the form of following diagram.
From the diagram, we can see that economy’s equilibrium level of income is OY, where AD= AS
When AD increases above this equilibrium level ie., AD’ , we can see the situation of excess demand or inflationary gap.
ie., YF – YE = EE
The situation of excess demand is also known as OVER FULLEMPLOYMENT situation. Leads to rise in the general price level.
Question. What are the measures to control excess demand?
Answer.
FISCAL POLICIES
• DECRESE in public expenditure
• INCREASE the tax rate and even impose some new taxes
MONETARY POLICIES
• Increase in Bank Rate
• Increase in Legal Reserve Requirement
• Increase in Repo Rate
• Increase in Reverse Repo Rate.
• Increase in Margin Requirement.
• SELL the securities to the public as an open market operation policy.
(These all will lead to a decrease in the money supply or availability of credit.)
Question. Explain the meaning of deficient demand with the help of a diagram.
Answer. DEFICIENT DEMAND: -
A situation when planned Aggregate Demand is less than the Aggregate Supply corresponding to full employment level of output in the economy.
AD < AS (Corresponding to full employment)
This leads to deficient demand, and is known as DEFLATIONARY GAP situation. Results a fall in general price level.
It leads to underemployment equilibrium and there exists involuntary unemployment in the economy.
This situation can be expressed in the form of following diagram.
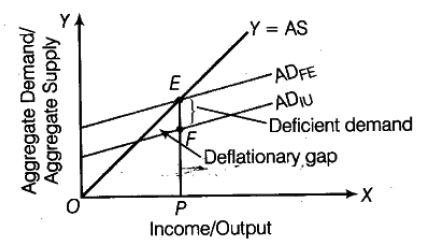
The gap between EF indicates the deflationary gap.
10. Write any four important points related to APC.
• APC is always more than one (APC > 1) before the break-even point
• APC is equal to 1 at the break-even point. (Y=C).
• APC is less than 1 after the break-even point.
• APC falls with increase in income.
• APC can never be zero or Negative.
Question. What are the measures to control deficient demand?
Answer.
FISCAL POLICIES
• INCRESE public expenditure
• DECREASE the tax rate and to withdraw the new taxes which were imposed earlier.
• DECREASE public borrowings.
MONETARY POLICIES
• Decrease in Bank Rate
• Decrease in Legal Reserve Requirement
• Decrease in Repo Rate
• Decrease in Reverse Repo Rate.
• Decrease in Margin Requirement
• PURCHASE the securities from the public as an open market operation policy.
(These all will lead to an increase in money supply or the availability of credit.)
LONG ANSWER: QUESTIONS: (6 Marks)
Question. Outline the steps required to be taken in deriving saving curve from the given consumption curve. Use schedule / diagram.
Answer.
• Consumption function refers to the functional relationship between national income and consumption.
• It shows the consumption level at different levels of income in an economy.
• Saving function refers to the functional relationship between saving and national income.
• It shows the saving at different levels of income in an economy.
Y= C+S
S= Y-C
C= Y-S
The following table shows the derivation of saving from the consumption.
Income (Rs.) Consumption (Rs.) Saving(Rs.)
(Y) (S)
0 40 (-) 40
100 120 (-) 20
200 200 0
300 280 20
400 360 40
At zero level of income there is consumption, known as autonomous consumption. As income increases, consumption also increases.
The following diagram illustrates the derivation of saving curve from the consumption curve.
From the above diagram, we can see that, at ‘OY’ level of income both Income and consumption are equaled, known as ‘break-even point’. At this situation saving is zero.
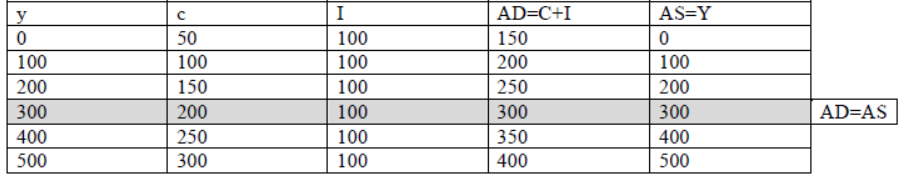
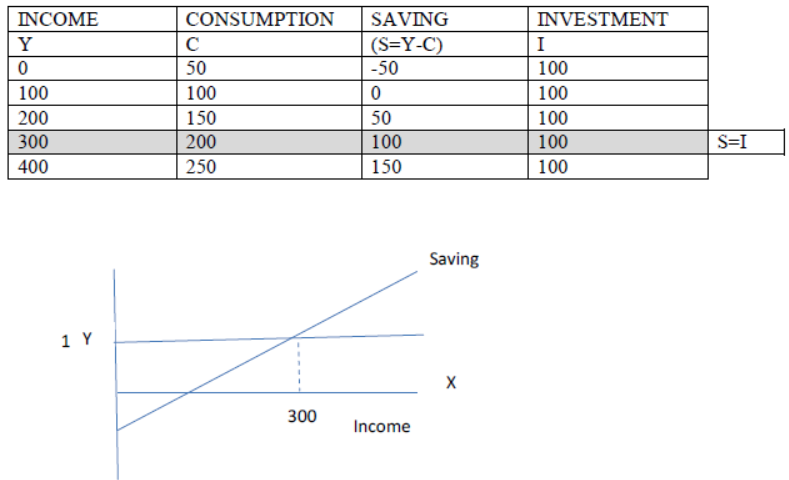
Question. Explain the determination of equilibrium level of income using ‘Investment and saving’ approach. Use diagram. (CBSE 2015, 2018)
OR
Explain with the help of a schedule, how equilibrium level of income is determined considering aggregate demand and aggregate supply.
OR
Explain the Keynesian theory of full employment equilibrium
Answer.
According to the Keynesian theory, an economy reaches equilibrium level, when planned (ex-ante) AD for goods and services is equal to the planned (ex-ante) AS, during an accounting year.
Full employment equilibrium is a situation, where all the resources of the country get employment. It implies that the volume of Aggregate Demand is just sufficient for the full utilization of country’s available resources and the production is being done to the maximum possible resources and to the maximum possible limit. It means aggregate demand is neither in excess nor deficient.
AD represents consumption and investment and AS represents consumption and saving.
Hence the equilibrium level is achieved, when;
AD= AS
AD= C+I
AS= C+S
So, when an economy reaches equilibrium;
C+I= C+S
I= S
The determination of equilibrium level of income can be better understood with the help of the following schedule.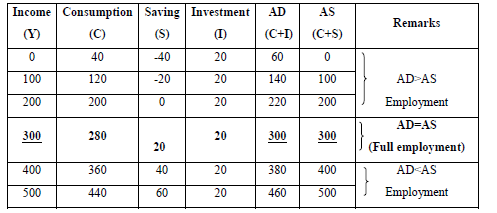
From the table we can see that, when income is at Rs. 300, both ex- ante AD and ex- ante AS reaches equilibrium. (AD= AS, 300=300), there for 300is known as equilibrium income. At the same situation, both ex- ante Saving and ex- ante Investment also reaches equilibrium. (S=I, 20=20). There for we can say that Rs. 300 as equilibrium level of income. This situation is also known as EFFECTIVE DEMAND situation.
The following diagram illustrate the determination of income and employment by using AD & AS and S& I analysis.
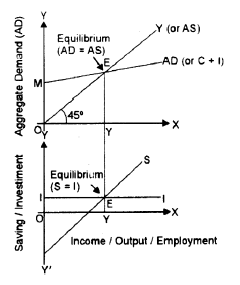
As per the above diagram, we can see that economy reaches equilibrium at ‘OY’ level of income, where AD equals to AS, In the same situation we could see that S & I are also equal. The situation is also known as ‘EFFECTIVE DEMAND’ situation.
Numerical Illustrations:
Question. In an economy, the consumption function is C= 500+0.75Y. Calculate the equilibrium level of income and consumption expenditure, when investment expenditure is Rs.5000.
Solution:
1) Equilibrium level of income
Y= C+I.
Y= 500+0.75Y + 5000
0.25Y = 5500
Y= 5500 / 0.25
Y= 22,000
2) Consumption at Equilibrium level of income
C= 500+ 0.75Y
C = 500 + 0.75 X 22000
C= 17000.
Question. Find National income from the following: Autonomous consumption =100
MPC = 0.80
Investment =50
Solution:
Y= C+ I
C= C + b (Y)
b= MPC
Y = C + b (Y) + I
Y = 100+ 0.8 Y + 50
0.2Y =150
Y (National Income) = Rs.750.
Question. If APC of an economy is 0.8, what should be saving at an income level of Rs. 4000 crores?
Solution:
APC+ APS = 1
Then, APS = 1-APC
APS= 0.2, i.e.,
APS= Saving / Income
(S/Y = 0.2)
0.2 = Saving / 4000
Saving = 0.2 x 4000
= 800 crores.
Question. Complete the following table.
Income MPC Saving APS
0 - -90 -
100 0.6 - -
200 0.6 - -
300 0.6 - -
Solution:
Question. Complete the following table.
Income Saving MPC APS
0 -12 -
20 -6 - -
40 0 - -
60 6 - -
Solution
Income Saving Consumption MPC APS
0 -12 12 - -
20 -6 26 0.70 -0.30
40 0 40 0.70 0
60 6 54 0.70 0.10
Key Points for Class 12 Economics Chapter 04 Determination of Income and Employment
Price Determination:-
When quantity demanded is equal to the quantity supplied of a particular commodity.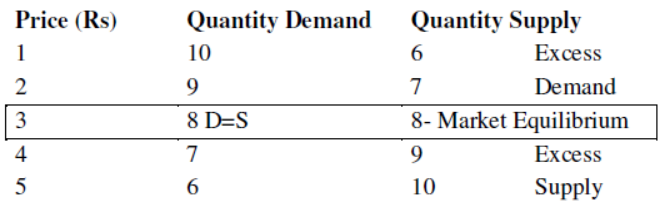
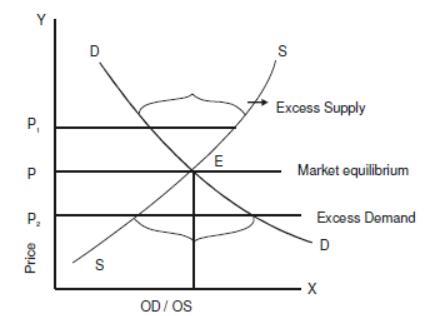
Equilibrium Price:- The price at which the quantity demanded of a commodity is equal to quantity supplied.
Effect on Equilibrium Price when
1. Change in demand
a) Increase in demand
Causes:-
1. Increase in Income of a consumer of Normal Goods
2. Increase in Price of Substitute goods.
3. Decrease in price of complimentary goods
4. Rise in expected future price. 
Effects:-
Equilibrium price and Quantity of demand and supply increase.1
b) Decrease in Demand
Causes:-
1. Decrease in Income of a consumer for normal goods.
2. Decrease in price of Substitute goods.
3. Increase in Price of Complimentary goods
4. Decrease in expected future price. 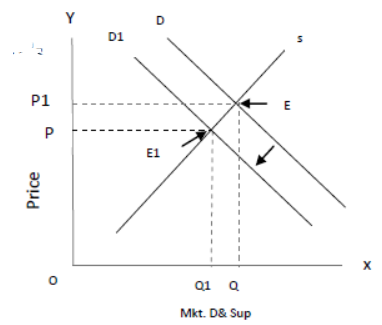
Effect:-
Price and Quantity both decrease
2. Change in Supply
a) Increase in supply
Causes:-
1. No. of firms increase
2. Technology improvement
3. Decrease in input price
4. Decrease in indirect tax and rise in subsidy
5. Decrease in expected future price.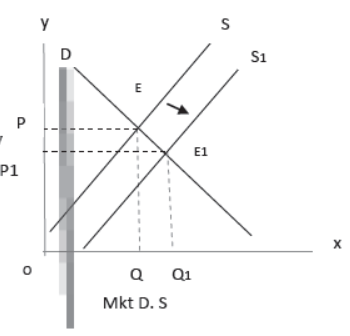
Effect:-
Equilibrium price decrease and equilibrium
Quantity increases
b) Decrease in supply
Causes:-
1. No. of firms decrease
2. Technology backwardness1
3. Increase in input price
4. Increase in indirect tax and rise in subsidy
5. Increase in expected future price. 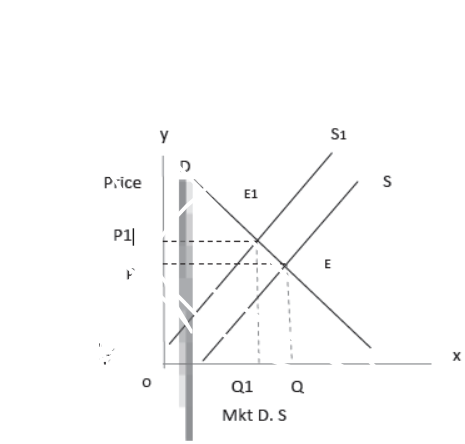
Effects:-
Equilibrium price increases and Equilibrium Quantity decreases.
3. When both demand and supply changes simultaneous
A) Simultaneous increase in the demand and increase in supply and decrease in supply
a) Increase in demand is more than increase in supply.
DD and SS curves shift rightwards to DD1 and SS1 Effect:- Equilibrium price increase and equilibrium quantity increases 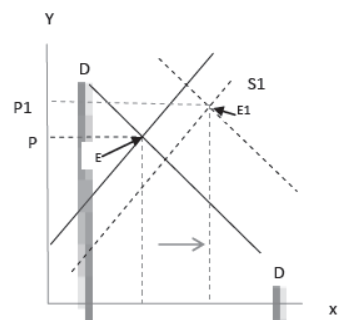
b) Increase in demand is less than increase in supply
DD and SS curves shift rightward to D1D1 and S1S1
Effect:- Equilibrium price decreases and equilibrium quantity increases.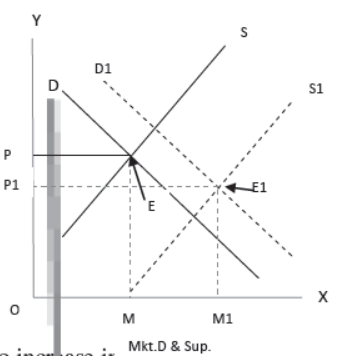
c) Increase in Demand is equal to increase in supply
DD and SS curves shift rightward to D1D1 and S1S1
Effect:- Equilibrium price constant and equilibrium quantity increases. 
B) Simultaneous decrease in the demand and decrease in supply
a) Decrease in demand is less than decrease in supply.
DD and SS curves shift leftward to D1D1 and S1S1
Effect:- Equilibrium price increases
And equilibrium quantity decreases
b) Decreases in demand is more than decreases in supply
DD and SS curves shift leftward to D1D1 and S1S1
Effect:- Equilibrium price decreases and Equilibrium quantity decreases.
c) Decrease in Demand is equal to decrease in supply DD and SS curves shift leftward to D1D1 and S1S1
Effect:- Equilibrium price remain constant and Equilibrium Quantity decreases.
Determination of equilibrium level of income:- Equilibrium level of income is determined by the Aggregate demand and Aggregate supply.
Aggregate Demand = Aggregate Supply (AD=AS)
Aggregate Demand:- Total demand of goods and services in an accounting year or expenditure incurred by an economy.
Aggregate Demand = C+I+G+X-M
Consumption:- Expenditure on all final goods and services.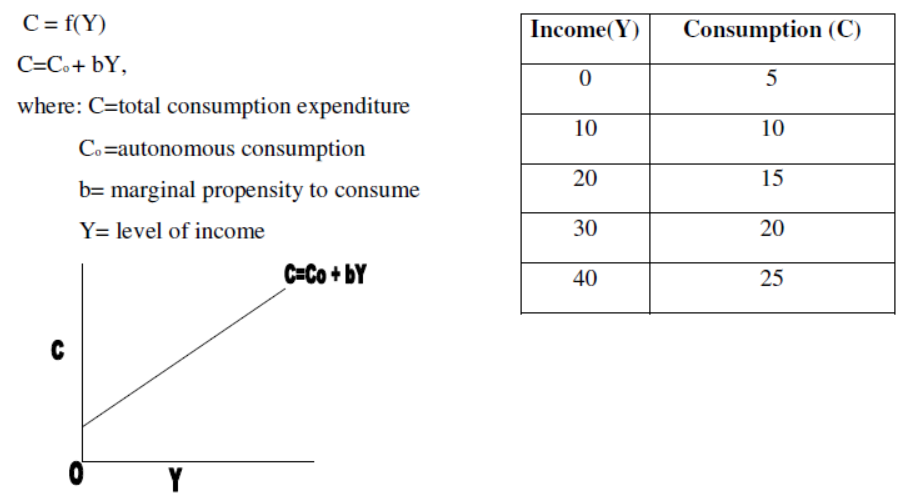
Investment = Expenditure on purchase of Intermediate goods as well produce good.
Investment are two types-
(A) Autonomous:- It is fixed not change as change in income. 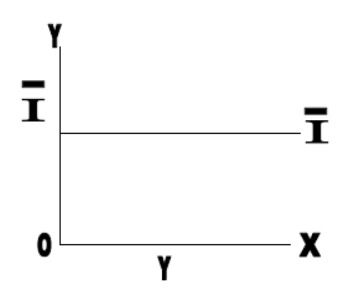
(B)Induced Investment:- Change as change in Income. 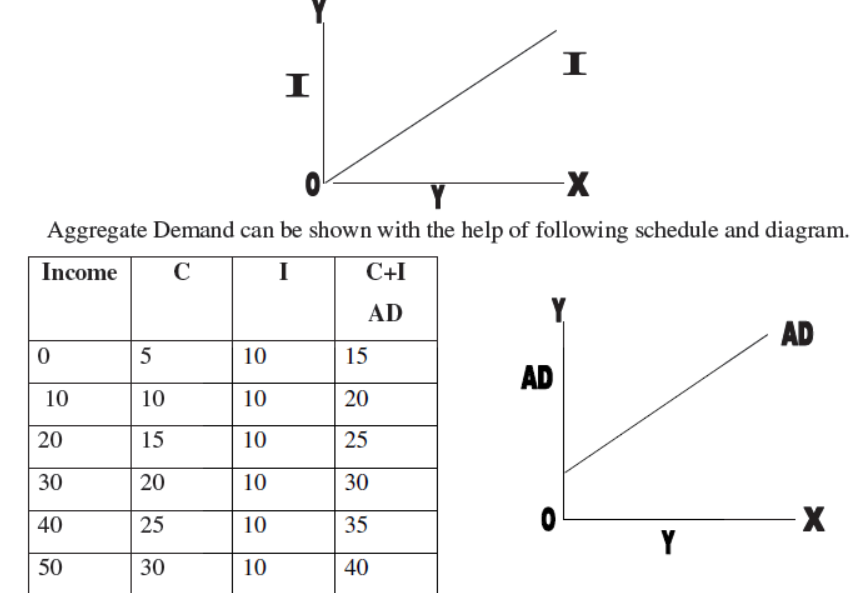
Aggregate Supply:- Total Money value of all final goods and services produced in an economy in an accounting year.
Aggregate Supply = C+S 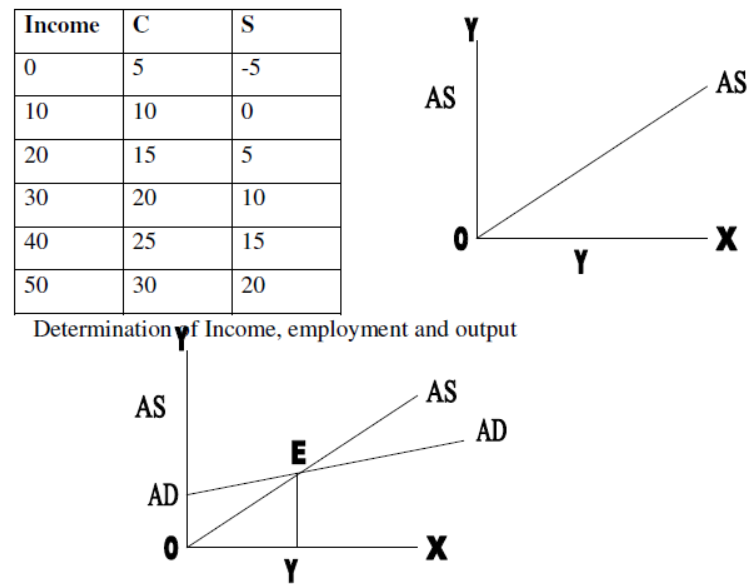
On E point Aggregate demand/ Aggregate supply
OQ is the level of income
Some Basic concepts
APC = Ratio between consumption and Income
APC = C/Y
APS = S/Y
APC = 1- APS
APS = 1- APC APC + APS = 1
MPC = Ratio between change in consumption and change in Income
APC = ΔC/ΔY
APS = ΔS/ΔY
MPC + MPS = 1
1 – MPC = MPS
1 – MPS = MPC
Multiplier
It is the ratio between change in Income and change in Investment.
K= ΔY/ ΔI K = 1/1 – MPC = 1/MPS
ΔY = ΔI x K
Excess Demand
Excess demand refers to situation when aggregate demand is in excess of Aggregate supply at full employment level.
AD>AS at full employment level
It can be explained with following diagram- 
Deficient Demand
If AD is less than AS at the full employment level.
AD < AS at full employment. 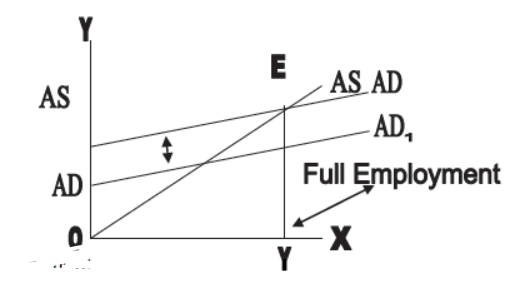
Effect of Deficient demand
1. Fall in Income and employment
2. Fall in Level of Output
3. Fall in General price level
Measures to Correct Excess Demand
By using following measures
1. Fiscal Policy- i) Increase Tax and reduce subsidy
ii) Reduce Govt. Expenditure
2. Monetary Policy- i) Increase in Bank rate
ii) Increase cash reserve ratio (CRR) and statuary liquidity ratio (SLR)
iii) Open Market Operations (Selling of Securities)
Measures to Correct Deficient demand
1. Fiscal Policy i) Reduce Taxes and increase subsidy
ii) Increase in Govt. expenditure
2. Monetary Policy i) Reduction in Bank rate
ii) Reduction in cash reserve ratio (CRR) and statutory liquidity ratio (SLR)
iii) Open Market Operations(Purchase of securities)
Meaning of involuntary unemployment and full employment.
Involuntary unemployment refers to a situation in which people are ready to work at prevailing wage rate, but do not find work.
Full employment refers to a situation in which no one is unemployed i.e.…there is no involuntary unemployment.
According to Keynes full employment signifies a level of employment where increase in aggregate demand does not lead to an increase in the level of output and employment.
Increase in demand beyond full employment causes prices to go up.
Investment multipliers and its working.
Investment multiplier explains the relationship between increase in investment and the resultant increase in income.
Investment multiplier is the ratio of change in income to change in investment.
Multiplier (k) =Δy/ΔI.
The value of multiplier depends on the value of marginal propensity to consume (MPC).
There is direct relationship between K and MPC.
Multiplier also depends on the marginal propensity to save
There is inverse relationship between multiplier and MPS.
IMPORTANT FORMULAE.
• AD=C+I (two sector economy).
• APC=C/Y.
• APS=S/Y.
• APC+APS=1
• MPC=ΔC/ΔY
• MPS=ΔS/ΔY
• MPS+MPC=1 AND 1-MPC=MPS
• K=ΔY/ΔC or K=1/MPS or K=I/I-MPC
• C= ~c+b(Y)
• S=-a+(1-b)Y
-a= negative saving
(1-b)=MPS
. AD=C+I
Consumption function C =ˉc + b(Y)
C = Autonomous consumption
Shows marginal propensity to consume due to unit increase in income In the short period price and rate of interest remaining constant i.e., ex-ante Investment expenditure is uniform / same amount every year.
I = I
LET US PRACTICE
Question. What is the relation between APC and APS?
Answer: APC+APS=1
Question. What is the relation between MPC and MPS?
Answer: MPS+MPC=1.
Question. If APC is 0.7 then how much will be APS?
Answer: 1-0.7=0.3
If MPC =0.75, what will be MPS?
Ans. MPC+MPS=1
1-0.75=0.25
Question. State the important factor influencing the propensity to consume in an economy?
Answer: The level of income (Y) Influences the propensity to consume (c) of an economy.
Question. What is meant by investment?
Answer: Investment means addition to the stock of capital good, in the nature of structures, equipment or inventory.
Question. What is the investment demand function?
Answer: The relationship between investment demand and the rate of interest is called investment demand function.
Question. What is equilibrium income?
Answer: The equilibrium income is the level of income where AD=AS i.e.…AD=AS and planned saving equals planned investment.
Question. Give the formula of investment multiplier in terms of MPC.
Answer: K=1/1-MPC
Question. What can be the minimum value of investment multiplier?
Answer: One.
Question. What is the maximum value of investment multiplier?
Answer: Infinity.
Question. Give t he equation of propensity to consume.
Answer: C=a+by.
Question. Explain the working of a multiplier with an example.
Answer: Multiplier tells us what will be the final change in the income, as a result of change in investment. Change in investment results in the change in income.
Symbolically:
y ΔI→ΔY→ΔC→ΔY
The working of a multiplier can be explained with the help of the following table which is based on the consumption that is, ΔI=1000 and MPC=4/5.
PROCESS OF INCOME GENERATION. 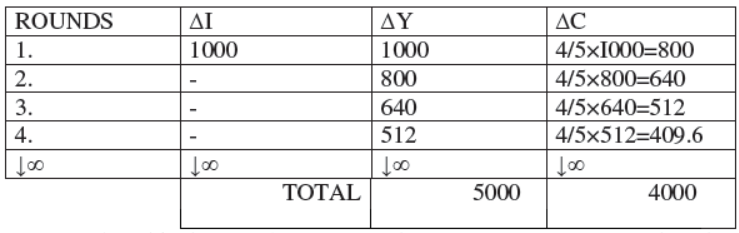
As per the table the initial increase in the investment of Rs 1000 there is a total increase in the income by Rs 5000 given MPC=4/5 . Out of this total increase in the income Rs 4000 will be consumed and Rs 5000 be saved.
The sum of total increase in income is also derived as:
Δy=1000+800=640+512+…………….infinity.
1000+4/5×1000(4/5)2×1000+(4/5)3×1ooo+………..infinity
=1000[1+4/5+ (4/5)2+(4/5)3+………infinity]
=1000[1/1-4/5] = 1000×5/1=Rs. 5000 cores.
Question. Differentiate between ex ante and ex post investment.
Answer: Ex ante is the planned investment which the planner intends to invest at different level of income and employment in the economy.
Ex post investment may differ from ex ante investment when the actual sales differ from the planned sales and the firms thus face unplanned addition or reduction of inventories.
Question. Draw a hypothetical propensity to consume curve from it draw the propensity curve to save curve
Answer: APC=C/Y APS=S/Y
Propensity to save curve
Is drawn from propensity to consume curve
When y=c APC=1
Till that point APS is negative at point„s‟
When y>c there is a positive saving 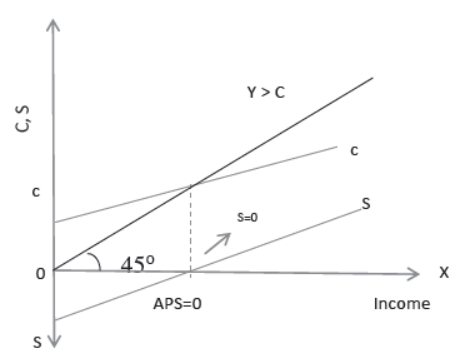
Question. Explain the determination of income and employment with AD and AS. (Give schedule)
Answer: AD= C+I
AS=C+S AS=Y (refers to countries national income)
The equilibrium level of income is determined at a point when AD=AS.
Equilibrium can be achieved at full employment and even at under employment situation.
It may not be always at full employment condition in an economy.
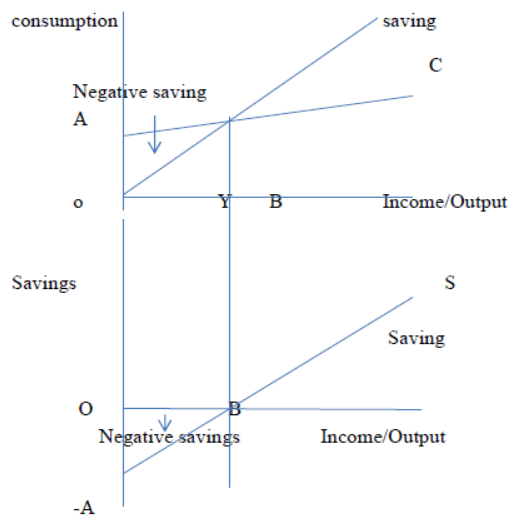
Draw a straight line consumption curve. From it derive a saving curve explaining the process. Show on the diagram.
a) The level of income at which average propensity to consume equal to one.
b) A level of income at which average propensity to save is negative. 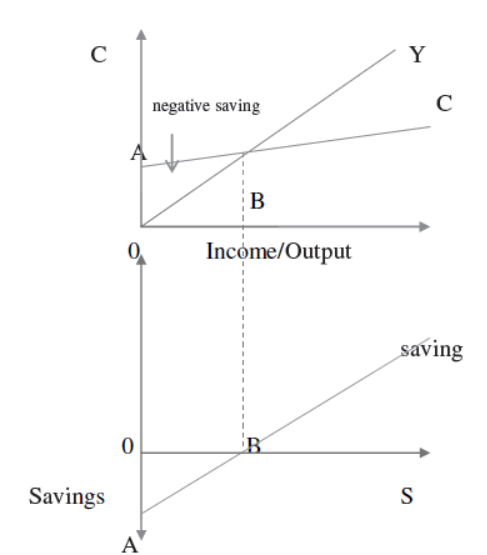
C is the consumption curve and OA is the consumption expenditure at zero level of income. Income minus consumption is saving.
→hen income is 0, the economy‟s consumption level is OA. The corresponding level of saving is -0A.
So –OA is the starting point of saving curve. At OB level of income consumption is equal to income, so saving are zero. so B is another point on saving curve .
Join A and B and extend this line to S, AS is the saving curve.
a) The level of income at which APC is equal to one is OB.
b) A level of income at which APS is negative OY.
NUMERICALS.
Question. If in an economy investment increases by Rs 1000 cores to Rs 1200 cores and as a result total income increases by 800 cores calculate capital MPS.
Answer: Δ I=1200-1000=200
ΔY=800
ΔK=ΔY/ΔI=800/200=4
K=1/MPS=4
MPS=1/4=0.25
MPS=0.25
Question. IF in an economy the actual level of income is Rs 500crores whereas the full employment the level of income is RS 800 cores. The MPC=0.75 calculate the increase in investment required to achieve full employment income.
Answer: Actual income=Rs500 cores
Full empl Income = Rs 800 cores
Δ y = 800 -500 = 300 cores
MPC = 0.75 = 75/100 = 3/4
K = 1 1 1 100
-------- = ----------- = ---------- = --------- = 4
01-MPC 1 - 0.75 0.25 25
→e know that Δ y = K. Δ I
300 = 4 × Δ I
Δ I = 75 crores
Question. Calculation of APC and MPC given the level of Income and Consumption
Answer:
Income consumption APC = c/y MPC = Δc/Δy
0 4 - -
10 12 1.20 0.80
20 20 1.00 0.80
30 28 0.93 0.80
40 36 0.90 0.80
Question. Calculation of APS and MPS given the level of Income and consumption Income consumption saving APS MPS
Answer:
(Rs in crores) (Rs in crores) (4 img)
Clue: APS = s/y MPS = Δs/Δy S=Y – C
Question. Suppose the consumption equals c= 40 + 0.75 y, Investment equals I = Rs 60 and Y= C + I. Find i) Equilibrium level of income ii) The level of consumption at
equilibrium iii) level of saving at equilibrium
Answer: i) Y= C + I AS = AD
Substituiting the value of c and I we get
Y = 40 + 0.75y + 60 Y= C+ I I=60
(Y-0.75y)= 100
0.25 Y = 100
Y= 100 = 10000
------- --------- = 400
0.25 25
Y = 400 Equilibrium level of Income
ii) Given c= 40 + 0.75Y
Y = 400
C= 40 + 0.75(400) = 340
C=340
iii) Y= C + S So S= Y-C
S= 400 -340 = 60
S= 60 crores
Question. In a two sector economy, the saving and investment functions are:
Answer: S= -10 + 0.2Y I = -3 + 0.1Y
What will be the equilibrium level of income?
Ans: Equilibrium level of income S= I
-10 + 0.2y = -3 + 0.1y
0.2y – 0.1y = -3 +10
0.1y =7
y = 70
Question. Explain the components of the equation c= 20 + 0.90 y and construct a schedule for consumption where income is Rs 200 ,Rs. 250, Rs 300 , Rs 350 and Rs 400.
Answer: Components of equation c=20 + 0.90y explained in ¾ mark question number 1
The schedule for consumption is as follows
Y (Income) c=20 + 0.90y
200 200 c= 20 + 0.9 × 200
250 245 =20 + 180 = 200
300 290 c= 20 + 0.9 ×250
350 335 = 20 + 225 = 245
400 380 c= 20 + 0.9 × 300 = 290
C= 20 + 0.9 × 350 = 335
C= 20 + 0.9 × 400 = 380
Question. The consumption function is C= 20 + 0.9y. The value of Income is given as 100,200, 300, 400 and 500. Find out the consumption schedule.
The consumption schedule
Answer:
Y (Income) C = 20 + 0.9 Y
0 C=20
100 C=20 + 0.9 (100) = 110
200 C=20 + 0.9 (200) = 200
300 C=20 + 0.9 (300) = 290
400 C=20 + 0.9 (400) = 380
500 C=20 + 0.9 (500) = 470
Question. How is equilibrium output of final goods determined under short run fixed price.
Under short run fixed price, equilibrium output and equilibrium demand at fixed price and constant rate of interest can be found with the help of following formulas
Answer:
__
Y= A__
1 – b
Y = Value of equilibrium output
__
A = Total Autonomous expenditure
b= MPC
Thus, value of equilibrium output (Y) depends on values of A (i.e, C + I) and b.
At equilibrium: AD = AS
__ __
Y= C + I + by
__ __ __ __
Y = A + by (A= C + I showing total autonomous expenditure)
__
Y–by=A
__
Y (1-b) = A
__
Y= A
--------
1-b
Free study material for Economics
CBSE Class 12 Economics Part B Macroeconomics Chapter 4 Determination Of Income And Employment Assignment
Access the latest Part B Macroeconomics Chapter 4 Determination Of Income And Employment assignments designed as per the current CBSE syllabus for Class 12. We have included all question types, including MCQs, short answer questions, and long-form problems relating to Part B Macroeconomics Chapter 4 Determination Of Income And Employment. You can easily download these assignments in PDF format for free. Our expert teachers have carefully looked at previous year exam patterns and have made sure that these questions help you prepare properly for your upcoming school tests.
Benefits of solving Assignments for Part B Macroeconomics Chapter 4 Determination Of Income And Employment
Practicing these Class 12 Economics assignments has many advantages for you:
- Better Exam Scores: Regular practice will help you to understand Part B Macroeconomics Chapter 4 Determination Of Income And Employment properly and you will be able to answer exam questions correctly.
- Latest Exam Pattern: All questions are aligned as per the latest CBSE sample papers and marking schemes.
- Huge Variety of Questions: These Part B Macroeconomics Chapter 4 Determination Of Income And Employment sets include Case Studies, objective questions, and various descriptive problems with answers.
- Time Management: Solving these Part B Macroeconomics Chapter 4 Determination Of Income And Employment test papers daily will improve your speed and accuracy.
How to solve Economics Part B Macroeconomics Chapter 4 Determination Of Income And Employment Assignments effectively?
- Read the Chapter First: Start with the NCERT book for Class 12 Economics before attempting the assignment.
- Self-Assessment: Try solving the Part B Macroeconomics Chapter 4 Determination Of Income And Employment questions by yourself and then check the solutions provided by us.
- Use Supporting Material: Refer to our Revision Notes and Class 12 worksheets if you get stuck on any topic.
- Track Mistakes: Maintain a notebook for tricky concepts and revise them using our online MCQ tests.
Best Practices for Class 12 Economics Preparation
For the best results, solve one assignment for Part B Macroeconomics Chapter 4 Determination Of Income And Employment on daily basis. Using a timer while practicing will further improve your problem-solving skills and prepare you for the actual CBSE exam.
FAQs
You can download free PDF assignments for Class 12 Economics Part B Macroeconomics Chapter 4 Determination Of Income And Employment from StudiesToday.com. These practice sheets have been updated for the 2026-27 session covering all concepts from latest NCERT textbook.
Yes, our teachers have given solutions for all questions in the Class 12 Economics Part B Macroeconomics Chapter 4 Determination Of Income And Employment assignments. This will help you to understand step-by-step methodology to get full marks in school tests and exams.
Yes. These assignments are designed as per the latest CBSE syllabus for 2026. We have included huge variety of question formats such as MCQs, Case-study based questions and important diagram-based problems found in Part B Macroeconomics Chapter 4 Determination Of Income And Employment.
Practicing topicw wise assignments will help Class 12 students understand every sub-topic of Part B Macroeconomics Chapter 4 Determination Of Income And Employment. Daily practice will improve speed, accuracy and answering competency-based questions.
Yes, all printable assignments for Class 12 Economics Part B Macroeconomics Chapter 4 Determination Of Income And Employment are available for free download in mobile-friendly PDF format.