
Read and download the CBSE Class 12 Economics Introduction to Micro Economics Assignment Set 02 for the 2026-27 academic session. We have provided comprehensive Class 12 Economics school assignments that have important solved questions and answers for Part A Microeconomics Chapter 1 Introduction To Micro Economics. These resources have been carefuly prepared by expert teachers as per the latest NCERT, CBSE, and KVS syllabus guidelines.
Solved Assignment for Class 12 Economics Part A Microeconomics Chapter 1 Introduction To Micro Economics
Practicing these Class 12 Economics problems daily is must to improve your conceptual understanding and score better marks in school examinations. These printable assignments are a perfect assessment tool for Part A Microeconomics Chapter 1 Introduction To Micro Economics, covering both basic and advanced level questions to help you get more marks in exams.
Part A Microeconomics Chapter 1 Introduction To Micro Economics Class 12 Solved Questions and Answers
Very Short answer Type Question
Question. What is the slope of an Indifference curve?
Answer: Slope of the indifference curve = Marginal rate of substitution (ΔY/ΔX)
Question. Good X and Good Y are complementary goods. If price of Good X increases, discuss briefly its likely impact on the demand for Good Y.
Answer: Good X and Good Y are complementary goods which are jointly demanded therefore if the price of Good X increases the demand for Good Y will decrease. This is due to the inverse relationship between the price ofgiven good and demand for its complementary good.
Question. If the income of a consumer increases, discuss briefly its likely impact on the demand for a normal good, Good X.
Answer: Increase in income of consumer leads to an increase in purchasing power of consumer so the demand for normal good X increases, as the demand for normal good is directly related to the income of consumer.
Question. Classify the following statements into positive economics or normative economics, with suitable reasons:
(a) Consumer price index presents a more realistic picture of the inflation rate in a country, than the wholesale price index.
(b) Subsidies should be offered very carefully.
Answer: (a) Positive statement – it deals with a real life situation, justifiable by facts.
(b) Normative statement – it deals with a situation as it ‘ought to be’.
Question. ‘‘Problem of resource allocation would not arise, if resources do not have alternative uses.’’ Defend or refute the statement with valid arguments.
Answer: Yes the given statement is correct. The economic problem of resource allocation arises because resources are scare & can be put to alternate uses. If a resource can be put only to a specific use then the problem of resource allocation would not arise.
Question. Explain the likely impact of large scale outflow of foreign capital on Production Possibilities curve of the economy.
Answer: Large scale outflow of foreign capital from the economy will reduce resources and thus production potential of the country will fall. Fall in production potential in turn will shift the PP Curve to the left towards the origin.
Question. State giving reasons whether the following statements are true or false:
(a) Marginal utility can never be negative.
(b) When the marginal utility falls, total utility also decreases.
Answer: (a) False: Marginal utility of a good falls and becomes negative when total utility falls as consumption of additional units of a commodity.
(b) False: When marginal utility (MU) falls, total utility (TU) may increase (at decreasing rate) so long as MU is positive.
Short answer Type Question
Question. What is likely to be the impact of efforts towards reducing unemployment on the production potential of the economy? Explain.
Answer: Reducing unemployment has no effect on the production potential of the country. It is because production potential is determined assuming full employment. Unemployment indicates that the country is operating below potential. Reducing unemployment simply helps in reaching potential.
Question. Comment upon the shape of production possibility curve, if the marginal rate of transformation is constant.
Answer: Since the marginal rate of transformation is constant, in order to produce an additional unit of commodity X, same units of good Y are scarified, i.e rate of sacrifice remains constant. Therefore, the shape of production possibility curve will be a straight line, downward sloping from left to right.
Question. Comment upon the shape of production possibility curve, if the marginal rate of transformation decreases.
Answer: Since the marginal rate of transformation decreases, in order to produce additional unit of commodity X, lesser and lesser units of good Y are scarified i.e. the rate of sacrifice decreases. Therefore, the shape of the production possibility curve will be convex to origin, sloping downward from left to right.
Question. (a) Why is a production possibilities curve concave?
(b) What does a point lying below the PPC highlight?
Answer: (a) A production possibilities curve (PPC) is concave to the origin, i.e., its slope is increasing, because Rate of Marginal Transformation (MRT) increases as we move downwards along the curve from left to right. MRT increases because no resource is equally efficient in production of both the goods. As we transfer resources from one good to another, the rate of sacrifice, i.e., MRT increases because we have to transfer less and less efficient resources.
(b) Any point below the PPC highlights the problem of unemployment and inefficiency in the economy. It represents a combination of the two goods that will be produced when the resources are under-utilised or inefficiently utilised or both. In other words, production is below the potential in the economy.
Question. Economic slowdown in some parts of the world has adversely affected demand for Indian exports. What will be its effect on the production possibilities frontier of India? Explain.
Answer: There will be no effect on the Production Possibilities Frontier (PPF) of India. It is because PPF shows only what a country can potentially produce, and not what it actually produces. Slowdown by reducing demand for Indian exports, may ultimately bring down output. Therefore, production will take place at a point somewhere below the PPF. That is, production in the economy will be below its potential.
Question. Explain the behaviour of ‘marginal rate of transformation’ along a production possibility curve.
Answer: Marginal Rate of transformation (MRT) increases as we move along the Production Possibility Curve (PPC) from left to right. MRT increases because it is based on the assumption that resources are not equally efficient in production of both the goods. Thus, when resources are transferred from one use (Good Y) to another (Good X), more and more units of Good Y are to be sacrificed to produce an additional unit of Good X.
Question. State giving reasons whether the following statements are true or false:
(a) A point above the PPC represents the growth of resources.
(b) The concavity of PPC implies diminishing marginal rate of transformation.
(c) Massive unemployment shifts the PPC to the left.
Answer: (a) False: A point above the PPC represents a combination of the two goods which is not obtainable because of scarcity of resources.
(b) False: The concave downward sloping PP curve has an increasing slope. The slope of the PP curve is the same as Marginal Rate of Transformation (MRT). So, concavity of PP curve implies increasing MRT.
(c) False: Due to massive unemployment, production will take place at any point inside the PPC, but it will not shift to the left. This is because unemployment implies under-utilisation of resources, not decrease in resources.
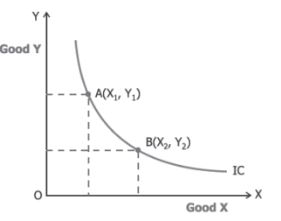
Question. Discuss briefly the following properties of an indifference curve, using diagram:
(a) Convexity to origin
(b) Downward sloping from left to right
Answer: (a) An Indifference curve is convex to the origin due to Diminishing Marginal Rate of Substitution (DY/DX). In the above diagram, the consumer is willing to sacrifice lesser and lesser units of good Y to gain one additional units of good X.
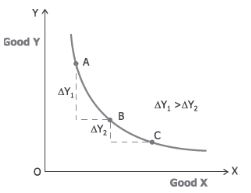
(b) An Indifference curve is downward sloping – meAnswer that the indifference curve is negatively sloped. This property signifies that to remain on the same level of satisfaction the consumer must forego units of one good if he wishes to consume more units of the other good.
Question. A consumer consumes only two goods X and Y and is in equilibrium. Price of X falls. Explain the reaction of consumer through the marginal utility analysis.
Answer: According to the marginal utility analysis, the consumer is in equilibrium when MUy/Py = MUy/Py.
Now, given that Px falls, then MUx/Px > MUy/Py. Since per rupee MUx is greater than per rupee MUy, it meAnswer that satisfaction derived from consumption of good X is greater than the satisfaction derived from consumption of good Y.
This will induce the consumer to buy more of X by reducing expenditure on Y.
— Buying more of X reduces MUx. Px remaining unchanged, MUx/Px is also reduced.
— Buying less of Y raises MUy/Py remaining unchanged, it raises MUy/Py
The change continues till MUx/Px becomes equal to MUy/Py and the consumer is in equilibrium.
Question. A rational consumer is consuming only two goods, Good X and Good Y. The prices of the goods are `20 and `10 respectively.
Her total money income is `200. Answerwer the following questions, using the given information :
(i) State her Budget line equation.
(ii) State the slope of the Budget line of the consumer.
(iii) If she decides to spend her entire income on Good Y, how many units of Good Y can she buy ?
Answer: (i) Px.Qx + Py.Qy = M
20.Qx + 10.Qy = 200
(ii) Slope of Budget line = (ignoring minus sign) = 2
(iii) If the entire income is spent on Good Y Qx is zero;
Px.Qx + Py.Qy = M
20 × 0 + 10 × Qy = 200
Qy = 20 units.
Question. Discuss briefly, using a hypothetical schedule the concept of diminishing marginal rate of substitution.
Answer:
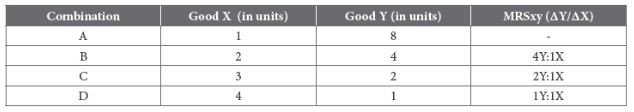
Diminishing Marginal Rate of Substitution implies that a consumer is willing to sacrifice lesser unitsof Good Y for every additional unit of Good X. As given in the schedule, moving from combination B to C the consumer is willing to give up 2 units of Good Y so as to gain an additional unit of Good X(2Y : 1X), which diminishes to 1Y : 1X in combination D.
Question. Explain the law of diminishing marginal utility, using a hypothetical schedule.
Answer: The law of diminishing marginal utility states as follows:
“As a consumer consumes more and more units of a specific commodity, without a time lag, the additional utility (satisfaction), he expects to derive from each successive unit will go on diminishing.”
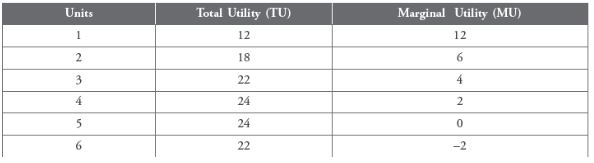
As per the schedule, marginal utility at first unit of consumption is 12 utils and it goes on falling as consumption increases. As the consumer consumes more and more units of a commodity one after the other, the marginal utility falls to zero(at 5th unit) and even becomes negative (at 6th unit).
Question. State giving reasons whether the following statements are true or false:
(a) Marginal rate of substitution (MRS) is the term used to denote the rate at which the consumer is required to sacrifice units of one good to obtain one more unit of the other good.
(b) At the point of consumer’s equilibrium marginal rate of substitution should be diminishing.
Answer: (a) False: Marginal rate of substitution (MRS) is the term used to denote the rate at which the consumer is willing to sacrifice units of one good to obtain one more unit of the other good.
(b) True: At the point of consumer’s equilibrium, MRS falls because of the law of Diminishing Marginal Rate of Substitution. So, the indifference curve is convex to the origin.
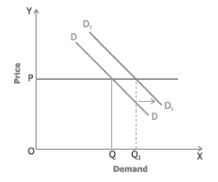
Question. How would the demand for a commodity be affected by a change in ‘‘tastes and preferences’’ of the consumers in favour of the commodity ? Explain using a diagram.
Answer: If there is a favourable change in taste and preferences of the consumer for a good at the same price OP the quantity demanded would increase from OQ to OQ1.
Demand curve (DD) will shift to the right (D1D1).
This rightward shift shows increase in demand for the good at the same price, keeping other factors constant.
Question. Explain the effect of the increase in the level of air pollution, on the market demand for ‘‘Air Purifiers’’.
(Use diagram)
Answer:
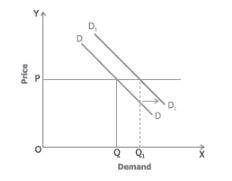
With increase in level of air pollution market demand for air purifiers will increase. DD is the market demand curve of air purifier at a given level of air pollution. It will shift rightwards to D1D1 due to change in preference for air purifiers, as the pollution level rises.
Question. Suppose a consumer whose budget is `500, wants to consume only two goods, Good X and Good Y. The goods are respectively priced at `50 and `25.
Answer. the following questions on the basis of the given information :
(a) State the budget equation of the consumer.
(b) What is the slope of the budget line ?
(c) How many units can she purchase if she spends the entire `500 on Good X ?
(d) How many units can she purchase if she spends the entire `500 on Good Y, given that the price of good Y has doubled ?
Answer: (a) PxQx + PyQy = M
50.Qx + 25.Qy = 500
(b) Slope = –Px/Py = –50/25 = –2
(c) Qx = M/Px = 500/10 = 10 units of Good X.
(d) Qy = M/Py = 500/50 = 10 units of Good Y. (since price of commodity Y has doubled)
Question. State giving reasons whether the following statements are true or false:
(a) Lower indifference curve represents higher level of satisfaction.
(b) Marginal rate of substitution is a measure of the slope of a budget line.
(c) A budget set is a collection of such bundles of goods that give same satisfaction.
Answer: (a) False: Lower indifference curve represents lower level of satisfaction because a point on a lower indifference curve represents a consumption bundle which contains less good(s).
(b) False: Marginal rate of substitution (MRS) is a measure of the slope of indifference curve.
(c) False: Budget set is a collection such bundles of goods which cost less than or equal to the consumer’s money income at the given prices.
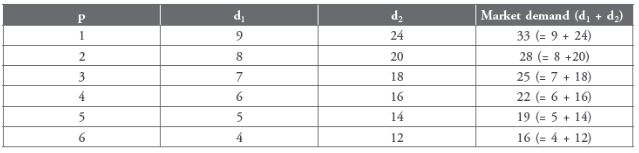
Question. Consider a market where there are just two consumers and suppose their demands for the good at different prices are given below. Calculate the market demand for the good at each price.
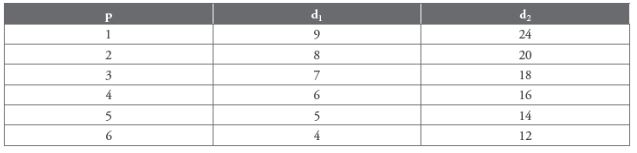
Answer: Market demand is the total quantity demanded of a good by all the consumers at a given price during a given period of time.
Question. How is the price elasticity of demand of a commodity affected by the number of its substitutes? Explain.
Answer: More the number of substitutes available of a good, higher is its price elasticity of demand because in case of price change, the consumers can conveniently shift from one substitute to another. For example, Pepsi has many close substitutes, e.g., Coca-Cola, Limca, etc. If its price goes up, people can shift to other brands of cold drinks. Therefore, demand for Pepsi is elastic. If close substitutes of a good are not available easily in the market, the demand for the good is likely to be inelastic. For example, demand for salt is inelastic.
Question. State giving reasons whether the following statements are true or false:
(a) A budget set is the collection of all bundles of goods that a consumer wants to buy.
(b) An indifference curve is convex to the origin because of the operation of the law of diminishing marginal utility.
Answer: (a) False: A budget set is the collection of all bundles of goods that a consumer can afford to buy with his given income and the prices of the goods in the market.
(b) True: The indifference curve is convex to the origin because when a consumer moves downwards along the indifference curve, Marginal Rate of Substitution (MRS) between the two
Question. Discuss briefly, using a hypothetical schedule, the relation between marginal utilityand total Utility
Answer:

Relationship between total utility and Marginal Utility
(i) Marginal utility falls but remains positive as long as total utility increases from 1st unit to 4th unit of consumption.
(ii) When marginal utility is Zero, total utility is maximum i.e. at 5th unit of consumption.
(iii) When marginal utility becomes negative, total utility starts falling but remains positive i.e. at 6th unit of consumption and beyond.
Question. Giving reason, state the impact of each of the following on demand curve of normal good ‘X’ if
(i) Price of its complementary good falls.
(ii) News reports claims that consumption of product X has harmful effect on human health.
(iii) Income of consumer increases.
Answer: (i) Demand of the good X will increase, hence demand curve of good X shifts towards right.
(ii) Demand of Good X may decrease as people may be inclined to consume less due to media reports of harmful effect of the good X. As a result, demand curve may shift towards left.
(iii) When income of consumer increases the disposable income increases and consumer is in a better position of spending more on the good X. Hence, consumer may consume more of the commodity due to which the demand for the goods increases and demand curve shifts away from origin.
Question. Giving valid reasons, state whether the following statements are true or false:
(a) An increase in the income of a consumer would lead to an increase in demand for all types of goods demanded by him.
(b) If percentage change in quantity demanded is equal to percentage change in price, the demand curve will be a straight line parallel to y-axis.
Answer: (a) The given statement is false: The quantity of a good that a consumer demands can increase or decrease with rise in income. This depends upon the nature of the good i.e. normal good or an inferior good. With increase in income of an individual, the demand for normal good rises whereas demand for inferior good falls.
(b) The given statement is false: The demand curve in this situation will be downward sloping from left to right due to inverse relationship between price and its quantity demanded. Since percentage change in quantity demanded is equal to percentage change in price, therefore Ed = 1 (ignoring minus sign). Hence the demand curve will be a rectangular hyperbola.
Question. State giving reasons whether the following statements are true or false:
(a) The demand for a good always increases with increase in the prices of other goods.
(b) Demand for a good always increases with the increase in income of its buyers.
Answer: (a) False: With increase in the price of a substitute good, the demand for a good increases. But with increase in the price of the complementary good, the demand for the given good decreases.
(b) False: With the increase in income, demand for a normal good increases but demand for an inferior good decreases.
Question. When does a consumer buy more quantity of a commodity at a given price? Give three points.
Answer: (i) When income of the consumer increases, if it is a normal good.
(ii) When there is a fall in the price of the complementary good.
(iii) When there is a rise in prices of substitute goods.
Question.’As the price of a good falls, the resulting increased purchasing power may be a reason for increase in quantity demanded’. Do you agree with the given statement? Give reason for your Answer.
Answer: When price of a good falls the purchasing power (real income) of the consumer increases as he will able to purchase more units of the given good with the same money income. This phenomenon is called as income effect and is one of the main reasons for negative slope of demand curve.
Question. State giving reasons whether the following statements are true or false:
(a) If goods X and Y are substitutes, a rise in price of X will result in a rightward shift in demand curve of Y.
(b) If a fall in price of good X leads to a rise in demand for good Y, then X and Y are substitute goods.
Answer: (a) True: If goods X and Y are substitutes, a rise in price of X makes Y relatively cheaper. Therefore, it leads to increase in demand for good Y at the same price. As a result, demand curve of Y shifts to the right.
(b) False: X and Y are complementary goods and not substitute goods.
Question. (a) What will be the effect of increase in number of buyers on demand curve for a good?
(b) Goods X and Y are substitutes. Explain the effect of fall in price of Y on demand for X.
Answer: (a) If the number of buyers of a good in the market increases, it leads to increase in market demand for the good at the same price. As a result, market demand curve shifts to the right.
(b) Goods X and Y are substitutes for each other. Fall in price of Y makes it relatively cheaper. Good X becomes relatively expensive as compared to Y. The consumers will shift to Y. It leads to decrease in demand for X at the same price.
Free study material for Economics
CBSE Class 12 Economics Part A Microeconomics Chapter 1 Introduction To Micro Economics Assignment
Access the latest Part A Microeconomics Chapter 1 Introduction To Micro Economics assignments designed as per the current CBSE syllabus for Class 12. We have included all question types, including MCQs, short answer questions, and long-form problems relating to Part A Microeconomics Chapter 1 Introduction To Micro Economics. You can easily download these assignments in PDF format for free. Our expert teachers have carefully looked at previous year exam patterns and have made sure that these questions help you prepare properly for your upcoming school tests.
Benefits of solving Assignments for Part A Microeconomics Chapter 1 Introduction To Micro Economics
Practicing these Class 12 Economics assignments has many advantages for you:
- Better Exam Scores: Regular practice will help you to understand Part A Microeconomics Chapter 1 Introduction To Micro Economics properly and you will be able to answer exam questions correctly.
- Latest Exam Pattern: All questions are aligned as per the latest CBSE sample papers and marking schemes.
- Huge Variety of Questions: These Part A Microeconomics Chapter 1 Introduction To Micro Economics sets include Case Studies, objective questions, and various descriptive problems with answers.
- Time Management: Solving these Part A Microeconomics Chapter 1 Introduction To Micro Economics test papers daily will improve your speed and accuracy.
How to solve Economics Part A Microeconomics Chapter 1 Introduction To Micro Economics Assignments effectively?
- Read the Chapter First: Start with the NCERT book for Class 12 Economics before attempting the assignment.
- Self-Assessment: Try solving the Part A Microeconomics Chapter 1 Introduction To Micro Economics questions by yourself and then check the solutions provided by us.
- Use Supporting Material: Refer to our Revision Notes and Class 12 worksheets if you get stuck on any topic.
- Track Mistakes: Maintain a notebook for tricky concepts and revise them using our online MCQ tests.
Best Practices for Class 12 Economics Preparation
For the best results, solve one assignment for Part A Microeconomics Chapter 1 Introduction To Micro Economics on daily basis. Using a timer while practicing will further improve your problem-solving skills and prepare you for the actual CBSE exam.
FAQs
You can download free PDF assignments for Class 12 Economics Part A Microeconomics Chapter 1 Introduction To Micro Economics from StudiesToday.com. These practice sheets have been updated for the 2026-27 session covering all concepts from latest NCERT textbook.
Yes, our teachers have given solutions for all questions in the Class 12 Economics Part A Microeconomics Chapter 1 Introduction To Micro Economics assignments. This will help you to understand step-by-step methodology to get full marks in school tests and exams.
Yes. These assignments are designed as per the latest CBSE syllabus for 2026. We have included huge variety of question formats such as MCQs, Case-study based questions and important diagram-based problems found in Part A Microeconomics Chapter 1 Introduction To Micro Economics.
Practicing topicw wise assignments will help Class 12 students understand every sub-topic of Part A Microeconomics Chapter 1 Introduction To Micro Economics. Daily practice will improve speed, accuracy and answering competency-based questions.
Yes, all printable assignments for Class 12 Economics Part A Microeconomics Chapter 1 Introduction To Micro Economics are available for free download in mobile-friendly PDF format.