
Read and download the CBSE Class 11 Economics Presentation of Data Assignment for the 2026-27 academic session. We have provided comprehensive Class 11 Economics school assignments that have important solved questions and answers for Statistics For Economics Chapter 4 Presentation Of Data. These resources have been carefuly prepared by expert teachers as per the latest NCERT, CBSE, and KVS syllabus guidelines.
Solved Assignment for Class 11 Economics Statistics For Economics Chapter 4 Presentation Of Data
Practicing these Class 11 Economics problems daily is must to improve your conceptual understanding and score better marks in school examinations. These printable assignments are a perfect assessment tool for Statistics For Economics Chapter 4 Presentation Of Data, covering both basic and advanced level questions to help you get more marks in exams.
Statistics For Economics Chapter 4 Presentation Of Data Class 11 Solved Questions and Answers
Multiple Choice Questions
Question. Choose the correct statement from the given below.
(a) Diagrams cannot show a large number of facts at a time.
(b) Diagrams can show only approximated values.
(c) Diagrams as a means of drawing conclusions, can be misused.
(d) All of the above is correct
Answer : D
Question. Which of the following is/are parts of graphic presentation?
(a) Graphs of frequency distribution
(b) Graphs of time series
(c) Both (a) and (b)
(d) Neither (a) nor (b)
Answer : C
Question. Which of the following is/are the importance of diagrammatic presentation?
(a) Simple to understand
(b) Universal acceptance
(c) Used for locating positional averages
(d) All of the above
Answer : D
Question. Choose the incorrect statement from the given below.
(a) Width of the bar diagrams can vary
(b) Length of the bar diagram can be different
(c) Gaps within each bar should not vary
(d) Proper scale should be used for construction of bar diagrams
Answer : A
Question. The adjustment factor in a histogram is equal to ……… .
(a) Width of the Class /Width of Highest Class
(b) Width of the Class /Width of Lowest Class
(c) Width of theLowestClass /Width of theClass
(d) None of the above
Answer : B
Question. Which of the following is/are type(s) of time series graphs?
(a) One variable graph
(b) Two or more variable graph
(c) Graphs of different units
(d) All of the above
Answer : D
Question. Histograms can be constructed under which of the following cases?
(a) When class intervals are equal
(b) When mid points are given
(c) When class intervals are unequal
(d) All of the above
Answer : D
Question. A symmetrical curve is the one which has ……… .
(a) equal area on both sides of the curve
(b) more area on the right side of the curve
(c) more area on the left side of the curve
(d) None of the above
Answer : A
Question. Less than ogive curve starts from …… .
(a) origin
(b) maximum point
(c) minimum point
(d) None of the above
Answer : A
Question. Headings and sub-headings given to columns are known as ……… .
(a) Stubs
(b) Captions
(c) Titles
(d) None of these
Answer : B
Question. One-dimensional diagrams are also known as
(a) Simple bar graphs
(b) Multiple bar graphs
(c) Both (a) and (b)
(d) Neither (a) nor (b)
Answer : C
Question. More than ogive curve starts from …… .
(a) origin
(b) maximum point
(c) minimum point
(d) None of these
Answer : B
Question. Degree of any component part of a pie-diagram is equal to
(a) (Component Value/Total Value) × 360
(b) (Component Value/Total Value) × 100
(c) (Total Value/Component Value) × 360
(d) (Total Value/Component Value) × 100
Answer : A
Question. In graphical presentation, data is presented in its accurate form. Choose from the options below.
(a) True
(b) False
(c) Partially true
(d) Incomplete statement
Answer : B
Question. Which of the following are types of graphic distribution?
(i) Line frequency graph
(ii) Histogram
(iii) Frequency polygon
(iv) Frequency curve
(v) Cumulative frequency curve
Choose from the options below.
(a) (i), (ii), (iv), (v)
(b) (ii), (iii), (iv), (v)
(c) (i), (iii), (iv), (v)
(d) (i), (ii), (iii), (iv), (v)
Answer : D
Direction Analyse the case study graphs and answer questions 81 to 85 on the basis of the same.
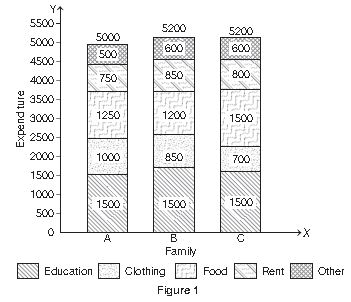
Question. Sub-divided bar graphs can be replaced by ………… bar graph.
(a) simple
(b) multiple
(c) Either (a) or (b)
(d) None of the above
Answer : B
Question. Which of the following type of graph is represented in Figure 1?
(a) Sub-divided bar graph
(b) Broken bar graph
(c) Percentage bar graph
(d) Deviation bar graph
Answer : A
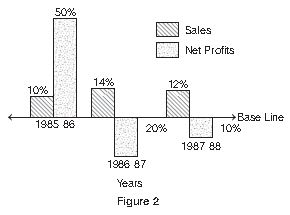
Question. As per Figure 2, the bar below the origin shows
(a) profit
(b) loss
(c) surplus
(d) None of the above
Answer : B
Question. Which of the following type of graph is represented in Figure 2?
(a) Sub-divided bar graph
(b) Broken bar graph
(c) Percentage bar graph
(d) Deviation bar graph
Answer : D
Question. As per given Figure 1, which family has the lowest expenditure?
(a) Family A
(b) Family B
(c) Family C
(d) All families have similar income
Answer : A

Question. As per the data given above, which country has the highest degree share?
(a) Germany
(b) Italy
(c) Ireland
(d) None of the above
Answer : B
Question. What is the degree share of Belgium?
(a) 3.8 degree
(b) 13.68 degree
(c) 14.62 degree
(d) 16.42 degree
Answer : A
Question. .…… diagram is used when value of some variable is very high or low as compared to other values in the series.
(a) Pie-chart
(b) Histogram
(c) Bar graph
(d) Either (a) or (b)
Answer : D
Question. Which country has the lowest degree share?
(a) Austria
(b) Denmark
(c) Finland
(d) Greece
Answer : A
Question. The segment used to represent the countries under the pie-diagram is known as ………… .
(a) Degree share
(b) Percent share
(c) Both (a) and (b)
(d) Neither (a) or (b)
Answer : A


Free study material for Economics
CBSE Class 11 Economics Statistics For Economics Chapter 4 Presentation Of Data Assignment
Access the latest Statistics For Economics Chapter 4 Presentation Of Data assignments designed as per the current CBSE syllabus for Class 11. We have included all question types, including MCQs, short answer questions, and long-form problems relating to Statistics For Economics Chapter 4 Presentation Of Data. You can easily download these assignments in PDF format for free. Our expert teachers have carefully looked at previous year exam patterns and have made sure that these questions help you prepare properly for your upcoming school tests.
Benefits of solving Assignments for Statistics For Economics Chapter 4 Presentation Of Data
Practicing these Class 11 Economics assignments has many advantages for you:
- Better Exam Scores: Regular practice will help you to understand Statistics For Economics Chapter 4 Presentation Of Data properly and you will be able to answer exam questions correctly.
- Latest Exam Pattern: All questions are aligned as per the latest CBSE sample papers and marking schemes.
- Huge Variety of Questions: These Statistics For Economics Chapter 4 Presentation Of Data sets include Case Studies, objective questions, and various descriptive problems with answers.
- Time Management: Solving these Statistics For Economics Chapter 4 Presentation Of Data test papers daily will improve your speed and accuracy.
How to solve Economics Statistics For Economics Chapter 4 Presentation Of Data Assignments effectively?
- Read the Chapter First: Start with the NCERT book for Class 11 Economics before attempting the assignment.
- Self-Assessment: Try solving the Statistics For Economics Chapter 4 Presentation Of Data questions by yourself and then check the solutions provided by us.
- Use Supporting Material: Refer to our Revision Notes and Class 11 worksheets if you get stuck on any topic.
- Track Mistakes: Maintain a notebook for tricky concepts and revise them using our online MCQ tests.
Best Practices for Class 11 Economics Preparation
For the best results, solve one assignment for Statistics For Economics Chapter 4 Presentation Of Data on daily basis. Using a timer while practicing will further improve your problem-solving skills and prepare you for the actual CBSE exam.
FAQs
You can download free PDF assignments for Class 11 Economics Statistics For Economics Chapter 4 Presentation Of Data from StudiesToday.com. These practice sheets have been updated for the 2026-27 session covering all concepts from latest NCERT textbook.
Yes, our teachers have given solutions for all questions in the Class 11 Economics Statistics For Economics Chapter 4 Presentation Of Data assignments. This will help you to understand step-by-step methodology to get full marks in school tests and exams.
Yes. These assignments are designed as per the latest CBSE syllabus for 2026. We have included huge variety of question formats such as MCQs, Case-study based questions and important diagram-based problems found in Statistics For Economics Chapter 4 Presentation Of Data.
Practicing topicw wise assignments will help Class 11 students understand every sub-topic of Statistics For Economics Chapter 4 Presentation Of Data. Daily practice will improve speed, accuracy and answering competency-based questions.
Yes, all printable assignments for Class 11 Economics Statistics For Economics Chapter 4 Presentation Of Data are available for free download in mobile-friendly PDF format.