
Read and download the CBSE Class 11 Economics Correlation Assignment for the 2026-27 academic session. We have provided comprehensive Class 11 Economics school assignments that have important solved questions and answers for Statistics For Economics Chapter 6 Correlation. These resources have been carefuly prepared by expert teachers as per the latest NCERT, CBSE, and KVS syllabus guidelines.
Solved Assignment for Class 11 Economics Statistics For Economics Chapter 6 Correlation
Practicing these Class 11 Economics problems daily is must to improve your conceptual understanding and score better marks in school examinations. These printable assignments are a perfect assessment tool for Statistics For Economics Chapter 6 Correlation, covering both basic and advanced level questions to help you get more marks in exams.
Statistics For Economics Chapter 6 Correlation Class 11 Solved Questions and Answers
Points to Remember
* Meaning of correlation :
Correlatin is a statistical tool which studies the relationship between two variables. For e.g. change in price leads to change in quantity demanded.
* Correlation studies and measures the direction and intensity of relationship among variables. It measures covariation not causation.
* Types of Correlation
Correlation is classified into positive and negative correlation.
The correlation is said to be positive when the variables move together in the same direction. For e.g. sale of Ice cream and temperature move in same direction.
The correlation is said to be negative when the variables move in opposite direction. For e.g. When you spend more time in studying chances of your failing decline.
* Examples of positive correlation are :
1. Price of commodity and amount of supply
2. Increase in height and weight.
3. Age of husband and age of wife.
4. The family income and expenditure on luxury items.
Examples of negative correlation are :
1. Sale of woollen garments and day temperature.
2. Demand of a commodity may go down as a result of rise in prices.
3. Yield of crops and price.
* Degree of Correlation :

* Methods of estimating correlation.
(a) Scatter diagram
(b) Karl pearson’s coefficient of correlation.
(c) Spearman’s rank correlation.
-- Scatter diagram offers a graphic expression of the direction and degree of correlation.
-- Karl pearson’s coefficient of correlation is a quantitative method of calculating correlation. It gives a precise numerical value of the
degree of linear relationship between two variables.
-- Karl pearson’s coefficient of correlation is also known as product moment correlation.

Here,
r = Coefficient of correlation
x = (X - X)
y = (Y - Y)
σx = Standard deviation of
X - series
σy = Standard deviation of
Y- Series
N = Number of observations
Karl pearson’s coefficient of correlation is calculated by following methods : 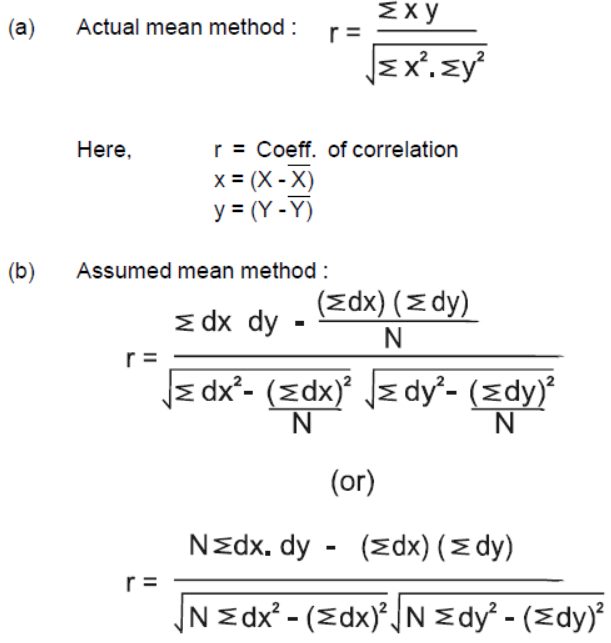
Here,
∑dx = Deviations of x- series from assumed mean = (X-A)
∑dy = Deviation of Y- series from assumed mean = (Y-A)
∑dx.dy = Sum of the multiple of dx and dy
∑dx2 = Sum of the square of dx
∑dy2 = Sum of the square of dy
∑dx = Sum of the deviation of x- series
∑dy = Sum of the deviation of Y-series
N = Number of pairs of observations
(c) Step deviation method : 
C1 is common factor for series - x
C2 is common factor for series - y
* Properties of correctation coefficient (r)
(i) Correlation coefficient (r) has no unit
(ii) A negative value of r indicates an inverse relation.
(iii) If r is positive then two variables move in the same direction.
(iv) The value of r lies between minus one (1) and plus one,
-1 ≤ r ≤ 1
(v) If r is zero, the two variables are uncorrelated.
(vi) If r = +1 or r= -1, the correlation is perfect.
(viii) A high value of r indicates strong linear relationship and a low value or r indicates a weak linear relationship.
(viii) The value of r is unaffected by the change of origin and change of scale.
Given two variables x and y let us define two new variables
U = X - A/B ; V = Y - C/D
Here A and C are assumed means of X and Y respectively. B and D are common factors. They rxy = ruv
-Spearman’s rank correlation method is used to calculate coefficient of correlation of qualitative variables such as beauty, bravery, wisdom, ability, virtue etc. 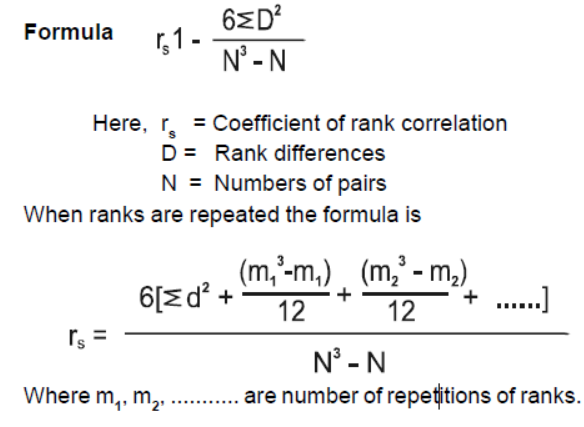
VERY SHORT ANSWER TYPE QUESTIONS
Question. What is meant by correlation?
Answer: Correlation is a statistical tool which studies the relationship between two variables.
Question. List some variables where accurate measurement is difficult.
Answer: Beauty, bravery, wisdom, ability etc.
Question. What is negative correlation?
Answer: The correlation is said to be negative when the variables move in opposite direction.
Question. Give the meaning of positive correlation.
Answer: The correlation is said to be positive when the variables move together in the same direction.
Question. What is the range of simple correlation coefficient?
Answer: - 1 ≤ r ≤ 1
Question. State the type of correlation when two variables change in the same ratio.
Answer: Perfect correlation.
Question. Give two examples of positive correlation?
Answer: (i) Age of husband and age of wife.
(ii) Increase in height and weight.
Question. Mention the principal short coming of scatter diagram as a method of estimating correlation.
Answer: Scatter diagram does not indicate the exact numerical value of correlation.
Question. Give two examples of negative correlation.
Answer: (i) Sale of wollen garments and day temperature.
(ii) Yield of crops and price.
Question. When is rank correlation method used?
Answer: When data are of qualitative nature like beauty, honesty etc.
Question. Mention the names of different methods for measuring correlation.
Answer: (i) Scatter diagram
(ii) Karl pearson’s coefficient of correlation.
(iii) Spearman’s Rank correlation.
Question. What is the main demerit of spearman’s rank method?
Answer: This method can not be employed for finding out correlation in a grouped frequency distribution.
Question. Mention the principal short coming of Karl Pearson’s coefficient of correlation.
Answer: The value of the coefficient is affected by extreme items.
Question. If rxy = 0, then the variables x and y are
(i) Linearly related
(ii) not linearly related
(iii) Independent
Answer: Independent
Question. The unit of correlation coefficient between height in feet and weight in kilograms is
(i) kg / feet
(ii) percentage
(iii) non- existent
Answer: Non - existent
Question. Which method of measuring correlation measures any type of relationship?
Answer: Karl Pearson’s coefficient of correlation.
Free study material for Economics
CBSE Class 11 Economics Statistics For Economics Chapter 6 Correlation Assignment
Access the latest Statistics For Economics Chapter 6 Correlation assignments designed as per the current CBSE syllabus for Class 11. We have included all question types, including MCQs, short answer questions, and long-form problems relating to Statistics For Economics Chapter 6 Correlation. You can easily download these assignments in PDF format for free. Our expert teachers have carefully looked at previous year exam patterns and have made sure that these questions help you prepare properly for your upcoming school tests.
Benefits of solving Assignments for Statistics For Economics Chapter 6 Correlation
Practicing these Class 11 Economics assignments has many advantages for you:
- Better Exam Scores: Regular practice will help you to understand Statistics For Economics Chapter 6 Correlation properly and you will be able to answer exam questions correctly.
- Latest Exam Pattern: All questions are aligned as per the latest CBSE sample papers and marking schemes.
- Huge Variety of Questions: These Statistics For Economics Chapter 6 Correlation sets include Case Studies, objective questions, and various descriptive problems with answers.
- Time Management: Solving these Statistics For Economics Chapter 6 Correlation test papers daily will improve your speed and accuracy.
How to solve Economics Statistics For Economics Chapter 6 Correlation Assignments effectively?
- Read the Chapter First: Start with the NCERT book for Class 11 Economics before attempting the assignment.
- Self-Assessment: Try solving the Statistics For Economics Chapter 6 Correlation questions by yourself and then check the solutions provided by us.
- Use Supporting Material: Refer to our Revision Notes and Class 11 worksheets if you get stuck on any topic.
- Track Mistakes: Maintain a notebook for tricky concepts and revise them using our online MCQ tests.
Best Practices for Class 11 Economics Preparation
For the best results, solve one assignment for Statistics For Economics Chapter 6 Correlation on daily basis. Using a timer while practicing will further improve your problem-solving skills and prepare you for the actual CBSE exam.
FAQs
You can download free PDF assignments for Class 11 Economics Statistics For Economics Chapter 6 Correlation from StudiesToday.com. These practice sheets have been updated for the 2026-27 session covering all concepts from latest NCERT textbook.
Yes, our teachers have given solutions for all questions in the Class 11 Economics Statistics For Economics Chapter 6 Correlation assignments. This will help you to understand step-by-step methodology to get full marks in school tests and exams.
Yes. These assignments are designed as per the latest CBSE syllabus for 2026. We have included huge variety of question formats such as MCQs, Case-study based questions and important diagram-based problems found in Statistics For Economics Chapter 6 Correlation.
Practicing topicw wise assignments will help Class 11 students understand every sub-topic of Statistics For Economics Chapter 6 Correlation. Daily practice will improve speed, accuracy and answering competency-based questions.
Yes, all printable assignments for Class 11 Economics Statistics For Economics Chapter 6 Correlation are available for free download in mobile-friendly PDF format.