
Read and download the CBSE Class 12 Informatics Practices Data Handling using Pandas Assignment Set 02 for the 2026-27 academic session. We have provided comprehensive Class 12 Informatics Practices school assignments that have important solved questions and answers for Chapter 02 Data Handling using Pandas I. These resources have been carefuly prepared by expert teachers as per the latest NCERT, CBSE, and KVS syllabus guidelines.
Solved Assignment for Class 12 Informatics Practices Chapter 02 Data Handling using Pandas I
Practicing these Class 12 Informatics Practices problems daily is must to improve your conceptual understanding and score better marks in school examinations. These printable assignments are a perfect assessment tool for Chapter 02 Data Handling using Pandas I, covering both basic and advanced level questions to help you get more marks in exams.
Chapter 02 Data Handling using Pandas I Class 12 Solved Questions and Answers
TOPIC – SERIES
Question. Create a series and print those elements which are divisible by 5
Answer: import pandas as pd
s1 = pd.Series([10, 21, 33, 14, 15])
print(s1)
for i in range(5):
if s1[i]%5==0:
print(s1[i])
Question. Create a series and print those elements which are multiples of 2.
Answer: import pandas as pd
s1 = pd.Series([10, 21, 33, 14, 15])
print(s1)
for i in range(5):
if s1[i]%2==0:
print(s1[i])
Question. Create a series such that data elements are twice that of index
Answer: import pandas as pd
import numpy as np
a=np.arange(1,5)
print(a)
ab=pd.Series(index=a,data=a*2)
print(ab)
Question. Print the even positions of numpy_series
Answer: import pandas as pd
array = np.arange(10,15)
numpy_series = pd.Series(array,index = [‘np1′,’np2′,’np3′,’np4′,’np5’])
Print the even positions of numpy_series
print(numpy_series[::2])
Question. Write program for multiplication of two series
Answer: import pandas as pd
Series1 = pd.Series([11,12,13,14,15])
Series2 = pd.Series([1,2,3,4,5])
Mul_series = Series1 * Series2
print(‘Series 1:-‘)
print(Series1)
print()
print(‘Series 2:-‘)
print(Series2)
print()
print(‘Multiplication: Series 1 * Series 2:-‘)
print(Mul_series)
Question. Write code to find the mean of all the elements in the Series
Answer: import pandas as pd
import numpy as np
dict1 = {‘Sachin’: 121, ‘Sourav’:100, ‘Dhoni’: 99, ‘Dravid’: 66, ‘Virat’: 75}
dict_series1 = pd.Series(dict1)
print(dict_series1.mean()) #MEAN – Aggregate Function.
Question. If s = pd.Series([‘a’,’b’,’c’,’d’,’e’]) is a series then what will be the output of the following:
print(s.iloc[:2])
print(s.iloc[2:3])
Answer: 0 a
1 b
dtype: object
2 c
dtype: object
Question. Print numpy series from np1 to np4 with a step of 2.
import pandas as pd
import numpy as np
array = np.arange(10,15)
s = pd.Series(array,index =[‘np1′,’np2′,’np3′,’np4′,’np5’])
Answer: print(s[‘np1’: ‘np4’:2])
Question. Write program for division of two series
Answer: import pandas as pd
import numpy as np
Series1 = pd.Series([11,12,13,14,15])
Series2 = pd.Series([1,2,3,4,5])
IntDivide_series = Series1 // Series2
print(‘Series 1:-‘,Series1)
print()
print(‘Series 2:-‘,Series2)
print()
print(‘Integer Division : Series 1 // Series 2:-‘)
print(IntDivide_series)
Question. Write code to compare two series.
Answer: import pandas as pd
ds1 = pd.Series([2, 4, 6, 8, 10])
ds2 = pd.Series([1, 3, 5, 7, 10])
print(“Series1:”,ds1)
print(“Series2:”,ds2)
print(“Compare the elements of the said Series:”)
print(“Equals:”)
print(ds1 == ds2)
print(“Greater than:”)
print(ds1 > ds2)
print(“Less than:”)
print(ds1 < ds2)
TOPIC – DATAFRAME
Consider the following Data Frames:
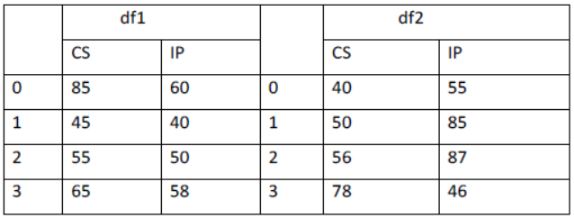
Write the commands to do the following operations on the Data Frames given below:
Question. To create the Data Frames df1 and df2.
Answer: Hint- df1=pd.DataFrame({‘CS’:[85,45,55,65],’IP’:[60,40,50,58]})
Question. To add Data Frame df1 and df2.
Answer: Hint- df1.add(df2)
Question. To subtract Data Frame df2 from df1.
Answer: Hint- df1.sub(df2)
Question. To replace all NAN’s in Data Frame df1 to ‘No Value’.
Answer: Hint- df1.fillna(‘No Value’)
Question. To Write a command in python to Print the total number of records in the DataFrame df1.
Answer: Hint- print(df1.count())
Question. To Find the total of all the values of CS column in DataFrame df1.
Answer: Hint- df1[‘CS’].sum()
Question. To Rename column CS as ComputerSc in Data Frame df1.
Answer: Hint- df1.rename(columns={‘CS’:’ComputerSc’})
Question. To add a new column Total in Data Frame df1 whose value is equal to the total of both the existing columns values.
Answer: Hint- df1[‘Total’]=df1[‘CS’]+df1[‘IP’]
Question. To change the index of Dta Frame df2 from 0,1,2,3 to a,b,c,d
Answer: Hint- df2.rename(index={0:’a’,1:’b’,2:’c’,3:’d’})
Question. To display those rows in Data Frame df1 where value of CS column is more than 45.
Answer: Hint- print(df1[df1[‘CS’]>45])
TOPIC – DataFrame : export and import to and from csv file
Question. If we export DataFrame with separator other than comma than which one of the following is true?
a) While importing back it merges the columns
b) While importing back it gets imported as it was
c) We cannot export DataFrame with separator other than comma
d. None of these
Answer: A
Question. A DataFrame df1 is exported using the command ‘df1.to_csv(‘file1.csv)’ now if we import back into a DataFrame then it will ______
a) have an ‘unknown column’
b) not have ‘Unknown column’
c) be imported as it was
d) The DataFrame cannot be exported by the given command
Answer: A
Question. A DataFrame df1 is exported using the command ‘df1.to_csv(‘file1.csv)’ now the csv file will be created (location) ______
Answer: In the current folder(The folder where the python program located)Question. Suppose we want to export a DataFrame ‘df1’ to the csv file ‘data1.csv’ in a folder ‘mycsv’ under drive ‘D’ without index. Please write the export command.
Answer: df1.to_csv(r’d:\mycsv\data1.csv’, index=False) or df1.to_csv(’d:/mycsv/data1.csv’, index=False)
Question. Write a python program to export the following DataFrame to the csv file ‘csvfile.csv’ in current folder without the index and column names of the DataFrame.
designation salary
0 manager 25000
1 clerk 16000
2 salesman 12000
Answer: d={‘Designation’:[‘manager’,’clerk’,’salesman’]
,’Salary’:[25000,16000, 12000]}
df=pd.DataFrame(d)
df.to_csv(‘csvfile.csv’, index= False, header=False)
Question. A DataFrame having two columns is exported to the csv file ‘csvfile.csv’ without index and column name in the current folder. Write a python program to import the file into a DataFrame with column names as ‘col1’ and ‘col2’ and display that.
Answer: import pandas as pd
df1=pd.read_csv(‘csvfile.csv’, names=[‘col1’, ‘col2’])
print(df1)
Question. Write a python program to import data from two csv files ‘file1.csv’ and ‘file2.csv’ and export them to a single csv file ’file3.csv’. All files are in current folder and are exported without index
Answer: import pandas as pd
df1=pd.read_csv(‘file1.csv’)
df2=pd.read_csv(‘file2.csv’)
df3=df1.append(df2)
df3.to_csv(‘file3.csv’, index= False)
Question. The following DataFrame ‘df1’ is exported using the command ‘df.to_csv(‘file1.csv’, index=False, header=False)’. Now write the output of the given python program.
designation salary
0 manager 20000
1 clerk 17000
2 salesman 15000
3 director 30000
import pandas as pd
df1=pd.read_csv(‘file1.csv’,names=[‘xyz’, ‘abc’])
print(df1)
Answer:
xyz abc
0 manager 20000
1 clerk 17000
2 salesman 15000
3 director 30000
Question. The following DataFrame‘df1’ is exported using the command ‘df.to_csv(‘file1.csv’, index=False)’. Now write the output of the given python program.
xyz abc
0 manager 20000
1 clerk 17000
2 salesman 15000
import pandas as pd
df1=pd.read_csv(‘file1.csv’, header=None)
print(df1)
Answer:
0 1
0 manager 20000
1 clerk 15000
2 salesman 22000
Question. Write a python program to export the following DataFrame to the csv file ‘csvfile.csv’ in current folder without the index of the DataFrame.
designation salary
0 manager 25000
1 clerk 16000
2 salesman 12000
Answer:
import pandas as pd
d={‘Designation’:[‘manager’,’clerk’,’salesman’] ,
‘Salary’:[25000,16000, 12000]}
df=pd.DataFrame(d)
df.to_csv(‘csvfile.csv’, index= False)
TOPIC – Data Visualisation
Question. The matplotlib Python library developed by ……………………… .
Answer: John Hunter.
Question. ………………… is a module in the matplotlib package.
Answer: Pyplot
Question. The matplotlib API is imported using …………………. .
Answer: Import
Question. The ……………………. is bounding box with ticks and labels.
Answer: Axes
Question. The ……………………. Can be plotted vertically or horizontally.
Answer: Bar chart
Question. Mr Manjeet want to plot a bar graph for the given set of values of subjects on x-axes and number of students who opted for the that subject on y-axes. Complete the code to perform the following operations:
a. To plot the bar graph in statement 1
b. To display the bar graph in statement 2
import matplotlib.pyplot as plt
x= [“Hindi”, “English”, “Maths”, “Science”]
y=[30,40,50,45]
………………… #statement 1
………………… #statement 2
Answer: a) plt.bar(x,y)
b) plt.show()
Question. Mr. Hamid wants to draw a line chart using a list of elements named Mylist. Complete the code to perform the following operations:
a. To plot a line chart using the given list Mylist.
b. To give a y-axes label to the line chart named Sample number.
import matplotlib.pyplot as plt
Mylist=[40,50,60,70,80,90]
……………………. # statement 1
……………………. # statement 2
plt.show()
Answer: a) plt.plot(Mylist)
b) plt.ylabel(“Sample number”)
Question. Write a Python program to draw a line using given axis values with suitable label in the x axis , y axis and a title.
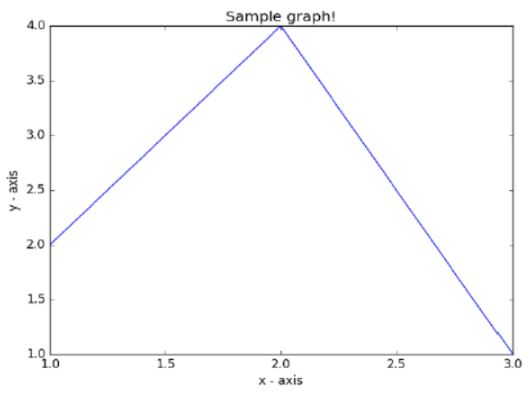
Answer: import matplotlib.pyplotas plt
x =[1,2,3]
y =[2,4,1]
plt.plot(x, y)
plt.xlabel(‘x – axis’)
plt.ylabel(‘y – axis’)
plt.title(‘Sample graph!’)
plt.show()
Question. What is the use of histtype attribute of hist() function of histogram? Mention and explain all it possible values.
Answer: histtype attribute is used to draw different types of histogram.
The type of histogram to draw.
a. ‘bar’ is a traditional bar-type histogram. If multiple data are given the bars are arranged side by side.
b. ‘barstacked’ is a bar-type histogram where multiple data are stacked on top of each other.
c. ‘step’ generates a lineplot that is by default unfilled.
d. ‘stepfilled’ generates a lineplot that is by default filled.
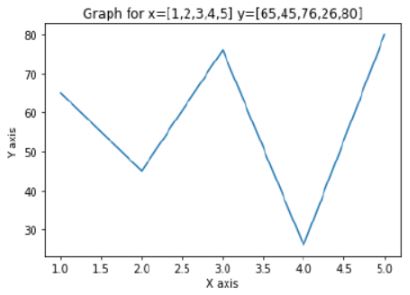
Question. Write a Python Program to plot line chart for values
x = [1,2,3,4,5]y=[65,45,76,26,80]
Answer: import matplotlib.pyplot as plt
import numpy as np
x=[1,2,3,4,5]
y=[65,45,76,26,80]
plt.plot(x,y)
plt.xlabel(“X axis”)
plt.ylabel(“Y axis “)
plt.title(“Graph for x=[1,2,3,4,5] y=[65,45,76,26,80]”)
plt.show()
#it will look like:
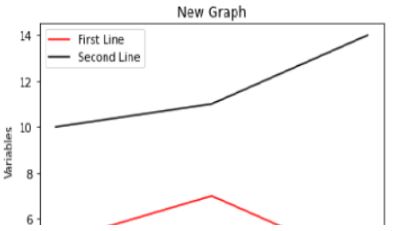
Question. To add legends, titles and labels to a line plot with multiple lines.
Answer: import matplotlib.pyplot as plt
x=[1,2,3]
y=[5,7,4]
plt.plot(x,y,label=’First Line’,color=’red’)
x2=[1,2,3]
y2=[10,11,14]
plt.plot(x2,y2,label=’Second Line’,color=’black’)
plt.xlabel(‘Plot Number’)
plt.ylabel(‘Variables’)
plt.title(‘New Graph’)
plt.legend()
plt.show()
#it will look like
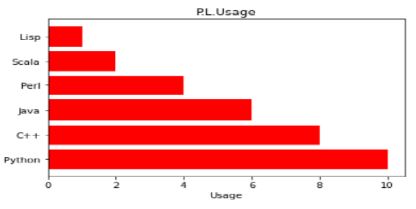
Question. Write a Python Program to plot a bar chart horizontally
Answer: import matplotlib.pyplot as plt
import numpy as np
ob=(‘Python’,’C++’,’Java’,’Perl’,’Scala’,’Lisp’)
y_pos=np.arange(len(ob))
performance=[10,8,6,4,2,1]
plt.barh(y_pos,performance,align=’center’,color=’r’)
plt.yticks(y_pos,ob)
plt.xlabel(“Usage”)
plt.title(‘P.L.Usage’)
plt.show()
#it will look like:
Question. Write the code for given bar chart:
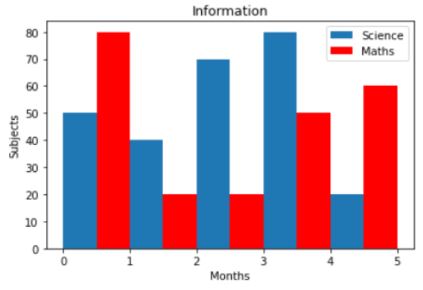
Answer: import matplotlib.pyplot as plt
plt.bar([0.25,1.25,2.25,3.25,4.25],[50,40,70,80,20],label=”Science”, width=.5)
plt.bar([0.75,1.75,2.75,3.75,4.75],[80,20,20,50,60],label=”Maths”,color=’r’,width=.5)
plt.legend()
plt.xlabel(“Months”)
plt.ylabel(“Subjects”)
plt.title(“Information”)
plt.show()
Question. Are bar charts and histograms the same?
Answer: No bar chart and histogram are not the same.
A bar chart has categories of data whereas histogram has number ranges.
The bar in bar chart has gap in between but the bins(bars) of histogram have no gap as number ranges are continuous.
Question. When should you create histograms and when should you create bar charts to present data visually?
Answer: Bar charts should be created when data is categorised. For example if the data consists of average expenditure in each month.
Histogram should be created when data is continuous. For instance if we have to plot the frequency of number between number range in an array. Histogram do not have the gaps between their bars.
Question. Write a program to create histogram that plot two ndarray x and y with 48 bins, in stacked horizontal histogram.
Answer: import matplotlib.pyplot as plt
x=[78,72,69,81,63,67,65,75,79,74,71,83,71,79,83,63]
y=[84,77,91,87,69,78,69,89,87,79,79,89,81,98,89,69]
plt.hist([x,y], bins=24, histtype=’barstacked’, cumulative=True, orientation=’horizontal’)
plt.show()
Write code to add title and axis titles to code of Question 22
import matplotlib.pyplot as plt
x=[78,72,69,81,63,67,65,75,79,74,71,83,71,79,83,63]
y=[84,77,91,87,69,78,69,89,87,79,79,89,81,98,89,69]
plt.hist([x,y], bins=24, histtype=’barstacked’, cumulative=True, orientation=’horizontal’)
plt.title(“Stackedbar Histogram”)
plt.xlable(“X-axis”)
plt.ylable(“Y-axis”)
plt.show()
Question. What is cumulative histogram? How do you create it using pyplot?
Answer: A cumulative histogram just keep adding its previous values to its present value. It is sum of all the previous bars plus its present bar in a normal histogram. A cumulative histogram is always increasing. For example if we want to know the number of cars sold till 1990,we can use cumulative histogram rather than adding all the bars together.
The argument cumulative = true is used to create cumulative histograms using pyplot. e.g.
plt.hist(x. bins=30, cumulative=true)
Question. Write a statement to plot a cumulative histogram of stacked bar type for ndarray x and y.
Answer: plt.hist( [x,y], histtype = ‘barstacked’, cumulative = True)
Question. Seema want to plot a cumulative histogram, he write following code:
import matplotlib.pyplot as plt
sale=[68,75,78,74,81,82,71,79,74,81,78,72]
plt.hist( sale, cumulative = False)
plt.show()
Above code didn’t show the cumulative histogram. What changes should Seema make?
Answer: import matplotlib.pyplot as plt
sale=[68,75,78,74,81,82,71,79,74,81,78,72]
plt.hist(sale, cumulative = True)
plt.show()
Question. Write a program to create a histogram for data=[1,11,15,21,31,33,35,37,41] and bins =[0,10,20,30,40,50,60] color of bars should yellow with red edge color.
Answer: import matplotlib.pyplot as plt
data=[1,11,15,21,31,33,35,37,41]
plt.hist(data,bins=[0,10,20,30,40,50,60], edgecolor=”red”, facecolor=’Yellow’)
plt.show()
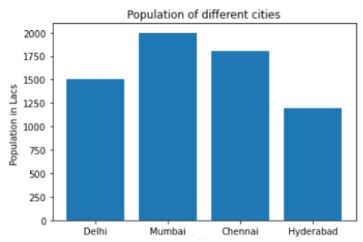
Question. Write a Python Program to Plot a bar chart for values cities and population.
Answer: import matplotlib.pyplot as plt
import numpy as np
city=[‘Delhi’,’Mumbai’,’Chennai’,’Hyderabad‘]
p=[1500,2000,1800,1200]
plt.bar(city,p)
plt.xlabel(“City”)
plt.ylabel(“Population in Lacs “)
plt.title(“Population of different cities”)
plt.show()
#it will look like:
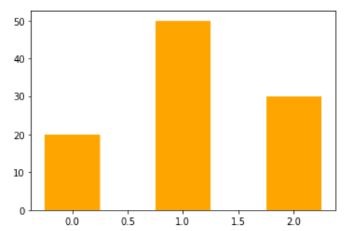
Question. Write a Python Program to plot a bar chart with width.
Answer: import matplotlib.pyplot as plt
import numpy as np
y_axis=[20,50,30]
x_axis=range(len(y_axis))
plt.bar(x_axis,y_axis,width=.5,color=’orange’)
plt.show()
#it will look like:\
Free study material for Informatics Practices
CBSE Class 12 Informatics Practices Chapter 02 Data Handling using Pandas I Assignment
Access the latest Chapter 02 Data Handling using Pandas I assignments designed as per the current CBSE syllabus for Class 12. We have included all question types, including MCQs, short answer questions, and long-form problems relating to Chapter 02 Data Handling using Pandas I. You can easily download these assignments in PDF format for free. Our expert teachers have carefully looked at previous year exam patterns and have made sure that these questions help you prepare properly for your upcoming school tests.
Benefits of solving Assignments for Chapter 02 Data Handling using Pandas I
Practicing these Class 12 Informatics Practices assignments has many advantages for you:
- Better Exam Scores: Regular practice will help you to understand Chapter 02 Data Handling using Pandas I properly and you will be able to answer exam questions correctly.
- Latest Exam Pattern: All questions are aligned as per the latest CBSE sample papers and marking schemes.
- Huge Variety of Questions: These Chapter 02 Data Handling using Pandas I sets include Case Studies, objective questions, and various descriptive problems with answers.
- Time Management: Solving these Chapter 02 Data Handling using Pandas I test papers daily will improve your speed and accuracy.
How to solve Informatics Practices Chapter 02 Data Handling using Pandas I Assignments effectively?
- Read the Chapter First: Start with the NCERT book for Class 12 Informatics Practices before attempting the assignment.
- Self-Assessment: Try solving the Chapter 02 Data Handling using Pandas I questions by yourself and then check the solutions provided by us.
- Use Supporting Material: Refer to our Revision Notes and Class 12 worksheets if you get stuck on any topic.
- Track Mistakes: Maintain a notebook for tricky concepts and revise them using our online MCQ tests.
Best Practices for Class 12 Informatics Practices Preparation
For the best results, solve one assignment for Chapter 02 Data Handling using Pandas I on daily basis. Using a timer while practicing will further improve your problem-solving skills and prepare you for the actual CBSE exam.
FAQs
You can download free PDF assignments for Class 12 Informatics Practices Chapter 02 Data Handling using Pandas I from StudiesToday.com. These practice sheets have been updated for the 2026-27 session covering all concepts from latest NCERT textbook.
Yes, our teachers have given solutions for all questions in the Class 12 Informatics Practices Chapter 02 Data Handling using Pandas I assignments. This will help you to understand step-by-step methodology to get full marks in school tests and exams.
Yes. These assignments are designed as per the latest CBSE syllabus for 2026. We have included huge variety of question formats such as MCQs, Case-study based questions and important diagram-based problems found in Chapter 02 Data Handling using Pandas I.
Practicing topicw wise assignments will help Class 12 students understand every sub-topic of Chapter 02 Data Handling using Pandas I. Daily practice will improve speed, accuracy and answering competency-based questions.
Yes, all printable assignments for Class 12 Informatics Practices Chapter 02 Data Handling using Pandas I are available for free download in mobile-friendly PDF format.