
Read and download free pdf of CBSE Class 11 Economics Organisation and Presentation of Data Assignment. Get printable school Assignments for Class 11 Economics. Class 11 students should practise questions and answers given here for Statistics For Economics Chapter 3 Organisation Of Data Economics in Class 11 which will help them to strengthen their understanding of all important topics. Students should also download free pdf of Printable Worksheets for Class 11 Economics prepared as per the latest books and syllabus issued by NCERT, CBSE, KVS and do problems daily to score better marks in tests and examinations
Assignment for Class 11 Economics Statistics For Economics Chapter 3 Organisation Of Data
Class 11 Economics students should refer to the following printable assignment in Pdf for Statistics For Economics Chapter 3 Organisation Of Data in Class 11. This test paper with questions and answers for Class 11 Economics will be very useful for exams and help you to score good marks
Statistics For Economics Chapter 3 Organisation Of Data Class 11 Economics Assignment
* Key paints :
organisation of data refers to the systematic arrangement of figures in such a form that comparison of masses of similar data may be facilitated and further analysis may be possible.
* Classification is the grouping of related facts into different classes. 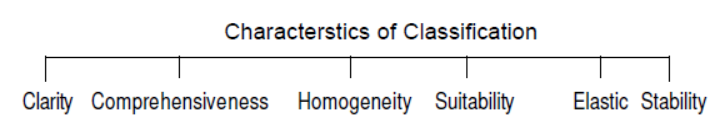
* Variable is a characteristic or a phenomenon which is capable of being measured and changes its value overtime.
* Frequency is number of times on item repeats itself in the series.
* Continuous variables are those variables that increase continuously or in fraction.
* A mass of data collected by investigator in its crude form called raw data. It is an unorganised mass of the various items.
* Both the lower limit and the upper limit of a class - interval are included in that class itself called inclusive series.
* When the class intervals are so fixed that the upper limit of one class - interval is the lower limit of the next class interval, it is called an exclusive series.
* The method of arranging data orderly in form of raws and columns is known as tabulation. 
Features of a good table
* Compatible title
* Helpful in comparisian.
* Ideal size
* Stubs
* Clearification of units.
* Percenage and ratio.
* Source simple.
* Bar diagrams are those diagrams in which data are presented in the form of bars and rectangles.
* Utility / Merits of Diagrammatic Presentation.
1. Make simple to compare data
2. Attractive and eye catchers.
3. Longterm memorising effect.
4. Useful in comparative / relative study.
* Sub divided bar diagrams are those diagrams Which present simultaneously, total values and parts there in a set of a data.
* Pie or circuler diagram is a circle divided into various segment showing the percent value of a series.
* Histogram is graphical presentation of a frequency distribution of a continuous series.
* Frequency polygon is drawn by joining the mid points of the tops of rectangles in a histogram.
* Frequecy curve is obtained by joining the points of a frequecy polygon through free hand smoothed curves not by straight lines.
* Cumulative frequency curves or ogive curve is the curve which is constructed by plotting cumulative frequency data on the graph
paper in the form of a smooth curve.
1 Marks Questions
Question. What is meant by organisation of data?
Answer: Organisation of data refers to the systematic arrangement of figures in such a form that comparison of masses of similar data may be facilitated and further analysis may be possible.
Question. State the meaning of classification.
Answer: Classification is the grouping of related facts into different classes.
Question. What is meant by homogeneity of data?
Answer: The similarity of features of all the units of a class called homoginity.
Question. State the meaning of qualitative classification.
Answer: The classification according to qualities or attributes of the data called qualitative classification.
Question. Define raw data.
Answer: A mass of data in its crude form is called raw data. It is an unorganised mass of the various items.
Question. Define discrete series or frequency array.
Answer: A discrete series of frequency array is that series in which data are presented in a way that exact measurement of items are clearly shown.
Question. What is meant by exclusive series?
Answer: When the class intervals are so fixed that the upper limit of one class interval is the lower limit of the next class interval it is called an exclusive series.
Question. Write the name of the series which include all items up to its upper limit.
Answer: Inclusive series.
Question. What is meant by frequency?
Answer: Frequency is number of times an item repeats itself in the series.
Question. State the meaning of class intervals.
Answer: The class intervals are the lowest and highest values that can be included in the class.
Question. What is meant by tabulation?
Answer: The method of arranging data orderly in form of raws and columns is known as tabulation.
Question. Define caption as a part of table.
Answer: Caption is the title given to the columns of a table. It indicate information contained in the columns.
Question. What is meant by manifold table?
Answer: Manifold table shows more than three characteristics of the data.
Question. Define bar diagrams.
Answer: Bar diagrams are those diagrams in which data are presented in the form of bars and rectangles.
Question. State the meaning of sub-divided bar diagrams.
Answer: Sub divided bar diagrams are those diagrams in which more than one data are presented simultaneously, total values and parts there in a set of data.
Question. Define pie-diagram.
Answer: Pie diagram is a circle divided into various sagement showing the percent value of a series.
Question. What is meant by histogram?
Answer: Histogram is a graphical presentation of a frequency distribution of a continuous series.
Question. State the meaning of frequency curve.
Answer: Frequency curve is obtained by joining the points of a frequency polygan through freehand smoothed curves not by straight lines.
Question. Write the name of the curve which is formed by joining mid point of the top of all rectangles in a histogram.
Answer: Frequency polygon.
Question. Difine the ogive curve.
Answer: It is the curve which is constructed by plotting cumulative frequency data on the graph paper in a form of a smooth curve.
Question. What is meant by false base line.
Answer: When there is a large gap between zero and minimum value of a variable than to minimise this gap we use false base line.
Multiple Choice Questions
Question. Census of India depicting birth rate over last decade is an example of
(a) geographical classification
(b) chronological classification
(c) qualitative classification
(d) quantitative classification
Answer : B
Question. Bi-variate frequency distributions are also known as ……… .
(a) Two-way table
(b) Two-way series
(c) Multiple frequency distribution
(d) None of the above
Answer : D
Question. If we add frequencies one by one to the previous frequency in an ascending order of the magnitude of the frequency distribution, we get
(a)more than cumulative frequency distribution
(b) less than cumulative frequency distribution
(c) bi-variate frequency distribution
(d) multi-variate frequency distribution
Answer : A
Question. Classification of data that can represent two or more variables is known as
(a) Two-classification
(b) Manifold classification
(c) Both (a) and (b)
(d) Neither (a) nor (b)
Answer : B
Question. Observe the series given, 0-10, 10-15, 15-30, 30-50. Identity the type of series in the given example.
(a) Exclusive and open ended
(b) Exclusive and unequal
(c) Inclusive and open ended
(d) Inclusive and unequal
Answer : B
Question. Uni-variate frequency distributions are also known as ……… .
(a) One-way table
(b) Single table
(c) One-way frequency distribution
(d) All of the above
Answer : C
Question. Which of the following series can take only integral values?
(a) Individual series
(b) Discrete series
(c) Continuous series
(d) Both (a) and (b)
Answer : D
Question. Which of the following is not a frequency distribution?
(a) Cumulative
(b) Continuous
(c) Open ended
(d) None of these
Answer : D
Question. The difference between upper limit and lower limit of a class is known as
(a) Class frequency
(b) Class limits
(c) Class mid-point
(d) Class interval
Answer : D
Question. In more than cumulative frequency distribution, the series is arranged in ……… order.
(a) increasing
(b) decreasing
(c) constant
(d) None of the above
Answer : B
Question. In an inclusive series
(a) both class limits are considered.
(b) both class limits are excluded.
(c) upper limit is excluded.
(d) lower limit is excluded.
Answer : A
Question. Under ……… series, there is no frequency distribution as every number is unique.
(a) individual
(b) discrete
(c) continuous
(d) None of the above
Answer : A
Question. From the given data, find the number of students scoring 20 or more marks in Economics
Marks No. of Students
0-5 5
5-10 7
10-15 3
15-20 10
20-25 15
25-30 10
30-35 8
35-40 12
(a) 20
(b) 35
(c) 45
(d) 25
Answer : C
Assertion-Reasoning MCQs
Direction (Q.Nos. 56 to 60) There are two statements marked as Assertion (A) and Reason (R). Read the statements and choose the appropriate option from the options given below
(a) Both Assertion (A) and Reason (R) are true and Reason (R) is the correct explanation of Assertion (A)
(b) Both Assertion (A) and Reason (R) are true, but Reason (R) is not the correct explanation of Assertion (A)
(c) Assertion (A) is false, but Reason (R) is true
(d) Both are false
Question. Assertion (A) Classification facilitates grouping of data based upon similarities and dissimilarities.
Reason (R) Classification enables a person to compare various forms of data.
Answer : A
Question. Assertion (A) Bi-variate frequency distribution is a form of exclusive frequency distribution.
Reason (R) A form of presentation capable of representing more than two variables at a time is considered as bi-varite.
Answer : C
Question. Assertion (A) Classification of data using time dimensions has more accuracy as compare to other forms of classification.
Reason (R) Data can be presented, once it is classified as per the need of investigation.
Answer : C
Question. Assertion (A) Classification of data is required for further statistical analysis.
Reason (R) Classification helps in simplifying data and enhances understanding.
Answer : A
Question. Assertion (A) Attributes of a variable can vary from one investigator to another depending upon the method of statistical enquiry used.
Reason (R) Variables can take any value including integral and fractional values.
Answer : B
1. In an examination, 25 students secured the following marks:
23, 28, 30, 32, 35, 35, 36, 40, 41, 43, 44, 45, 45, 48, 49, 52, 53, 54, 56, 56, 58, 61, 62, 65, 68
Arrange these data in the form of frequency distribution using the following class intervals:
20- 29, 30- 39, 40- 49, 50- 59 & 60- 69
2. The following data is of the age of 25 students of class XI. Arrange these data in the form of frequency distribution.
15, 16, 16, 17, 18, 18, 17, 15, 15, 16, 16, 17, 15, 16, 15, 16, 16, 18, 15, 17, 17, 18, 10, 16, 15
3. Students of class XI obtained following marks in Economics. Classify the data in the form of discrete series & continuous series.
15, 15, 18, 16, 20, 21, 25, 25, 15, 16, 18, 22, 24, 25, 20, 18, 22, 24, 24, 25, 25, 23, 20, 15, 16, 17, 19, 18,22, 22.
4. Arrange the following data in the form of an exclusive frequency distribution, using 5- 10 as the initial class interval:
12, 36, 40, 30, 28, 20, 19, 10, 10, 19, 27, 15, 26, 10, 19, 7, 45, 33, 26, 37, 5, 20, 11, 17, 37, 30, 20.
5. Weight of 20 students is given in kgs. Using class interval of 5, make a frequency distribution:
Topic: - Significance of Statistics in Economics and collection of data.
Question 1: Would it be called Statistics if it is said that there are 2000 students in our school?
Question 2: Mention the two sources of secondary data.
Question 3: State the name of data which involves less time and expenses.
Question 4: Write three sentences highlighting the importance of Statistics in Economic planning.
Question 5: Out of primary and secondary data, which one is collected for a definite purpose.
Question 6: Name an important government agency which collects, process and tabulate data at national level.
Question 7: Statistics as a singular noun means:
a) Statistical data
b) Statistical methods
c) Inductive statistics
d) Descriptive statistics
Question 8: Statistics is the science of analysing:
a) Qualitative data
b) Quantitative data
c) Any kind of data
d) Both (a) and (b)
Question 9: Distrust of statistics is due to :
a) Misuse of statistics
b) Insufficient statistical methods
c) Scope of statistics is limited
d) Limitations of statistics
| CBSE Class 11 Economics Indian Economy on the Eve of Independence Assignment |
| CBSE Class 11 Economics Agriculture Assignment |
| CBSE Class 11 Economics Economic Reforms Since 1991 Assignment |
| CBSE Class 11 Economics Human Capital Formation in India Assignment |
| CBSE Class 11 Economics Rural Development Assignment |
| CBSE Class 11 Economics Growth Informalisation Assignment Set A |
| CBSE Class 11 Economics Growth Informalisation Assignment Set B |
| CBSE Class 11 Economics Environment and Sustainable Development Assignment Set A |
| CBSE Class 11 Economics Environment and Sustainable Development Assignment Set B |
| CBSE Class 11 Economics Environment and Sustainable Development Assignment Set C |
| CBSE Class 11 Economics Development Experience of India Assignment Set A |
| CBSE Class 11 Economics Development Experience of India Assignment Set B |
| CBSE Class 11 Economics Introduction Assignment |
| CBSE Class 11 Economics Collection of Data Assignment |
| CBSE Class 11 Economics Organisation and Presentation of Data Assignment |
| CBSE Class 11 Economics Presentation of Data Assignment |
| CBSE Class 11 Economics Measures Of Central Tendency Assignment |
| CBSE Class 11 Economics Correlation Assignment |
| CBSE Class 11 Economics Introduction to index numbers Assignment |
CBSE Class 11 Economics Statistics For Economics Chapter 3 Organisation Of Data Assignment
We hope you liked the above assignment for Statistics For Economics Chapter 3 Organisation Of Data which has been designed as per the latest syllabus for Class 11 Economics released by CBSE. Students of Class 11 should download and practice the above Assignments for Class 11 Economics regularly. We have provided all types of questions like MCQs, short answer questions, objective questions and long answer questions in the Class 11 Economics practice sheet in Pdf. All questions have been designed for Economics by looking into the pattern of problems asked in previous year examinations. You can download all Revision notes for Class 11 Economics also absolutely free of cost. Lot of MCQ questions for Class 11 Economics have also been given in the worksheets and assignments for regular use. All study material for Class 11 Economics students have been given on studiestoday. We have also provided lot of Worksheets for Class 11 Economics which you can use to further make your self stronger in Economics.
What are benefits of doing Assignment for CBSE Class 11 Economics Statistics For Economics Chapter 3 Organisation Of Data?
a. Score higher marks: Regular practice of Economics Class 11 Assignments for chapter Statistics For Economics Chapter 3 Organisation Of Data will help to improve understanding and help in solving exam questions correctly.
b. As per CBSE pattern: All questions given above follow the latest Class 11 Economics Sample Papers so that students can prepare as per latest exam pattern.
c. Understand different question types: These assignments include MCQ Questions for Class 11 Economics with answers relating to Statistics For Economics Chapter 3 Organisation Of Data, short answers, long answers, and also case studies.
d. Improve time management: Daily solving questions from Statistics For Economics Chapter 3 Organisation Of Data within a set time will improve your speed and accuracy.
e. Boost confidence: Practicing multiple assignments and Class 11 Economics mock tests for Statistics For Economics Chapter 3 Organisation Of Data reduces exam stress.
How to Solve CBSE Class 11 Economics Statistics For Economics Chapter 3 Organisation Of Data Assignment effectively?
a. Start with Class 11 NCERT and syllabus topics: Always read the chapter carefully before attempting Assignment questions for Class 11 Economics Statistics For Economics Chapter 3 Organisation Of Data.
b. Solve without checking answers: You should first attempt the assignment questions on Statistics For Economics Chapter 3 Organisation Of Data yourself and then compare with provided solutions.
c. Use Class 11 worksheets and revision notes: Refer to NCERT Class 11 Economics worksheets, sample papers, and mock tests for extra practice.
d. Revise tricky topics: Focus on difficult concepts by solving Class 11 Economics MCQ Test.
e. Maintain notebook: Note down mistakes in Statistics For Economics Chapter 3 Organisation Of Data assignment and read them in Revision notes for Class 11 Economics
How to practice CBSE Class 11 Economics Statistics For Economics Chapter 3 Organisation Of Data Assignment for best results?
a. Solve assignments daily: Regular practice of Statistics For Economics Chapter 3 Organisation Of Data questions will strengthen problem solving skills.
b.Use Class 11 study materials: Combine NCERT book for Class 11 Economics, mock tests, sample papers, and worksheets to get a complete preparation experience.
c. Set a timer: Practicing Class 11 Economics Statistics For Economics Chapter 3 Organisation Of Data assignment under timed conditions improves speed and accuracy.
You can download free Pdf assignments for CBSE Class 11 Economics Statistics For Economics Chapter 3 Organisation Of Data from StudiesToday.com
All topics given in Statistics For Economics Chapter 3 Organisation Of Data Economics Class 11 Book for the current academic year have been covered in the given assignment
No, all Printable Assignments for Statistics For Economics Chapter 3 Organisation Of Data Class 11 Economics have been given for free and can be downloaded in Pdf format
Latest syllabus issued for current academic year by CBSE has been used to design assignments for Statistics For Economics Chapter 3 Organisation Of Data Class 11
Yes, we have provided detailed answers for all questions given in assignments for Statistics For Economics Chapter 3 Organisation Of Data Class 11 Economics