
Access the latest CBSE Class 11 Economics Worksheet Set 07 Solved. We have provided free printable Class 11 Economics worksheets in PDF format, specifically designed for All Chapters. These practice sets are prepared by expert teachers following the 2025-26 syllabus and exam patterns issued by CBSE, NCERT, and KVS.
All Chapters Economics Practice Worksheet for Class 11
Students should use these Class 11 Economics chapter-wise worksheets for daily practice to improve their conceptual understanding. This detailed test papers include important questions and solutions for All Chapters, to help you prepare for school tests and final examination. Regular practice of these Class 11 Economics questions will help improve your problem-solving speed and exam accuracy for the 2026 session.
Download Class 11 Economics All Chapters Worksheet PDF
SECTION A
1. When Marginal Product curve coincides with X axis, Total Product:
A. Increases at a constant rate
B. Increases at a diminishing rate
C. Reaches maximum and constant
D. Reaches minimum and constant
2. A firm increases its output from 85 units to 90 units. As a result Total Variable Cost increases from Rs.180 to Rs. 200.What could be the Marginal Cost of Production of 90th unit.
3. Total Cost Curve and Total Variable Curve are parallel to each other. This is due to the fact that:
A. Total Cost remains constant as output increases.
B. Total Variable Cost remains constant as output increases
C. Average Cost remains constant as output increases
D. Total Fixed Cost remains constant as output increases
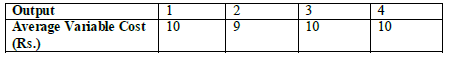
4. Consider the following schedule and assume the Average Fixed Cost of producing 3 units of output is Rs.5. Calculate Marginal Cost and Average Cost.
5. A firm is increasing the employment of a variable input keeping the employment of all other inputs constant. Explain the three stages of production that a firm has to undergo with suitable diagram.
SECTION B
6. Among Mean and Median which value is the most representative value of all observations?
7. Which one of the following represents spatial classification?
A. Distribution of population among various states of India.
B. ‘Census of India’ report on population between 1951 to 2011
C. Distribution of population into Male and Female
D. Distribution of population into various age group
8. How is a frequency curve different from frequency polygon?
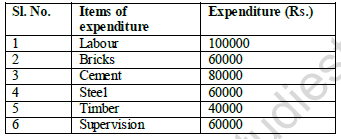
9. Construct a pie diagram from the following information regarding the cost of construction of a house in Mumbai.
10.Locate Median on a graph, estimate and verify the result using formula
![]()
VALUE POINTS
1. C. Reaches maximum and constant
2. Rs. 4
3. D. Total Fixed Cost remains constant as output increases
4.
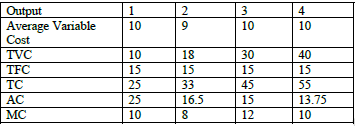
TFC=AFC x Q; 3 x 5 =15
AC=TC/Q; TC= TVC+TFC
MC = TCn-TCn-1
5. This reveals about the contribution of a single factor towards production. In this we vary the employment of only one factor keeping the employment of other factors other factors fixed. This states that MP initially increases with the increase in the employment of the input in question, then it diminishes and finally it becomes negative. This pattern of MP is called law of variable proportion. This law outlines three stages of production
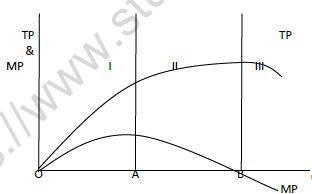
Stage I: When the level of employment of an input is sufficiently low, its MP increases; TP increases at an increasing rate. This stage ends at the point when MP reaches maximum. This stage is also known as the stage of increasing returns.
Stage II: MP diminishes but remains positive. TP will increase but at a diminishing rate. At the end of this stage MP is zero and TP reaches maximum and remain constant. This phase is also called diminishing returns.
Stage II: MP becomes negative. TP starts to decline. This phase is also called the stage of negative returns
SECTION B
6. Mean because it is base on all items of the series
7. A. Distribution of population among various states in India
8. Frequency curve is a smoothed curve whereas frequency polygon consists of straight lines
9.
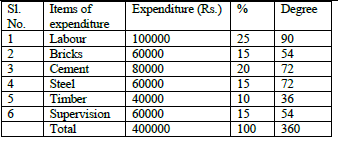
Diagram
10.
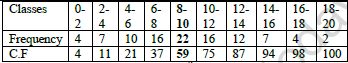
Median = (N/2) th item; 100/2 = 50th item
50th item is in the class 8-10 i.e. Median class
M = L + (N/2-cf)/f x h
= 8 + ( 50-37/22) x 2
= 8+ (13/22) x 2
= 9.18. 9 approximate
Ogive and location. On the graph median = 9
Please click on below link to download CBSE Class 11 Economics Worksheet Set G Solved
Free study material for Economics
All Chapters CBSE Class 11 Economics Worksheet
Students can use the All Chapters practice sheet provided above to prepare for their upcoming school tests. This solved questions and answers follow the latest CBSE syllabus for Class 11 Economics. You can easily download the PDF format and solve these questions every day to improve your marks. Our expert teachers have made these from the most important topics that are always asked in your exams to help you get more marks in exams.
NCERT Based Questions and Solutions for All Chapters
Our expert team has used the official NCERT book for Class 11 Economics to create this practice material for students. After solving the questions our teachers have also suggested to study the NCERT solutions which will help you to understand the best way to solve problems in Economics. You can get all this study material for free on studiestoday.com.
Extra Practice for Economics
To get the best results in Class 11, students should try the Economics MCQ Test for this chapter. We have also provided printable assignments for Class 11 Economics on our website. Regular practice will help you feel more confident and get higher marks in CBSE examinations.
FAQs
You can download the teacher-verified PDF for CBSE Class 11 Economics Worksheet Set 07 Solved from StudiesToday.com. These practice sheets for Class 11 Economics are designed as per the latest CBSE academic session.
Yes, our CBSE Class 11 Economics Worksheet Set 07 Solved includes a variety of questions like Case-based studies, Assertion-Reasoning, and MCQs as per the 50% competency-based weightage in the latest curriculum for Class 11.
Yes, we have provided detailed solutions for CBSE Class 11 Economics Worksheet Set 07 Solved to help Class 11 and follow the official CBSE marking scheme.
Daily practice with these Economics worksheets helps in identifying understanding gaps. It also improves question solving speed and ensures that Class 11 students get more marks in CBSE exams.
All our Class 11 Economics practice test papers and worksheets are available for free download in mobile-friendly PDF format. You can access CBSE Class 11 Economics Worksheet Set 07 Solved without any registration.