
Access the latest CBSE Class 11 Economics Organisation of Data Worksheet Set 03. We have provided free printable Class 11 Economics worksheets in PDF format, specifically designed for Statistics for Economics Chapter 3 Organisation of Data. These practice sets are prepared by expert teachers following the 2025-26 syllabus and exam patterns issued by CBSE, NCERT, and KVS.
Statistics for Economics Chapter 3 Organisation of Data Economics Practice Worksheet for Class 11
Students should use these Class 11 Economics chapter-wise worksheets for daily practice to improve their conceptual understanding. This detailed test papers include important questions and solutions for Statistics for Economics Chapter 3 Organisation of Data, to help you prepare for school tests and final examination. Regular practice of these Class 11 Economics questions will help improve your problem-solving speed and exam accuracy for the 2026 session.
Download Class 11 Economics Statistics for Economics Chapter 3 Organisation of Data Worksheet PDF
CHAPTER 3 ORGANISATION OF DATA
→ INTRODUCTION
The purpose of classifying raw data is to bring order in them so that they can be subjected to further statistical analysis easily. While classification of objects or things saves our valuable time and effort, it is not done in a random manner. Classification, therefore, is arranging or organising similar things into groups or classes.
RAW DATA
Unclassified data or highly disorganised data is raw data. They are often very large and difficult to handle. To draw meaningful conclusions from them, proper organisation and presentation of such data is needed before any systematic statistical analysis is undertaken. Hence after collecting data the next step is to organise and present them in a classified form as presented as a table, diagrams and graphs.
→ CLASSIFICATION OF DATA
The raw data are summarised, and made comprehensible by classification. When facts of similar characteristics are placed in the same class, it enables one to locate them easily, make comparison, and draw inferences without any difficulty.
The groups or classes of a classification can be done in various ways.
• Chronological Classification: Raw data classified according to time is known as a Chronological Classification. In such a classification, data are classified either in ascending or in descending order with reference to time such as years, quarters, months, weeks, etc.
• Spatial Classification: In Spatial Classification the data are classified with reference to geographical locations such as countries, states, cities, districts, etc.
• Qualitative Classification: Data classified according to characteristics that cannot be quantified. For example, nationality, literacy, religion, gender, marital status, etc. They cannot be measured. Yet these attributes can be classified on the basis of either the presence or the absence of a qualitative characteristic.
• Quantitative Classification: data that can be quantified or expressed in numerical values. Characteristics like height, weight, age, income, marks of students, etc. are quantitative in nature.
→ VARIABLES: CONTINUOUS AND DISCRETE
Different variables vary differently. They are broadly classified as:
1. Continuous and
2. Discrete.
A continuous variable can take any numerical value. It m,y take integral values (1, 2, 3, 4,), fractional values (1/2, 2/3, 3/4, ), and values that are not exact fractions Other examples of a continuous variable are weight, time, distance, etc.
A discrete variable can take only certain values. Its value changes only by finite "jumps". For example, a variable like the "number of students in a class", for different classes, would assume values that are only whole numbers. It cannot take any fractional value like 0.5 because "half of a student" is does not make sense.
♦ WHAT IS A FREQUENCY DISTRIBUTION?
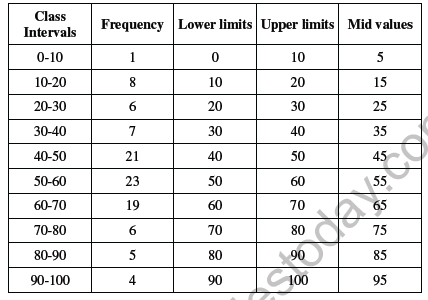
A frequency distribution is a comprehensive way to classify raw data of a quantitative variable. It shows how the different values of a variable (here, the marks in mathematics scored by a student) are distributed in different classes along with their corresponding class frequencies.
Class Frequency means the number of values in a particular class. Each class in a frequency distribution table is rounded by Class Limits. Class limits are the two ends of a class. The lowest value is called the Lower Class Limit and the highest value the Upper Class Limit.
The Class Mid-Point or Class Mark is the middle value of a class. It lies halfway between the lower class limit and the upper class limit of a class and can be ascertained in the following manner: Class Mid-Point or Class Mark = (Upper Class Limit + Lower Class Limit) /2
Example of frequency distribution
♦ HOW TO PREPARE A FREQUENCY DISTRIBUTION?
While preparing a frequency distribution, the following four questions need to be kept in mind:
1. How many classes should we have?
2. What should be the size of each class?
3. How should we determine the class limits?
4. How should we get the frequency for each class?
♦ How many classes should we have?
Before determining the number of classes, it is necessary to find out the extent the variable in hand changes in value. It is called the range of classes and it is the difference between the largest and the smallest values of the variable. A large range indicates that the values of the variable are widely spread. A small range indicates that the values of the variable are spread narrowly. After obtaining the value of range, it becomes easier to determine the number of classes once the number of class interval is known. Given the value of range, the number of classes would be large if we choose small class intervals. A frequency distribution with too many classes would look too large. Such a distribution is not easy to handle. Similarly, if we choose a class interval that is too large then the number of classes becomes too small. Though there is no hard-and-fast rule to determine the number of classes, the rule of thumb often used is that the number of classes should be between 5 and 15.
♦ What should be the size of each class?
The answer to this question depends on the answer to the previous question. We can determine the number of classes once we decide the class interval. Similarly, we can determine the class interval once we decide the number of classes. Thus we find that these two decisions are inter-linked with one another. We cannot decide on one without deciding on the other.
♦ How should we determine the class limits?
If 0 is the lower class limit of the first class: 0-10, It is because we chose the minimum value of the variable as the lower limit of the first class. Similarly, for the upper class limit for the last class is a
value greater than the maximum value of the variable. The class limits must be such chosen that the midpoint or class mark of each class coincide, as far as possible, with any value around which the data tend to be concentrated.
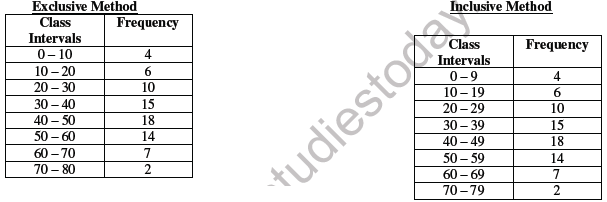
♦ There are two different methods of class limits are:
Exclusive Method: The classes, by this method, are formed in such a way that the upper class limit of one class equals the lower class limit of the next class. In this way the continuity of the data is maintained. That is why this method of classification is most suitable in case of data of a continuous variable. Under this method, the upper class limit is excluded but the lower class limit of a class is included in the interval. Therefore, any observation that is exactly equal to the upper class limit, according to the method, would not be included in that class but would be included in the next class. On the other hand, if it were equal to the lower class limit then it be included in that class.
Inclusive Method: In comparison to the exclusive method, the Inclusive Method does not exclude the upper class limit in a class interval. It includes the upper class in a class. Thus both class limits are parts of the class interval.
♦ How should we get the frequency for each class?
In simple terms, frequency of an observation means how many times that observation occurs in the raw data. Class Frequency refers to the number of values in a particular class. The counting of class frequency is done by tally marks against the particular class. A tally ( I ) is put against an observation. The counting of tally is made easier when four of them are put as ( IIII ) and the fifth tally is placed across then as ( / ). This method is more commonly known as the “four and cross method” . Thus frequency in a class is equal to the number of tallies against that class.
LOSS OF INFORMATION
The classification of data as a frequency distribution has an inherent shortcoming. While it summarises the raw data making it concise and comprehensible, it does not show the details that are found in raw data. There is a loss of information in classifying raw data. Once the data are grouped into classes, an individual observation has no significance in further statistical calculations. For Example, the class 20-30 contains 6 observations: 25, 25, 20, 22, 25 and 28. So when these data are grouped as a class 20-30 in the frequency distribution, it provides only the number of records in that class and not their actual values. All values in this class are assumed to be equal to the middle value of the class interval Statistical calculations are based only on the values of class mark and not on the values of the observations in that class. Thus the use of class mark instead of the actual values of the observations in
statistical methods involves considerable loss of information.
→ FREQUENCY DISTRIBUTION WITH UNEQUAL CLASSES
In some cases frequency distributions with unequal class intervals are more appropriate. This is done when most of the frequencies are concentrated around some classes and are widely spread for other classes.
Example of unequal frequency distribution
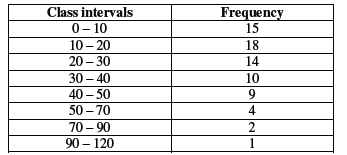
In the above frequency distribution, observations 15, 18, 14, 10 and 9 are concentrated in the classes 0 – 10, 10 – 20, 20 – 30, 40 – 50. The remaining frequencies 4, 2, 1 are in the classes 50 – 70, 70 – 90, and 90 – 120. These classes are thinly populated with observations.
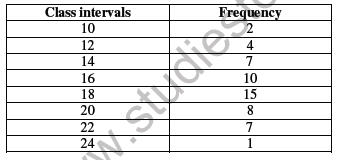
♦ FREQUENCY ARRAY
For a discrete variable, the classification of its data is known as a Frequency Array. Since a discrete variable takes values and not intermediate fractional values between two integral values, we have frequencies that correspond to each of its integral values.
Frequency Array
BIVARIATE FREQUENCY DISTRIBUTION
A Bivariate Frequency Distribution is the frequency distribution of two variables.
→ CONCLUSION
The data collected from primary and secondary sources are raw or unclassified. Once the data is collected, the next step is to classify then for further statistical analysis. Classification brings order in the data. Data can be classified through a frequency distribution in a comprehensive manner.
EXERCISES
1. Define raw data
2. What are the different ways of classification of data? Explain
3. What is a frequency distribution?
4. Distinguish between “exclusive method” and “inclusive method”
5. What are steps involved in the construction of a frequency distribution?
6. What is a variable? Distinguish between a discrete and a continuous variable.
7. What is loss of information in classified data?
8. Do you agree that classified data is better than raw data?
9. Distinguish between uni-variate and bi-variate frequency distribution.
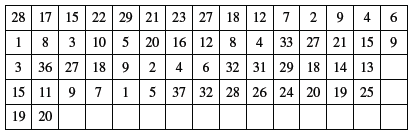
10. Prepare a frequency distribution by inclusive method taking class interval of 7 from the following data:
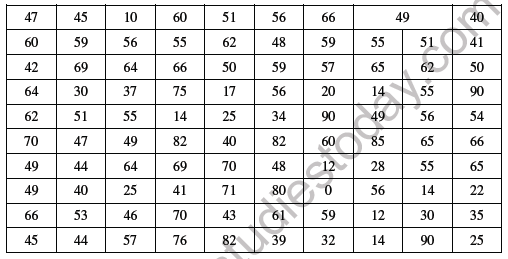
11. Prepare a frequency distribution from the following data using a appropriate class interval
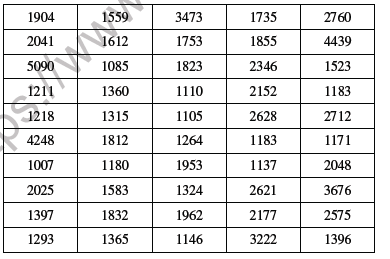
12. Prepare a frequency distribution from the following data using a appropriate class interval
Please click on below link to download CBSE Class 11 Economics Organisation of Data Worksheet Set C
Free study material for Economics
Statistics for Economics Chapter 3 Organisation of Data CBSE Class 11 Economics Worksheet
Students can use the Statistics for Economics Chapter 3 Organisation of Data practice sheet provided above to prepare for their upcoming school tests. This solved questions and answers follow the latest CBSE syllabus for Class 11 Economics. You can easily download the PDF format and solve these questions every day to improve your marks. Our expert teachers have made these from the most important topics that are always asked in your exams to help you get more marks in exams.
NCERT Based Questions and Solutions for Statistics for Economics Chapter 3 Organisation of Data
Our expert team has used the official NCERT book for Class 11 Economics to create this practice material for students. After solving the questions our teachers have also suggested to study the NCERT solutions which will help you to understand the best way to solve problems in Economics. You can get all this study material for free on studiestoday.com.
Extra Practice for Economics
To get the best results in Class 11, students should try the Economics MCQ Test for this chapter. We have also provided printable assignments for Class 11 Economics on our website. Regular practice will help you feel more confident and get higher marks in CBSE examinations.
FAQs
You can download the teacher-verified PDF for CBSE Class 11 Economics Organisation of Data Worksheet Set 03 from StudiesToday.com. These practice sheets for Class 11 Economics are designed as per the latest CBSE academic session.
Yes, our CBSE Class 11 Economics Organisation of Data Worksheet Set 03 includes a variety of questions like Case-based studies, Assertion-Reasoning, and MCQs as per the 50% competency-based weightage in the latest curriculum for Class 11.
Yes, we have provided detailed solutions for CBSE Class 11 Economics Organisation of Data Worksheet Set 03 to help Class 11 and follow the official CBSE marking scheme.
Daily practice with these Economics worksheets helps in identifying understanding gaps. It also improves question solving speed and ensures that Class 11 students get more marks in CBSE exams.
All our Class 11 Economics practice test papers and worksheets are available for free download in mobile-friendly PDF format. You can access CBSE Class 11 Economics Organisation of Data Worksheet Set 03 without any registration.