
Access the latest CBSE Class 11 Economics Presentation of data Worksheet. We have provided free printable Class 11 Economics worksheets in PDF format, specifically designed for Statistics for Economics Chapter 4 Presentation of Data. These practice sets are prepared by expert teachers following the 2025-26 syllabus and exam patterns issued by CBSE, NCERT, and KVS.
Statistics for Economics Chapter 4 Presentation of Data Economics Practice Worksheet for Class 11
Students should use these Class 11 Economics chapter-wise worksheets for daily practice to improve their conceptual understanding. This detailed test papers include important questions and solutions for Statistics for Economics Chapter 4 Presentation of Data, to help you prepare for school tests and final examination. Regular practice of these Class 11 Economics questions will help improve your problem-solving speed and exam accuracy for the 2026 session.
Download Class 11 Economics Statistics for Economics Chapter 4 Presentation of Data Worksheet PDF
PRESENTATION OF DATA
Assertion-Reasoning MCQs
Direction (Q.Nos. 66 to 70) There are two statements marked as Assertion (A) and Reason (R). Read the statements and choose the appropriate option from the options given below
(a) Both Assertion (A) and Reason (R) are true and Reason (R) is the correct explanation of Assertion (A)
(b) Both Assertion (A) and Reason (R) are true, but Reason (R) is not the correct explanation of Assertion (A)
(c) Assertion (A) is false, but Reason (R) is true
(d) Both are false
Question. Assertion (A) Simple bar graphs are drawn on a three dimensional plane.
Reason (R) Bar graphs can be either vertical or horizontal to represent same information.
Answer : C
Question. Assertion (A) A proper proportion between the vertical axis and horizontal axis of the diagram should be marked.
Reason (R) Mathematically, dependent variables are measure on the Y-axis and independent variables on X-axis.
Answer : B
Question. Assertion (A) In the process of tabulation of data, title of the table should be self-explanatory.
Reason (R) Raw data presented in a tabular form organises the data to enhance understanding.
Answer : B
Question. Assertion (A) Tabulation of data procceedes classification.
Reason (R) In classification, data is arranged based upon varying attributes of the statistics.
Answer : C
Question. Assertion (A) Pie-charts are more useful means of presentation of data as compared to histograms.
Reason (R) Line graphs are used to draw both more than and less than ogive curves.
Answer : C
Case Based MCQs
Direction Analyse the following case study table and answer questions 71 to 75 on the basis of the same.
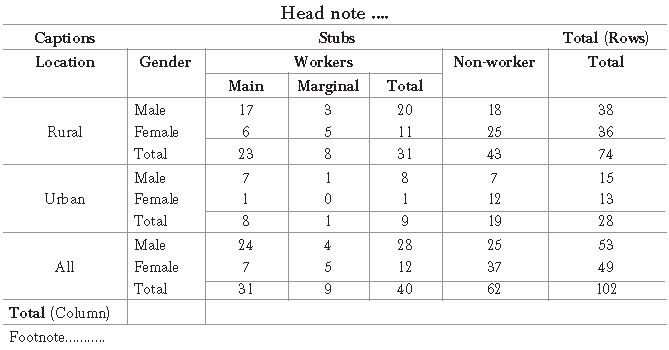
Question. Source of given information should be mentioned ……… the table.
(a) above
(b) below
(c) to the right
(d) to the left
Answer : B
Question. Identify the error in the above table from the given below.
(i) Title not mentioned
(ii) Source is not given
(iii) Units are not mentioned
Choose from the options below.
(a) (i) and (ii)
(b) (ii) and (iii)
(c) (i) and (iii)
(d) All of these
Answer : D
Question. The above table is an example of
(a) simple table
(b) complex table
(c) derived table
(d) raw/original table
Answer : B
Question. In the above table, location and gender are shown in captions. Choose from the options below.
(a) True (b) False
(c) Partially true
(d) Incomplete statement
Answer : A
Question. Row headings are known as ………… .
(a) Stubs
(b) Columns
(c) Either (a) or (b)
(d) Neither (a) nor (b)
Answer : A
Direction Observe the data given below and answer questions 76 to 80 on the basis of the same.
Distribution of Students
Based on Sections
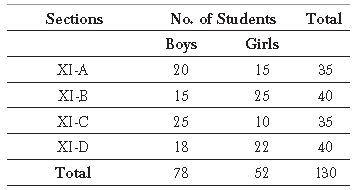
Question. Which type of diagrammatic presentation is most suitable in the above case?
(a) Simple bar graph
(b) Multiple bar graph
(c) Sub-divided bar graph
(d) Both (b) and (c)
Answer : D
Question. Which of the following is the stub of the given table?
(a) Sections
(b) No. of students
(c) Total
(d) Both (a) and (c)
Answer : B
Question. Histogram cannot be used in the above case as the data is ……… .
(a) individual
(b) discrete
(c) continuous
(d) None of these
Answer : B
Question. As per the above table, the total number of boys and girls are equal to
(a) 52
(b) 78
(c) 130
(d) None of these
Answer : C
Question. Which of the following parts of the table is/are missing?
(a) Table no.
(b) Caption
(c) Source
(d) Both (a) and (c)
Answer : D
→ Answer in one sentence ( 1 mark)
1. What are the three forms of presentation of data?
2. What is statistical table?
3. Define frequency polygon.
4. What is a Histogram?
5. What is a pie diagram?
6. Name the three types of frequency diagrams.
7. What is a bar diagram?
8. Name the different types of bar diagrams.
9. What is an Ogive?
10. What is textual presentation of data?
→ Answer in around 75 words ( 3 or 4 marks)
11. Describe the major parts of a statistical table. Draw a format of a table showing all these parts.
12. Distinguish between a bar diagram and histogram.
13. What do you mean by arithmetic line graph? Explain briefly.
14. Present the data in the form of a simple bar diagram:
![]()
→ Answer in around 100 words (6 marks).
15. Represent the following data with the help of multiple bar diagram:
16. Represent the following data by means of a component bar diagram:
![]()
![]()
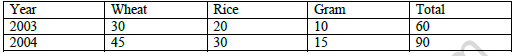
17. Present the following data on the production of food grains in the form of (i) Sub-divided bar diagram and (ii) Multiple bar diagram:
Production
18. Represent the following data by means of a pie diagram:
![]()
19. Present the following data in the form of histogram:
![]()
20. Draw a histogram and frequency polygon for the following data:
![]()
21. Draw a polygon using mid-values from the following table:
![]()
22. On the basis of following frequency distribution, draw ‘less than’ cumulative frequency curve:
![]()
23. Prepare both type of ogive (less than and more than) from the following data:
![]()
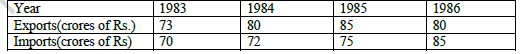
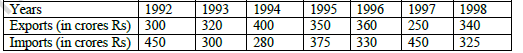
24. Represent the following information through a time series graph:
Please click on below link to download CBSE Class 11 Economics Presentation of data Worksheet
Free study material for Economics
Statistics for Economics Chapter 4 Presentation of Data CBSE Class 11 Economics Worksheet
Students can use the Statistics for Economics Chapter 4 Presentation of Data practice sheet provided above to prepare for their upcoming school tests. This solved questions and answers follow the latest CBSE syllabus for Class 11 Economics. You can easily download the PDF format and solve these questions every day to improve your marks. Our expert teachers have made these from the most important topics that are always asked in your exams to help you get more marks in exams.
NCERT Based Questions and Solutions for Statistics for Economics Chapter 4 Presentation of Data
Our expert team has used the official NCERT book for Class 11 Economics to create this practice material for students. After solving the questions our teachers have also suggested to study the NCERT solutions which will help you to understand the best way to solve problems in Economics. You can get all this study material for free on studiestoday.com.
Extra Practice for Economics
To get the best results in Class 11, students should try the Economics MCQ Test for this chapter. We have also provided printable assignments for Class 11 Economics on our website. Regular practice will help you feel more confident and get higher marks in CBSE examinations.
FAQs
You can download the teacher-verified PDF for CBSE Class 11 Economics Presentation of data Worksheet from StudiesToday.com. These practice sheets for Class 11 Economics are designed as per the latest CBSE academic session.
Yes, our CBSE Class 11 Economics Presentation of data Worksheet includes a variety of questions like Case-based studies, Assertion-Reasoning, and MCQs as per the 50% competency-based weightage in the latest curriculum for Class 11.
Yes, we have provided detailed solutions for CBSE Class 11 Economics Presentation of data Worksheet to help Class 11 and follow the official CBSE marking scheme.
Daily practice with these Economics worksheets helps in identifying understanding gaps. It also improves question solving speed and ensures that Class 11 students get more marks in CBSE exams.
All our Class 11 Economics practice test papers and worksheets are available for free download in mobile-friendly PDF format. You can access CBSE Class 11 Economics Presentation of data Worksheet without any registration.