
Access the latest CBSE Class 11 Economics On Presentation of Data Worksheet. We have provided free printable Class 11 Economics worksheets in PDF format, specifically designed for Statistics for Economics Chapter 4 Presentation of Data. These practice sets are prepared by expert teachers following the 2025-26 syllabus and exam patterns issued by CBSE, NCERT, and KVS.
Statistics for Economics Chapter 4 Presentation of Data Economics Practice Worksheet for Class 11
Students should use these Class 11 Economics chapter-wise worksheets for daily practice to improve their conceptual understanding. This detailed test papers include important questions and solutions for Statistics for Economics Chapter 4 Presentation of Data, to help you prepare for school tests and final examination. Regular practice of these Class 11 Economics questions will help improve your problem-solving speed and exam accuracy for the 2026 session.
Download Class 11 Economics Statistics for Economics Chapter 4 Presentation of Data Worksheet PDF
Statistics for Economics
Worksheet on Presentation of data Reference:
Multiple Choice Questions
Question. False base lines are used
(a) when extreme values of given series are not known
(b) when there are very less values given in the frequency distribution
(c) when there are higher values given in the frequency distribution
(d) None of the above
Answer : C
Question. A frequency polygon curve having its tail towards right side of the graph results in
(a) normal curve
(b) positively skewed curve
(c) negatively skewed curve
(d) None of the above
Answer : B
Question. Simple bar graphs are suitable for…… .
(a) attributes
(b) frequency distribution
(c) cumulative frequency distribution
(d) All of the above
Answer : B
Question. In a pie-diagram, maximum degree is
(a) 180
(b) 240
(c) 360
(d) None of these
Answer : C
Question. Which of the following are essentials of a good table?
(i) Based on the objective of study
(ii) Capable of comparison
(iii) Manageable size
(iv) Attractive
Choose from the options below.
(a) (i), (ii), (iii)
(b) (ii), (iii), (iv)
(c) (i), (iii), (iv)
(d) (i), (ii), (iii), (iv)
Answer : D
Question. When the vertices of frequency polygon are joined by a smooth curve, it is called as ……… .
(a) Line graph
(b) Curve
(c) Frequency curve
(d) None of the above
Answer : C
Question. Which of the following parts of a table is/are optional?
(a) Headnote
(b) Footnote
(c) Both (a) and (b)
(d) Neither (a) nor (b)
Answer : C
Question. Which of the following is not an objective of classification of data?
(a) To simplify complex data
(b) To facilitate comparison
(c) To enhance human understanding
(d) All of the above are objectives of classification
Answer : D
Question. Diagrammatic presentation is used as it is easy to remember diagram. Choose from the options below.
(a) True
(b) False
(c) Partially true
(d) Incomplete statement
Answer : A
Question. The main objective of tabulation is
(a) to simplify complex data
(b) to present data in a definite form
(c) Both (a) and (b)
(d) Neither (a) nor (b)
Answer : C
Question. Component bar graphs are also known as
(a) Sub-divided bar graph
(b) Percentage bar graph
(c) Broken scale bar graph
(d) Deviation bar graph
Answer : A
Question. Compound bar diagrams are same as ……… .
(a) simple bar graph
(b) multiple bar graph
(c) sub-divided bar graph
(d) None of the above
Answer : B
Question. Histograms can be used to locate which of the following central tendency?
(a) Arithmetic mean
(b) Median
(c) Mode
(d) All of these
Answer : C
Question. Graphical presentation of cumulative frequency distributions is known as
(a) Frequency curve
(b) Frequency polygon
(c) Ogive graphs
(d) Histograms
Answer : C
Question. Which of the following should be kept in mind while constructing a diagram?
(a) According to the page size
(b) Properly scaled
(c) Simple and clear
(d) All of the above
Answer : D
→ Answer in one sentence ( 1 mark)
1. What are the three forms of presentation of data?
2. What is statistical table?
3. Define frequency polygon.
4. What is a Histogram?
5. What is a pie diagram?
6. Name the three types of frequency diagrams.
7. What is a bar diagram?
8. Name the different types of bar diagrams.
9. What is an Ogive?
10. What is textual presentation of data?
→ Answer in around 75 words ( 3 or 4 marks)
11.Describe the major parts of a statistical table. Draw a format of a table showing all these parts.
12.Distinguish between a bar diagram and histogram.
13.What do you mean by arithmetic line graph? Explain briefly.
14.Present the data in the form of a simple bar diagram:
![]()
→ Answer in around 100 words (6 marks).
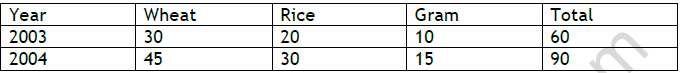
15.Represent the following data with the help of multiple bar diagram:

16.Represent the following data by means of a component bar diagram:
![]()
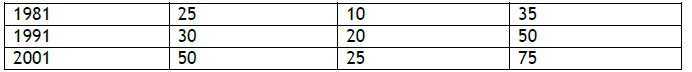
17.Present the following data on the production of food grains in the form of (i) Sub-divided bar diagram and (ii) Multiple bar diagram:
Production
18.Represent the following data by means of a pie diagram:
![]()
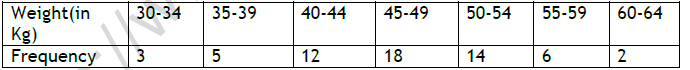
19.Present the following data in the form of histogram:
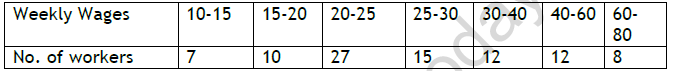
20.Draw a histogram and frequency polygon for the following data:
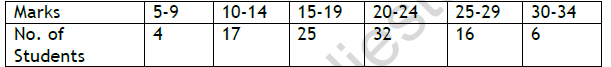
21.Draw a polygon using mid-values from the following table:
![]()
22.On the basis of following frequency distribution, draw ‘less than’ cumulative frequency curve:
![]()
23.Prepare both type of ogive (less than and more than) from the following data:
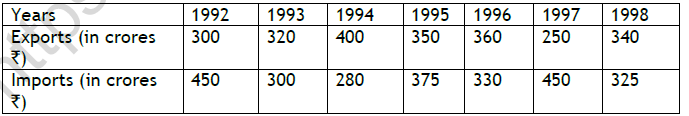
24.Represent the following information through a time series graph:
Please click on below link to download CBSE Class 11 Economics On Presentation of Data Worksheet
Free study material for Economics
Statistics for Economics Chapter 4 Presentation of Data CBSE Class 11 Economics Worksheet
Students can use the Statistics for Economics Chapter 4 Presentation of Data practice sheet provided above to prepare for their upcoming school tests. This solved questions and answers follow the latest CBSE syllabus for Class 11 Economics. You can easily download the PDF format and solve these questions every day to improve your marks. Our expert teachers have made these from the most important topics that are always asked in your exams to help you get more marks in exams.
NCERT Based Questions and Solutions for Statistics for Economics Chapter 4 Presentation of Data
Our expert team has used the official NCERT book for Class 11 Economics to create this practice material for students. After solving the questions our teachers have also suggested to study the NCERT solutions which will help you to understand the best way to solve problems in Economics. You can get all this study material for free on studiestoday.com.
Extra Practice for Economics
To get the best results in Class 11, students should try the Economics MCQ Test for this chapter. We have also provided printable assignments for Class 11 Economics on our website. Regular practice will help you feel more confident and get higher marks in CBSE examinations.
FAQs
You can download the teacher-verified PDF for CBSE Class 11 Economics On Presentation of Data Worksheet from StudiesToday.com. These practice sheets for Class 11 Economics are designed as per the latest CBSE academic session.
Yes, our CBSE Class 11 Economics On Presentation of Data Worksheet includes a variety of questions like Case-based studies, Assertion-Reasoning, and MCQs as per the 50% competency-based weightage in the latest curriculum for Class 11.
Yes, we have provided detailed solutions for CBSE Class 11 Economics On Presentation of Data Worksheet to help Class 11 and follow the official CBSE marking scheme.
Daily practice with these Economics worksheets helps in identifying understanding gaps. It also improves question solving speed and ensures that Class 11 students get more marks in CBSE exams.
All our Class 11 Economics practice test papers and worksheets are available for free download in mobile-friendly PDF format. You can access CBSE Class 11 Economics On Presentation of Data Worksheet without any registration.