
Access the latest CBSE Class 11 Economics Organisation of Data Worksheet Set 01. We have provided free printable Class 11 Economics worksheets in PDF format, specifically designed for Statistics for Economics Chapter 3 Organisation of Data. These practice sets are prepared by expert teachers following the 2025-26 syllabus and exam patterns issued by CBSE, NCERT, and KVS.
Statistics for Economics Chapter 3 Organisation of Data Economics Practice Worksheet for Class 11
Students should use these Class 11 Economics chapter-wise worksheets for daily practice to improve their conceptual understanding. This detailed test papers include important questions and solutions for Statistics for Economics Chapter 3 Organisation of Data, to help you prepare for school tests and final examination. Regular practice of these Class 11 Economics questions will help improve your problem-solving speed and exam accuracy for the 2026 session.
Download Class 11 Economics Statistics for Economics Chapter 3 Organisation of Data Worksheet PDF
Multiple Choice Questions
Question. The value exactly at the middle of the interval is known as
(a) Class width
(b) Class size
(c) Mid value
(d) Upper limit
Answer : C
Question. Monthly salary of an individual is an example of continuous variable.
Choose from the options below.
(a) True
(b) False
(c) Partially true
(d) Incomplete statement
Answer : D
Question. Which of the following statistical series is/are not based upon general characteristics?
(i) Time series (ii) Spatial series
(iii) Condition series
Choose from the options below.
(a) (i) and (ii)
(b) (ii) and (iii)
(c) (i) and (iii)
(d) None of these
Answer : D
Question. Which of the following is/are type(s) of frequency distribution?
(a) Individual frequency distribution
(b) Discrete frequency distribution
(c) Continuous frequency distribution
(d) Both (b) and (c)
Answer : D
Question. An inclusive series is given as, 1-9, 10-19, 20-29. What will be the mid value of the second class in this situation?
(a) 10
(b) 19
(c) 14.5
(d) 24.5
Answer : C
Question. An open-ended series doesn’t have upper limit in every class interval.
Choose from the options below.
(a) True
(b) False
(c) Partially true
(d) Incomplete statement
Answer : B
Question. The method in which the upper limit of a class interval is same as the lower limit of the lower limit of the next class interval is known as
(a) Cumulative method
(b) Inclusive method
(c) Exclusive method
(d) None of these
Answer : C
Question. In order to convert an inclusive series into an exclusive one, we need to subtract 1 from both lower limit and upper limit of each class interval.
Choose from the option below.
(a) True
(b) False
(c) Partially true
(d) Incomplete statement
Answer : C
Question. The frequency distribution representing the ages of father and sons/daughters will be represented by
(a) uni-variate frequency distribution
(b) bi-variate frequency distribution
(c) cumulative frequency distribution
(d) None of the above
Answer : B
Question. In less-than cumulative frequency distribution, the series is arranged in ……… order.
(a) increasing
(b) decreasing
(c) constant
(d) None of the above
Answer : A
Question. In the construction of a frequency distribution, it is generally preferred that classes should be of
(a) equal width
(b) unequal width
(c) increasing width
(d) decreasing width
Answer : A
Question. Which of the following is the objective of classification
(a) Simplification
(b) Briefness
(c) Comparability
(d) All of these
Answer : D
Question. Classification of data on the basis of time period is called:
(a) Geographical classification
(b) chronological classification
(c) Qualitative classification
(d) Quantitative classification
Answer : B
Question. The data classified with reference to countries is called :
(a) spatial
(b) chronological
(c) both
(d) none
Answer : B
Question. Range is the:
(a) Difference between the largest and the smallest observations.
(b) Difference between the smallest and the largest observations.
(c) Average of the largest and smallest observations.
(d) Ratio of the largest to the smallest observations.
Answer : A
Question. A series in which every class interval excludes items corresponding to its upper limit is called:
(a) Exclusive series
(b) Inclusive series
(c) both (a) and (b)
(d) none of these
Answer : A
Question. Which of the following equations is correct?
(a) s=r+n
(b) s=r-n
(c) s=r x n
(d) s=r/n
Answer : D
Question. series excludes the upper limit of the class- interval.
(a) exclusive
(b) inclusive
(c) open ended
(d) mid value
Answer : A
Question. The Difference between upper limit and lower limit of a class is known as;
(a) Range
(b) Magnitude of class interval
(c) frequency
(d) Class limit
Answer : A
Question. The class midpoint is equal to:
(a) The average of the upper class limit and the lower class limit
(b) the product of upper class limit and the lower class limit
(c) The ratio of the upper class limit and the lower class limit
(d) none of these
Answer : A
Question. The class mid- point is equal to:
(a) The average of the upper class limit and the lower class limit.
(b) The product of the upper class limit and lower class limit.
(c) The ratio of the upper class limit and the lower class limit.
(d) None of the above.
Answer : A
Question. “The main objective of organization of data is to arrange the data in such a form that it becomes fairly easy to compare and analyze. Generally, we can do this by distributing data into various classes on the basis of some attributes or characteristic. This distribution of data into classes is the classification of data. Further each division of data is a class. All in all, through the process of classification we can group and divide data into classes according to general attribute, which facilitates comparison and analysis.”
Answer the following questions.
1.An attribute is:
(a) A Qualitative characteristic
(b) A measurable characteristic
(c) A Quantitative characteristic
(d) All of these
2.Classes with Zero frequencies is called--------
3. Which are the two types of quantitative classification?
1-------------------2.---------------
4.When the data is classified according to geographic location or region, it is known as----------------
Answer : A
Question. Assertion (a) : A discrete variable can not take fractional value.
Reason (R) : A discrete variable can also take fractional values.
(a) Both Assertion (a) and Reason (R) are true and Reason (R) is the correct explanation of Assertion (a)
(b) Both Assertion (a) and Reason (R) are true and Reason (R) is not the correct explanation of Assertion (a)
(c) Assertion (a) is true but Reason (R) is false.
(d) Assertion (a) is false but Reason (R) is true.
Answer : D
Question. An open –end series is that series in which:
(a) Lower limit of the first class is missing
(b) Upper limit of the last class is missing
(c) both (a) and (b)
(d) None of these
Answer : C
Question. Classification of population of India in terms of years is an example of :
(a) Geographical classification
(b) Chronological classification
(c) Quantitative classification
(d) Qualitative classification
Answer : A
Question. “When faced with the research problem, you need to collect, analyze, interprate data to answer your research questions. Examples of research questions that could require you to gather data include how many people will vote for a candidate, what is the best product mix to use and how useful is a drug in curing a disease.
The research problem you explore informs the type of data you will collect and the data collection method you will use.”
Answer the following questions.
(1) What are the sources of data?
(2) Name two important sources of secondary data?
(3 ) Name two methods of data collection?
(4) Schedules are filled by the:----
(a) Investigator
(b) Enumerator
(c) Informant
(d) None of these
Answer : B
Question. Assertion (a) :Classification brings order to raw data
Reason (R) :Classification should be formed in such a way that the class mark of each class comes as close as possible, to a value around which the observations in a class tend to concentrate
(a) Both Assertion (a) and Reason (R) are true and Reason (R ) is the correct explanation of Assertion (a)
(b) Both Assertion (a) and Reason (R) are true and Reason (R ) is not the correct explanation of Assertion (a)
(c) Assertion (a) is true but Reason (R ) is false.
(d) Assertion(a) is false but Reason (R) is true.
Answer : B
Question. Assertion (a) : Classification simplifies and condenses the mass of data.
Reason (R) : Classification removes complexities and facilitates comparison.
(a) Both Assertion (a) and Reason (R) are true and Reason (R ) is the correct explanation of Assertion (a)
(b) Both Assertion (a) and Reason (R) are true and Reason (R ) is not the correct explanation of Assertion (a)
(c) Assertion (a) is true but Reason (R) is false.
(d) Assertion(a) is false but Reason (R) is true
Answer : B
Question. Statistical calculation in classified data are based on:
(a) The actual values of observations.
(b) The upper class limits.
(c) The lower class limits.
(d) The class mid-point.
Answer : D
Question. Assertion (a) : Classification is the process of arranging data into sequence and groups.
Reason (R) : Data are classified according to their common characteristics for separating them into different but related parts.
(a) Both Assertion (a) and Reason (R) are true and Reason (R ) is the correct explanation of Assertion (a)
(b) Both Assertion (a) and Reason (R) are true and Reason (R ) is not the correct explanation of Assertion (a)
(c) Assertion (a) is true but Reason (R) is false.
(d) Assertion(a) is false but Reason (R) is true
Answer : A
Question. Assertion (a) :In the case of exclusive class intervals, upper limit is not included
Reason (R) : In the case of exclusive class intervals, we have to decide in advance which class limit is to be excluded.
(a) Both Assertion (a) and Reason (R) are true and Reason (R ) is the correct explanation of Assertion (a)
(b) Both Assertion (a) and Reason (R) are true and Reason (R ) is not the correct explanation of Assertion (a)
(c) Assertion (a) is true but Reason (R) is false.
(d) Assertion (a) is false but Reason (R) is true.
Answer : D
Question. How many types of cumulative frequency distributions are there?
(a) 2
(b) 3
(c) 4
(d) None of these
Answer : A
I. Answer in One Sentence Each (1 Mark each)
A. What does classification of data mean?
B. What is the main purpose of classifying raw data?
C. How is a discrete variable different from continuous variable?
D. What does frequency mean?
E. What is a bi-variate distribution?
F. Statistical calculations in classified data are based on: (Choose the correct alternative)
a. Actual value of the distribution
b. The upper class limit
c. The lower class limit
d. The class mid points
G. Under exclusive method: (Choose the correct alternative)
a. The upper class limit of a class is excluded in the class interval.
b. The upper class limit of a class is included in the class interval.
c. The lower class limit of a class is excluded in the class interval.
d. The lower class limit of a class is included in the class interval.
H. The class mid-point is equal to : (Choose the correct alternative)
a. The average of upper class limit and the lower class limit.
b. The product of upper class limit and the lower class limit
c. The ratio of upper class limit and the lower class limit
II. ANSWER IN AROUND 60 WORDS (3 Marks each)
1. How is the number of classes determined while constructing a frequency distribution?
2. How can we convert inclusive class interval into exclusive class interval?
3. When is a frequency distribution of unequal class interval suitable?
4. Explain how is size of each class determined?
III. Answer in around 75 words (4 Marks each)
1. What are the different ways of classifying raw data?
2. Classification of data into a frequency distribution has inherent draw backs. What are these draw backs?
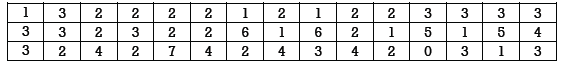
3. Construct a frequency distribution for the following
IV. Answer in around 100 words (6 Marks each)
1. Briefly explain the different steps involved in the constructing a frequency distribution.
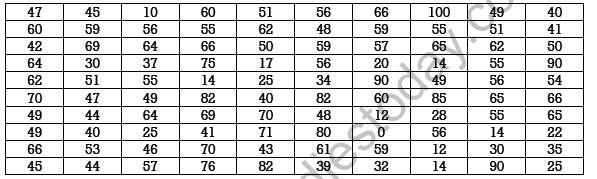
2. Construct a frequency distribution for the following data
Please click on below link to download CBSE Class 11 Economics Organisation of Data Worksheet Set A
Free study material for Economics
Statistics for Economics Chapter 3 Organisation of Data CBSE Class 11 Economics Worksheet
Students can use the Statistics for Economics Chapter 3 Organisation of Data practice sheet provided above to prepare for their upcoming school tests. This solved questions and answers follow the latest CBSE syllabus for Class 11 Economics. You can easily download the PDF format and solve these questions every day to improve your marks. Our expert teachers have made these from the most important topics that are always asked in your exams to help you get more marks in exams.
NCERT Based Questions and Solutions for Statistics for Economics Chapter 3 Organisation of Data
Our expert team has used the official NCERT book for Class 11 Economics to create this practice material for students. After solving the questions our teachers have also suggested to study the NCERT solutions which will help you to understand the best way to solve problems in Economics. You can get all this study material for free on studiestoday.com.
Extra Practice for Economics
To get the best results in Class 11, students should try the Economics MCQ Test for this chapter. We have also provided printable assignments for Class 11 Economics on our website. Regular practice will help you feel more confident and get higher marks in CBSE examinations.
FAQs
You can download the teacher-verified PDF for CBSE Class 11 Economics Organisation of Data Worksheet Set 01 from StudiesToday.com. These practice sheets for Class 11 Economics are designed as per the latest CBSE academic session.
Yes, our CBSE Class 11 Economics Organisation of Data Worksheet Set 01 includes a variety of questions like Case-based studies, Assertion-Reasoning, and MCQs as per the 50% competency-based weightage in the latest curriculum for Class 11.
Yes, we have provided detailed solutions for CBSE Class 11 Economics Organisation of Data Worksheet Set 01 to help Class 11 and follow the official CBSE marking scheme.
Daily practice with these Economics worksheets helps in identifying understanding gaps. It also improves question solving speed and ensures that Class 11 students get more marks in CBSE exams.
All our Class 11 Economics practice test papers and worksheets are available for free download in mobile-friendly PDF format. You can access CBSE Class 11 Economics Organisation of Data Worksheet Set 01 without any registration.