CBSE Class 9 Mathematics Statistics VBQs

Read and download the CBSE Class 9 Mathematics Statistics VBQs. Designed for the 2025-26 academic year, these Value Based Questions (VBQs) are important for Class 9 Mathematics students to understand moral reasoning and life skills. Our expert teachers have created these chapter-wise resources to align with the latest CBSE, NCERT, and KVS examination patterns.

VBQ for Class 9 Mathematics Chapter 12 Statistics

For Class 9 students, Value Based Questions for Chapter 12 Statistics help to apply textbook concepts to real-world application. These competency-based questions with detailed answers help in scoring high marks in Class 9 while building a strong ethical foundation.

Chapter 12 Statistics Class 9 Mathematics VBQ Questions with Answers

Question : The following number of goals was scored by a team in a series of 10 matches: 2,
3, 4, 5, 0, 1, 3, 3, 4, 3
Find the mean, median and mode of these scores.
Answer:

The number of goals scored by the team is
2, 3, 4, 5, 0, 1, 3, 3, 4, 3

CBSE Class 9 Mathematics Statistics VBQs

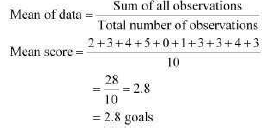
Arranging the number of goals in ascending order, 0, 1, 2, 3, 3, 3, 3, 4, 4, 5
The number of observations is 10, which is an even number. Therefore, median score will be the mean of  10/2 i.e., 5th and  10/2+1 ascending or descending order.

CBSE Class 9 Mathematics Statistics VBQs-


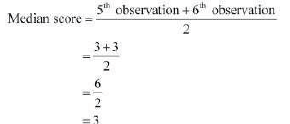
i.e., 6 th observation while arranged in Mode of data is the observation with the maximum frequency in data.
Therefore, the mode score of data is 3 as it has the maximum frequency as 4 in the data.

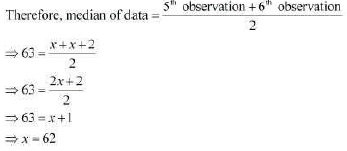
Question : The following observations have been arranged in ascending order. If the median of the data is 63, find the value of x.
29, 32, 48, 50, x, x + 2, 72, 78, 84, 95
Answer: 
It can be observed that the total number of observations in the given data is 10 (even number). Therefore, the median of this data will be the mean of  10/2 i.e., 5th and 10/2 +1 i.e., 6 th observation.

CBSE Class 9 Mathematics Statistics VBQs-2


STATISTICS

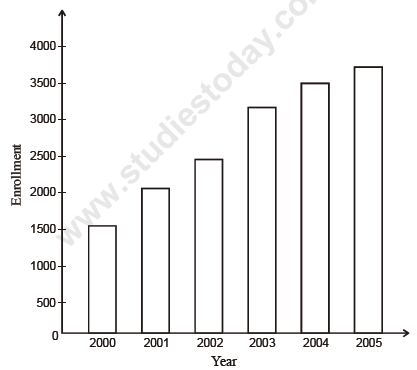
Question : The enrollment of a school during six consecutive years was as follows—   CBSE%20Class%209%20Mathematics%20Statistics%20VBQs%201.PNG

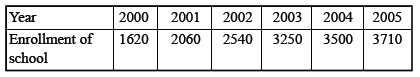
(a) Find the mean of the enrollment of the school for this period.

(b) Draw a bar graph of the above data.
 
(c) What value this data represent ?
Answer : (a) 2780
 
(b)
 
   CBSE%20Class%209%20Mathematics%20Statistics%20VBQs%208.PNG
 
(c) Awareness of people towards education
 
 
Question : Status of tigers in India in last 100 years is as follows—
 CBSE%20Class%209%20Mathematics%20Statistics%20VBQs%202.PNG
 
(a) Make bar graph of above data.
 
(b) What idea promotes here ?
Answer :
 
   CBSE%20Class%209%20Mathematics%20Statistics%20VBQs%209.PNG
 
 
Question : The following table shows the interest paid by India (in thousand crore rupees) on external debts during the period 1998-99 to 2002-03.
  CBSE%20Class%209%20Mathematics%20Statistics%20VBQs%203.PNG
 
(a) Draw histogram of the above data.
 
(b) What conclusion will derive from above data ?
Answer:
 
    CBSE%20Class%209%20Mathematics%20Statistics%20VBQs%2010.PNG
(b) We should try to be more self dependent.
 
 
Question : The following bar graph represents the budget allocation by Govt. of NCT of Delhi under Ladli scheme.
   /CBSE%20Class%209%20Mathematics%20Statistics%20VBQs%204.PNG
 
This scheme started in January 2008.
 
Read the above bar graph and answer the following questions.
 
(a) In which year the budget was minimum ?
 
(b) In which year the budget was maximum ?
 
(c) What values are depicted from the above data ?
Answer : (a) The budget was minimum in 2007-08.
 
(b) The budget was maximum in 2010-11.
 
(c) (i) Save the girl child.
 
(ii) Improving school enrollment.
 
(iii) Reducing insecurity among the parents having only daughter.
 
 
Question : 25 plants each were planted in 25 schools during Van Mahotsava.
16        20        23      10           6
10        12         7         9          15
15        22        11       13         21
17        9           4        10         12
20        15        18       18         22
 
(a) Prepare a frequency distribution table of the above data using class interval 0-5 etc.
 
(b) What values are represented through this activity.
Answer : (a) Class Interval                   No. of plants
                  0-5                                    1
                  5-10                                  4
                  10-15                                7
                  15-20                                7
                  20-25                                6
 
(b) Conservation of earth by tree plantation.

Question : A group of 10 students visited to a blind school. They donated Rs. 100, 120, 125, 50, 75, 100, 150, 100, 75, 85.
 
(a) Find mean, mode, median of this data.
 
(b) What impression will you receive through this ?
 Answer : (a) By arranging the data in ascending order, we get
 
50, 75, 75, 85, 100, 100, 120, 125, 150
Mean =980/10 = 80
 
Mode = 100
Median =( 5th + 6th/2)  term= 100+100/2=200/2=100 
 
(b) Habit of giving donation for social cause
 
 
Question : The following data represents the power consumption of Delhi from 2001 to 2010.
 
   CBSE%20Class%209%20Mathematics%20Statistics%20VBQs%205.PNG
(a) Draw bar graph of above data.
 
(b) What represents through the above data.
Answer :
    CBSE%20Class%209%20Mathematics%20Statistics%20VBQs%2011.PNG
(b) Save the electricity
 
Question : The following data represents the cases of deptheria and death due to deptheria—
 
CBSE%20Class%209%20Mathematics%20Statistics%20VBQs%206.PNG
 
(a) In which year, the cases of deptheria were minimum ?
 
(b) In which year, the deptheria death occurs ?
 
(c) What value we draw from the above data ?
Answer : (a) In 2007, the cases of deptheria were minimum.
 
(b) In 2006 and 2007, no death due to deptheria occur.
 
(c) The vaccination programme should implemented to reduce cases as well as deaths due to deptheria.
 
(d) Community services
 
 
Question : The following data represents the cases of whooping cough in India during the following years—
 
CBSE%20Class%209%20Mathematics%20Statistics%20VBQs%207.PNG
 
(a) Draw frequency polygon curve of the above data.
 
(b) What value represents this data ?
Answer :
     CBSE%20Class%209%20Mathematics%20Statistics%20VBQs%2012.PNG
(b) Community services
 
 
Question : 10 people were asked about the time they spent in a week in doing social work in their community. They said 10, 7, 13, 10, 20, 15, 10, 14, 12, 16 hours resp. Find the mean, mode, median time in a week devoted by them for social work. What value we draw from the above data ?
Answer : (a) Arranging in ascending order
                  7, 10, 10, 10, 12, 13, 14, 15, 16, 20
Mean =   7+ 10 +10 +10+ 12+ 13+ 14 +15+ 16 +20/10  = 127/10 = 12.7
 
Mode = 10
 
Median =5th+ 6th/2 term = 12 +13/2= 25 /2=12.5
 
(b) Social service

VBQs for Chapter 12 Statistics Class 9 Mathematics

Students can now access the Value-Based Questions (VBQs) for Chapter 12 Statistics as per the latest CBSE syllabus. These questions have been designed to help Class 9 students understand the moral and practical lessons of the chapter. You should practicing these solved answers to improve improve your analytical skills and get more marks in your Mathematics school exams.

Expert-Approved Chapter 12 Statistics Value-Based Questions & Answers

Our teachers have followed the NCERT book for Class 9 Mathematics to create these important solved questions. After solving the exercises given above, you should also refer to our NCERT solutions for Class 9 Mathematics and read the answers prepared by our teachers.

Improve your Mathematics Scores

Daily practice of these Class 9 Mathematics value-based problems will make your concepts better and to help you further we have provided more study materials for Chapter 12 Statistics on studiestoday.com. By learning these ethical and value driven topics you will easily get better marks and also also understand the real-life application of Mathematics.

Where can I download latest CBSE VBQs for Class 9 Mathematics Chapter 12 Statistics

You can download the CBSE VBQs for Class 9 Mathematics Chapter 12 Statistics for latest session from StudiesToday.com

Are the Chapter 12 Statistics Class 9 Mathematics VBQs available for the latest session

Yes, the VBQs issued by CBSE for Chapter 12 Statistics Class 9 Mathematics have been made available here for latest academic session

Is there any charge for the VBQs with answers for Class 9 Mathematics Chapter 12 Statistics

There is no charge for the VBQs and their answers for Class 9 CBSE Mathematics Chapter 12 Statistics you can download everything free

How can I improve my VBQs in Class 9 Mathematics Chapter 12 Statistics

Regular revision of VBQs given on studiestoday for Class 9 subject Mathematics Chapter 12 Statistics can help you to score better marks in exams

What are VBQs for Class 9 Mathematics Chapter 12 Statistics

Value Based Questions (VBQs) for Class 9 Mathematics Chapter 12 Statistics help to test the ability of students to apply learnings to various situations in life.