
Read and download the CBSE Class 12 Economics Forms of Market Revision Notes Set 01. Designed for 2026-27, this advanced study material provides Class 12 Economics students with detailed revision notes, sure-shot questions, and detailed answers. Prepared by expert teachers and they follow the latest CBSE, NCERT, and KVS guidelines to ensure you get best scores.
Advanced Study Material for Class 12 Economics Part B Macroeconomics Chapter 2 National Income Accounting
To achieve a high score in Economics, students must go beyond standard textbooks. This Class 12 Part B Macroeconomics Chapter 2 National Income Accounting study material includes conceptual summaries and solved practice questions to improve you understanding.
Class 12 Economics Part B Macroeconomics Chapter 2 National Income Accounting Notes and Questions
Meaning:
Market is a system where buyers and sellers come into contact for the transaction of goods and services.
Important notes:
• The term market as used in economics is quite different from the common sense understanding of a market
• In particular, it has nothing as such to do with the market place as you might tend to think
• For buying and selling commodities individuals may or may not meet each other in an actual physical location
• Interaction between buyer and seller can take place in a variety of situations such as village-chowk or a super bazar in a city or alternatively, buyers and sellers can interact with each other through telephone or internet and conduct the exchange of commodities.
Market structure: refers to number of firms operating in an industry, nature of competition between them and the nature of product.
Markets are classified on the basis of
i) Number of sellers and buyers
ii) Nature of product
iii) Knowledge about the market and product
iv) Nature of competition among the sellers
v) Price determination in the market, etc.
Forms of market
On the basis of the above components markets may be classified as
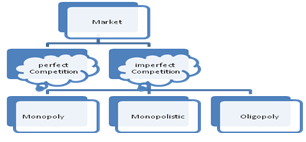
A. Perfect completion
Meaning:
It is a market structure characterized by large number of buyers and sellers selling homogenous products
Features:
(i) Large number of buyers and sellers
• There are large number of buyers and sellers selling homogenous products
• Hence no individual firm can influence the market price
Implications:
• As there are large number of sellers , the share of individual firms in the market supply is very negligible
• No individual firm can influence the market price by changing the market supply
• As there are large number of buyers , the share of individual buyer in the market demand is very negligible
• No individual buyer can influence the market price by influencing the market demand
From the above it is clear that neither the sellers can influence the market price nor the buyer It implies that firm is a price taker and it will sell the product at the price determined by the industry
(ii) Homogenous Product
• Under Perfect Competitive market the products offered for sale by al firms are homogenous i.e. identical in shape , size , colour , quality etc
• So the buyers have no specific preference to buy from a particular seller
• Hence buying of a commodity is a matter of chance not of choice
Implications:
• As the products of all firms are homogenous the buyers are not ready to pay higher price (will pay same price) for the product of each firm
• The firms also cannot charge a higher price for its product Hence it implies that there will prevail uniform price in the market
(iii) Freedom of entry and exit
• Under this market structure there is no legal or technical barrier in the entry of new firms and exit of the existing firms from the industry
• This feature ensures normal profit in long run
Implications:
• If any firm earn super normal profit in the long run new firms get attracted by it and they will enter in to the industry as there is no restrictions on the entry of new firms.
• This will increase the market supply and lowers the price which resulted in to reduction in the profit level.
• If any firm earn abnormal profit (losses) it will exit from the industry
• This will decrease the market supply and rises the price which leads to increase in the level of profit
• This will continue till all firms earn only normal profit Hence it implies that in long run all firms earn only normal profit, but in short run they may earn super normal or normal or abnormal profit
(iv) Perfect knowledge about the market
• All the buyers and sellers have perfect knowledge about the market
• This ensures uniform profit for all firms
Implications:
• All the buyers have perfect knowledge about the product market
• Hence no buyer will be ready to pay higher price for the products. So there will be uniform price in the market
• All the sellers have perfect knowledge about the factor market
• All have equal access to the technology and inputs used
• Hence all have equal cost structure
(v) No selling cost
• Selling cost refers to the cost borne by the firms for sales promotion
• These are inevitable in order to make the consumer know about their product
• As in Perfect Competitive market all the buyers are well informed about the product market there is no need of selling cist
(vi) Perfect mobility of factors
• Factors of production are perfectly mobile under this market structure
• It implies that the resources are able to switch over from one use to the other without any restriction
(vii) Absence of transportation cost
• To ensure uniform price it is assumed that the transportation cost is zero
• Otherwise the prices of identical goods will differ
(viii) Firms are price taker
• As there are large number of sellers , the share of individual firms in the market supply is very negligible
• No individual firm can influence the market price by changing the market supply
• It implies that firm is a price taker and it will sell the product at the price determined by the industry through the intersection of market demand and market supply
Demand curve under perfect competitive market:
• In a perfect competitive market each firm is able to sell any output at the price decided by the industry and it remain constant
• As the price is equal to AR and AR curve is the demand curve , so the demand curve facing a perfectly competitive firm is parallel to the output axis and have perfectly elastic demand

A. Monopoly
Monopoly is an extreme form of market structure. The word monopoly is derived from two Greek words-Mono and Poly. Mono means single and Poly means 'seller'. Thus monopoly means single seller. Monopoly is a form of market organization for a commodity in which there is only one single seller of the commodity.
Meaning:
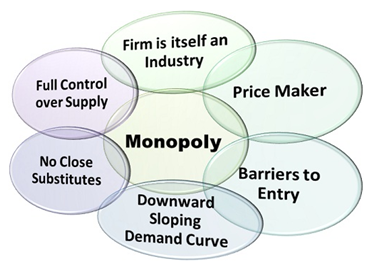
It is a market structure characterized by a single seller for a product having no close substitutes
Features:
(i) Single Seller
- Monopoly is a form of imperfect market structure where there is only one seller of a product.
- A monopoly firm may be owned by a person, a few numbers of partners or a joint stock company.
- The characteristic feature of single seller eliminates the distinction between the firm and the industry. A monopolist firm is itself 'the industry.
- Under monopoly there are large numbers of buyers although the seller is one.
- No buyer's reaction can influence the price.
Implications:
• The monopoly firm and industry are the same and individual firm have full control over the market price as it can completely influence the Market supply
• But buyers have no control over the market price
• Hence firms under monopoly market are PRICE MAKER
(ii) No close substitute
• Under monopoly a single producer produces single commodities which have no close substitute.
• As the commodity in question has no close substitute, the monopolist is at liberty to change a price according to his own whimsy.
• Monopoly cannot exist when there is competition.
• A firm is said, to be monopolist only when it is the single producer and supplier of the product which have no close substitute.
• Under monopoly the cross elasticity of demand is zero.
• Cross elasticity of demand shows a change in the demand for a good as a result of change in the price of another good.
(iii) Strong barriers to the entry into the industry exist:
• In a monopoly market there is strong barrier on the entry of new firms.
• Monopolist faces no competition.
• As there is one firm no other rival producers can enter the market of the same product.
• Since the monopolist has absolute control over the production and sale of the commodity certain economic barriers are imposed on the entry of potential rivals.
(iv) Price discrimination
• From the point of view of profit a monopolist can change different prices from different consumers of his commodity.
• This policy is known as price discrimination. He adopts the policy of price discrimination on various bases such as charging different prices from different consumers or fixing different prices at different places etc.
(v) Firm is a Price-Maker:
• As monopoly is a form of imperfect market organization, there is no difference between firm and industry.
• A monopoly firm is said to be an industry.
• Thus monopoly means the absence of competition.
• There are strong barriers to entry into the industry.
• As a result, seller has full control over the supply of the commodity, hence it makes the price.
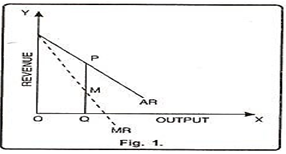
Nature of demand curve:
• In case of monopoly one firm constitutes the whole industry.
• The entire demand of the consumers for a product goes to the monopolist.
• The monopolist face the entire market for a particular commodity.
• Since the demand curve of the individual consumer slopes downward, the monopolist faces a downward sloping demand curve.
• A monopolist can sell more of his output only at a lower price and can reduce the sale at a high price. The downward sloping demand curve expresses that the price (AR) goes on falling as sales are increased.
• In monopoly AR curve slopes downward and MR curve lies below AR curve.
• Demand curve under monopoly otherwise known as average revenue curve.
Emergence of Monopoly
(a) Intellectual Property Protection (patent Rights and Copyrights)
• Extending intellectual property protection to a firm in the form of patents and copyrights is one way in which monopolies are created.
• When a government does this, it is in fact giving a single firm an exclusive right to provide a particular product / service to the market.
• Patents and copyrights work in providing owners of intellectual property with the right to act as an exclusive provider of a new product for a specific length of time. This creates a temporary monopoly in the market with regards to new products and services.
(b) Natural Monopoly:
• A market may also become a monopoly simply because it may be more cost-effective for one firm to serve the whole market than to have several smaller firms in competition with one another.
• A firm with virtually unlimited economies of scale is referred to as a natural monopoly.
• Such firms become monopolies due to their position and size, which makes it impossible for new entrants in the market to compete price-wise.
• Natural monopolies are common in industries with high fixed costs and low marginal costs of operation such as providers of television, telephone, and internet services.
(c) Ownership of a Key Resource
When one firm exerts sole control over a resource that is necessary for the production of a specific product, the market may become a monopoly.
(d) Manipulation:
• A firm wanting to monopolize a market may engage in various types of deliberate action to exclude competitors or eliminate competition.
• Such actions include collusion, lobbying governmental authorities, and force ( anti-competitive practices).
(f) Government Licensing :
• It means that before a firm can enter an industry, it needs to take permission from the government.
• Licensing is used to ensure minimum standards of competency.
• By not granting licenses to new firms, government aims to assure that only one firm operates in the market.
Monopolistic Competition:
Monopolistic competition as a market structure was first identified in the 1930s by American economist Edward Chamberlin, and English economist Joan Robinson.
Pure monopoly and perfect competition are two extreme cases of market structure. In reality, there are markets having large number of producers competing with each other in order to sell their product in the market. Thus, there is monopoly on one hand and perfect competition on other hand. Such a mixture of monopoly and perfect competition is called as monopolistic competition. It is a case of imperfect competition. Ex-tooth paste market, soap market, etc.
Meaning:
It is a market structure characterized by large number of firms which sells closely related but differentiated products.
Features:
(i) Large number of Firms:
• There are large number of firms but not as large as under perfect competition.
Implications:
• That means each firm can control its price-output policy to some extent.
• It is assumed that any price-output policy of a firm will not get reaction from other firms that means each firm follows the independent price policy.
• Each firm has limited share in the market supply
• Hence each firm partially influence the market price
(ii) Product Differentiation:
• Another feature of the monopolistic competition is the product differentiation.
• Product differentiation refers to a situation when the buyers of the product differentiate the product of different firms. Basically, the products of different firms are not altogether different; they are slightly different from others. Although each firm producing differentiated product has the monopoly of its own product, yet he has to face the competition. This product differentiation may be real or imaginary. Real differences are like design, material used, skill etc. whereas imaginary differences are through advertising, trade mark and so on.
• Product differentiation take place in the form of Brand Name, Size, Design ,colour, quality , after sales service etc.
Implications:
• Product differentiation create an artificial superiority in the minds of buyers about the product of a particular firm
• This induce the buyer to pay higher price even for the same of product of different firms
• This gives some monopoly power to an individual firm to influence the market price. Hence there prevails a different price for the same product.
(iii) Selling Cost
• Selling cost plays an important role in Monopolistic Competitive market
• As the buyers have no perfect knowledge about the market it is essential to make the buyers know about the product of each firm
• This persuasive way of incurring selling cost constitute a substantial part of the total cost of a firm
(iv) Freedom of entry and exit
• Like perfect competition, under monopolistic competition also, the firms can enter or exit freely.
• The firms will enter when the existing firms are making super-normal profits.
• With the entry of new firms, the supply would increase which would reduce the price and hence the existing firms will be left only with normal profits.
• Similarly, if the existing firms are sustaining losses, some of the marginal firms will exit. It will reduce the supply due to which price would rise and the existing firms will be left only with normal profit. But the entry is not as easy as in Perfect Competitive Market
• Each firm independently sets the terms of exchange for its product.
• The firm gives no consideration to what effect its decision may have on competitors.
• The theory is that any action will have such a negligible effect on the overall market demand that a firm can act without fear of prompting heightened competition. In other words, each firm feels free to set prices as if it were a monopoly rather than an oligopoly.
(v) Independent decision making
(vi) Lack of perfect knowledge
• Both buyers and sellers have no perfect knowledge about the market condition
• Persuasive advertisement creates artificial superiority in the minds of the consumer
• As a result a particular brand of a particular firm is preferred by the consumer
(vii) Non –Price Competition
• Non-price competition is a marketing strategy "in which one firm tries to distinguish its product or service from competing products on the basis of attributes like design and workmanship"
• Non-price competition typically involves promotional expenditures (such as advertising, selling staff, the locations convenience, sales promotions, coupons, special orders, or free gifts), marketing research, new product development, and brand management costs.
• A monopolistic competitive firm is able to compete in non-price form as it deals
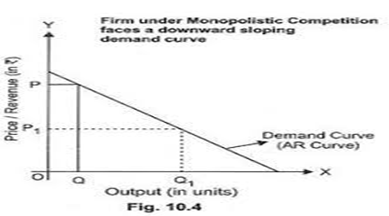
Demand curve under Monopolistic Competition:
The demand curve of a monopolistic competitive market slopes downward. This means that a monopolistic firm can sell more output only by reducing its prices. While this appears to be relatively straightforward, the shape of the demand curve has several important implications for firms in a monopolistic competitive market.
• The downward slope of a monopolistically competitive demand curve signifies that the firms in this industry have market power.
Market power allows firms to increase their prices without losing all of their customers.
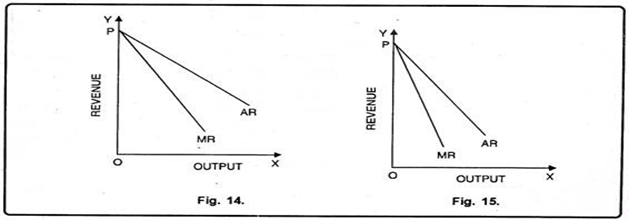
Compare Demand Curve of Monopoly and Monopolistic Competitive Firms
Under monopoly, AR and MR are different. AR refers to price, MR refers to marginal revenue. These curves are less elastic. It means for a small increase in sales (demand), the monopolist has to reduce the price to greater extent. It means revenue curves are less elastic. Fig. 15 shows less elastic AR and MR.
Under monopolistic competition also, the revenue curves are different but in this case, the revenue curves are more elastic. It means small fall in price, will lead to big increase in demand. Fig. 14 represents AR and MR under monopolistic competition.
Oligopoly:
Meaning:
It is a market structure characterized by few big sellers selling homogeneous or differentiated products.
Example: Automobile Industries, Steel Industries
Features:
(i) Few Firms
• In Oligopoly market there are few large firms
• Few means more than one (as case of Monopoly) and less than the number firms as in Monopolistic
• This implies that the firms very powerful in influencing the total output and sales in the market
• The number is very small due to many legal and technical barriers to entry in the form of Govt. licensing , Parent rights, control over raw materials etc.
(ii) Interdependence:
• The distinctive feature of an oligopoly is interdependence.
• Oligopolies are typically composed of a few large firms.
• Each firm is so large that its actions affect market conditions.
• Therefore, the competing firms will be aware of a firm's market actions and will respond appropriately.
• This means that in contemplating a market action, a firm must take into consideration the possible reactions of all competing firms and the firm's countermoves
(iii) Price Rigidity / Non-Price Competition
Though Oligopoly firms have the power to influence the market price but they avoid price war and tends to p[rice rigidity due to the following reasons
• If one firm feels that a price increase would generates higher profits and therefore increases the price at which it sells its output , other firms do not follow. The price increase would therefore lead to a huge fall in the quantity sold by the firm leading to a fall in its revenue and profit. It is therefore not rational for any firm to increase the price.
•On the other hand, a firm may estimate that it could earn a large revenue and profit by selling a large quantity of output and therefore lowers the price. Other firms would perceive this action as a threat and therefore follow thye first firm and lower their prices as well. The increase in the total quantity sold due to lowering price is therefore shared by all firms and the firm that had initially lowered the price is able to achieve only a small increase in the quantity it sells.
(iv) Group behaviour:
• Under oligopoly, there is complete interdependence among different firms.
• So, price and output decisions of a particular firm directly influence the competing firms.
• Instead of independent price and output strategy, oligopoly firms prefer group decisions that will protect the interest of all the firms.
• Group Behaviour means that firms tend to behave as if they were a single firm even though individually they retain their independence.
(v) Indeterminateness of demand curve:
• This characteristic is the direct result of the interdependence characteristic of an oligopolistic firm.
• Mutual interdependence creates uncertainty for all the firms.
• No firm can predict the consequence of its price-output policy.
• Under oligopoly a firm cannot assume that its rivals will keep their price unchanged if he makes charge in its own price. As a result, the demand curve facing an oligopolistic firm losses its determinateness.
(vi) Selling Cost
• Selling cost plays an important role in Oligopoly market
• As the oligopoly firm avoid price war they promote their sales through different persuasive advertisements
Types of Oligopoly Market
Oligopoly market may be classified as
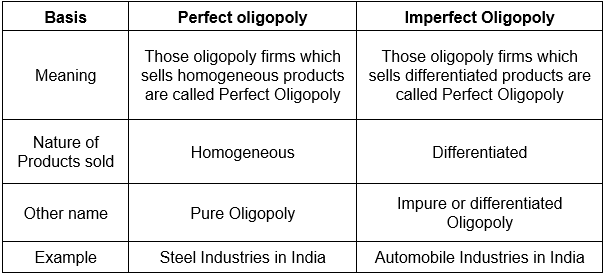
(a) Perfect Oligopoly and Imperfect Oligopoly
(b) Collusive Oligopoly and Non-Collusive Oligopoly
Difference between Perfect Oligopoly and Imperfect Oligopoly
PRICE DETERMINATION UNDER PERFECT COMPETITION
Key Points:
• Under perfect competition equilibrium price and quantity is determined by the interaction of market demand and market supply curve of a commodity
• Market equilibrium is a situation when market supply curve and market demand curve of a commodity intersect each other
• Equilibrium price is the price which is determined by the equality of market demand and market supply of a commodity
• Equilibrium quantity is the quantity which is determined by the equality of market demand and market supply of a commodity
• Market Price is the price prevailed in the market
Determination of market equilibrium
Market equilibrium is determined by the equality of market demand and market supply of a commodity. This can be explained with the help of the following table and diagram
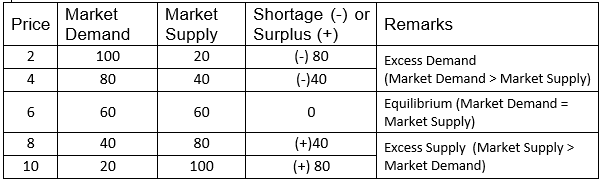
• In this table market equilibrium is achieved when demand = supply = 60 at price 6
• When price is less than 6 , there arise situation of excess demand
• When price is more than 6 there arises situation of excess supply.
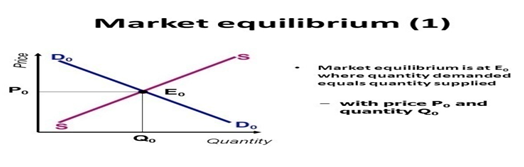
• In the diagram demand curve and supply curve are SS and D0D0 respectively.
• Both intersect at point E0 and this is called the point of equilibrium.
• Accordingly the equilibrium price is Op0 and equilibrium quantity is OQ0
EXCESS DEMAND
• It is a situation in which market demand is greater than market supply
• This situation arises when market price is below the equilibrium price
Chain Effect:
This can be explained through the following diagram
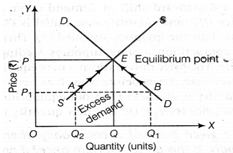
- • In this diagram equilibrium price is OP which is determined by the equality of demand and supply curve at point E
- • When market price is OP1 there arises Excess demand of AB
- • Due to excess demand there is competition among the buyers which leads the price to increase
- • As price increases there is contraction in demand , so there is upward movement along the demand curve as shown by the arrow mark
- • At the same time due to increase in price , there is extension in supply, so there is upward movement along the supply curve as shown by the arrow mark
- • This action and reaction between the buyer and seller will continue till both demand and supply are equal at point E and equilibrium is restored
EXCESS SUPPLY
- • It is a situation in which market supply is greater than market demand
- • This situation arises when market price is above the equilibrium price
Chain Effect:
This can be explained through the following diagram
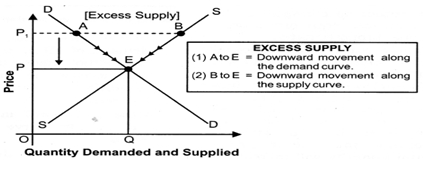
- • In this diagram equilibrium price is OP which is determined by the equality of demand and supply curve at point E
- • When market price is OP1 there arises Excess supply of AB
- • Due to excess supply there is competition among the sellers which leads the price to decrease
- • As price decreases there is contraction in supply , so there is down ward movement along the supply curve as shown by the arrow mark
- • At the same time due to decrease in price , there is extension in demand, so there is down ward movement along the demand curve as shown by the arrow mark
- • This action and reaction between the buyer and seller will continue till both demand and supply are equal at point E and equilibrium is restored
CHANGE IN EQUILIBRIUM PRICE AND QUANTITY
Equilibrium price and quantity will be changed due to change in either demand or supply or change in both. All these cases may be discussed below.
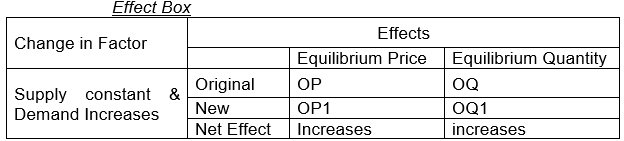
(a) When Market Demand increases and Market Supply remain constant
This can be explained through the following diagram

- • In this diagram market demand curve and supply curve are DD and SS respectively
- • Both intersect at point E and E is called the point of equilibrium
- • Accordingly the equilibrium price is OP and quantity is OQ
- • When demand increase the new demand curve shifts right ward as D1D1 and new equilibrium is E1 and new equilibrium price is OP1 and quantity is OQ1
- • So equilibrium price and quantity both increases
Chain Effects:
- • In this diagram market demand curve and supply curve are DD and SS respectively
- • Both intersect at point E and E is called the point of equilibrium
- • Accordingly the equilibrium price is OP and quantity is OQ
- • When demand increase the new demand curve shifts right ward as D1D1
- • At the prevailing price there is excess demand
- • Due to excess demand there is competition among the buyers which leads the price to increase
- • As price increases there is contraction in demand , so there is upward movement along the demand curve as shown by the arrow mark
- • At the same time due to increase in price , there is extension in supply, so there is upward movement along the supply curve as shown by the arrow mark
- • This action and reaction between the buyer and seller will continue till both demand and supply are equal at point E1 and equilibrium is restored
- • At the same time equilibrium price and quantity both will increase
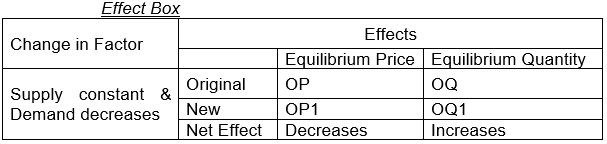
(b) When Market Demand decreases and Market Supply remain constant
This can be explained through the following diagram
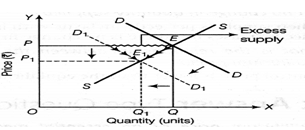
- • In this diagram market demand curve and supply curve are DD and SS respectively
- • Both intersect at point E and E is called the point of equilibrium
- • Accordingly the equilibrium price is OP and quantity is OQ
- • When demand decrease the new demand curve shifts left ward as D1D1 and new equilibrium is E1 and new equilibrium price is OP1 and quantity is OQ1
- • So equilibrium price and quantity both decreases
Chain Effects:
- • In this diagram market demand curve and supply curve are DD and SS respectively
- • Both intersect at point E and E is called the point of equilibrium
- • Accordingly the equilibrium price is OP and quantity is OQ
- • When demand decrease the new demand curve shifts left ward as D1D1
- • At the prevailing price there is excess supply
- • Due to excess supply there is competition among the sellers which leads the price to decrease
- • As price decreases there is contraction in supply , so there is down ward movement along the supply curve as shown by the arrow mark
- • At the same time due to decrease in price , there is extension in demand, so there is down ward movement along the demand curve as shown by the arrow mark
- • This action and reaction between the buyer and seller will continue till both demand and supply are equal at point E and equilibrium is restored
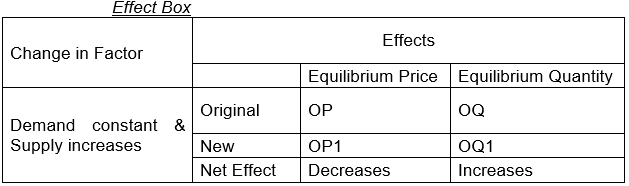
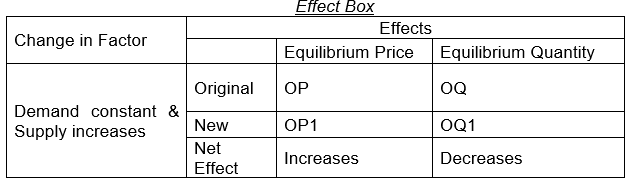
(c) When Market Supply increases and Market demand remain constant
This can be explained through the following diagram
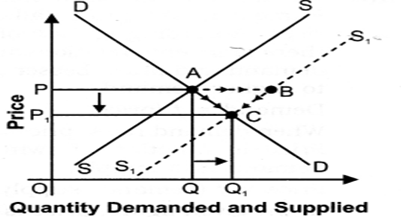
- • In this diagram market demand curve and supply curve are DD and SS respectively
- • Both intersect at point A and A is called the point of equilibrium
- • Accordingly the equilibrium price is OP and quantity is OQ
- • When supply increase the new supply curve shifts right ward as S1S1 and new equilibrium is C and new equilibrium price is OP1 and quantity is OQ1
- • So equilibrium price will decrease and quantity increase
Chain Effects:
- • In this diagram market demand curve and supply curve are DD and SS respectively
- • Both intersect at point A and A is called the point of equilibrium
- • Accordingly the equilibrium price is OP and quantity is OQ
- • When supply increase the new supply curve shifts right ward as S1S1
- • At the prevailing price there is excess supply of AB
- • Due to excess supply there is competition among the sellers which leads the price to decrease
- • As price decreases there is contraction in supply , so there is down ward movement along the supply curve as shown by the arrow mark
- • At the same time due to decrease in price , there is extension in demand, so there is down ward movement along the demand curve as shown by the arrow mark
- • This action and reaction between the buyer and seller will continue till both demand and supply are equal at point E and equilibrium is restored
(d) When Market Supply decreases and Market demand remain constant
This can be explained through the following diagram
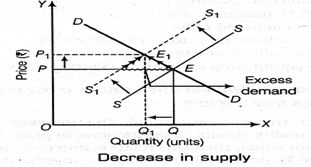
- • In this diagram market demand curve and supply curve are DD and SS respectively
- • Both intersect at point E and E is called the point of equilibrium
- • Accordingly the equilibrium price is OP and quantity is OQ
- • When supply decrease the new supply curve shifts left ward as S1S1 and new equilibrium is E1 and new equilibrium price is OP1 and quantity is OQ1
- • So equilibrium price will increase and quantity decrease
Chain Effects:
- • In this diagram market demand curve and supply curve are DD and SS respectively
- • Both intersect at point E and E is called the point of equilibrium
- • Accordingly the equilibrium price is OP and quantity is OQ
- • When supply increase the new supply curve shifts left ward as S1S1
- • At the prevailing price there is excess demand
- • Due to excess demand there is competition among the buyers which leads the price to increase
- • As price increases there is contraction in demand , so there is upward movement along the demand curve as shown by the arrow mark
- • At the same time due to increase in price , there is extension in supply, so there is upward movement along the supply curve as shown by the arrow mark
- • This action and reaction between the buyer and seller will continue till both demand and supply are equal at point E1 and equilibrium is restored
- • At the same time equilibrium price and quantity both will increase
SIMULTANEOUS CHANGE IN BOTH DEMAND AND SUPPLY
When there is simultaneous change in both demand and supply there may be different possibilities
(A) Both demand and supply increases
When both increases there are three possibilities
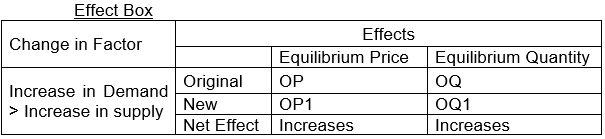
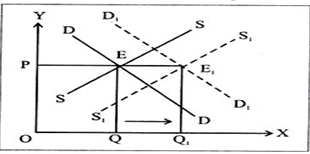
Increase in demand > Increase in Supply
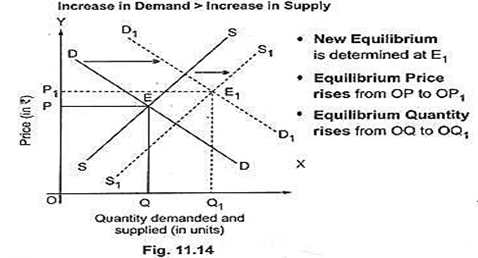
- • In this diagram market demand curve and supply curve are DD and SS respectively
- • Both intersect at point E and E is called the point of equilibrium
- • Accordingly the equilibrium price is OP and quantity is OQ
- • When demand and supply both increases and increase in demand is more than increase in supply the new demand and supply curve are D1D1 and S1S1 respectively and both intersect at point E1 and new equilibrium is at E1
- • Accordingly the new equilibrium price is OP1 and quantity is OQ1
- • Hence both price and quantity will increase
(i) Increase in demand < Increase in Supply
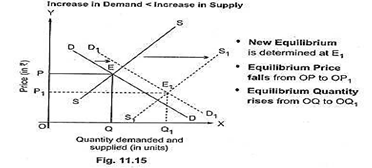
Case may be explained as of above

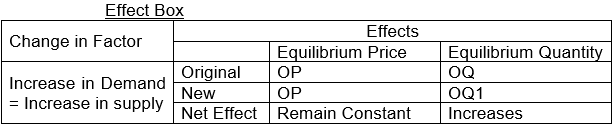
(ii) Increase in demand = Increase in Supply
Case may be explained as of above
(B) Both demand & Supply Decreases
When both decreases there are three possibilities
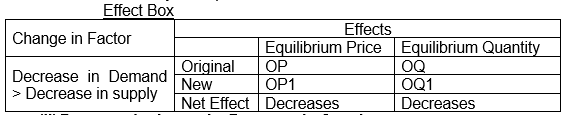
(i) Decrease in demand > Decrease in Supply
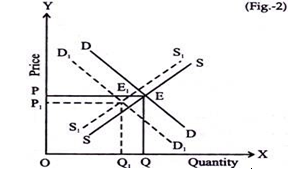
Case may be explained as of above
(ii) Decrease in demand < Decrease in Supply
Case may be explained as of above
(iii) Decrease in demand = Decrease in Supply
Case may be explained as of above
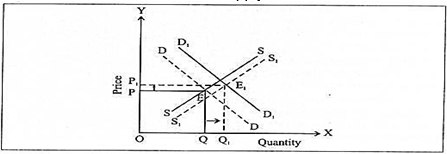
(c )Demand Increases and Supply Decreases
There are three possibilities
(i) Increase in Demand > Decrease in Supply
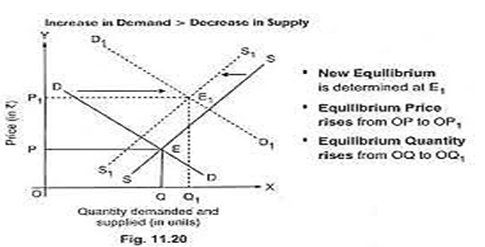
Case may be explained as of above

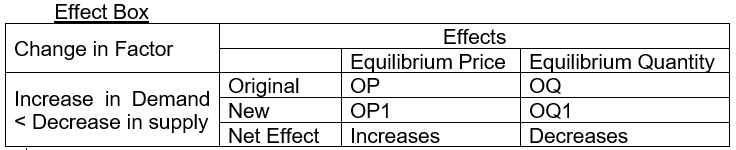
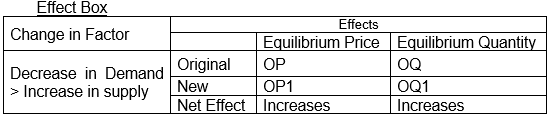
(ii) Increase in Demand < Decrease in Supply
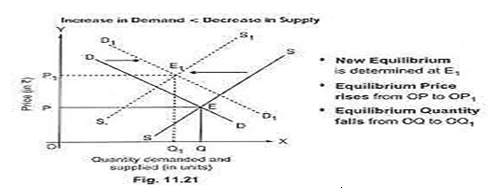
Case may be explained as of above
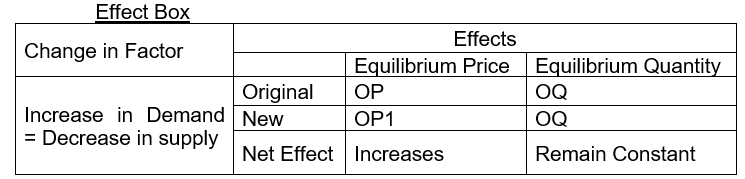
(iii) Increase in Demand = Decrease in Supply
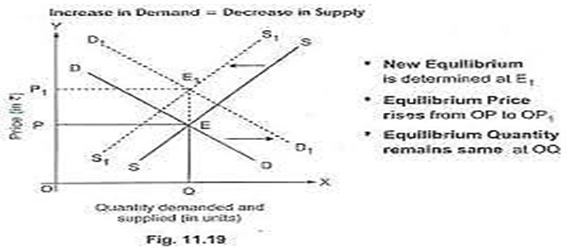
Case may be explained as of above
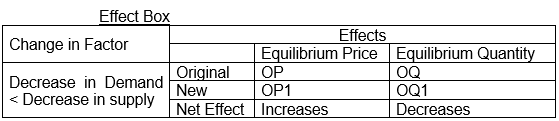
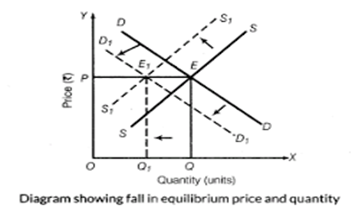
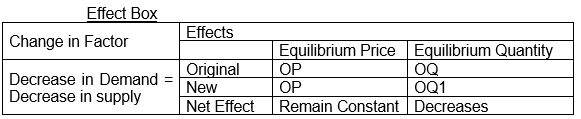
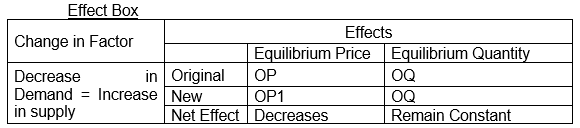
(D) Demand Decreases and Supply Increases
There are three possibilities
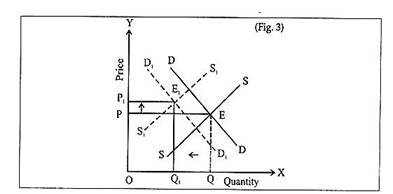
(i) Decrease in Demand > Increase in Supply
Case may be explained as of above
(ii) Decrease in Demand < Increase in Supply
Case may be explained as of above

(iii) Decrease in Demand = Increase in Supply
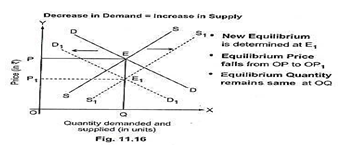
Case may be explained as of above
Free study material for Economics
CBSE Class 12 Economics Part B Macroeconomics Chapter 2 National Income Accounting Study Material
Students can find all the important study material for Part B Macroeconomics Chapter 2 National Income Accounting on this page. This collection includes detailed notes, Mind Maps for quick revision, and Sure Shot Questions that will come in your CBSE exams. This material has been strictly prepared on the latest 2026 syllabus for Class 12 Economics. Our expert teachers always suggest you to use these tools daily to make your learning easier and faster.
Part B Macroeconomics Chapter 2 National Income Accounting Expert Notes & Solved Exam Questions
Our teachers have used the latest official NCERT book for Class 12 Economics to prepare these study material. We have included previous year examination questions and also step-by-step solutions to help you understand the marking scheme too. After reading the above chapter notes and solved questions also solve the practice problems and then compare your work with our NCERT solutions for Class 12 Economics.
Complete Revision for Economics
To get the best marks in your Class 12 exams you should use Economics Sample Papers along with these chapter notes. Daily practicing with our online MCQ Tests for Part B Macroeconomics Chapter 2 National Income Accounting will also help you improve your speed and accuracy. All the study material provided on studiestoday.com is free and updated regularly to help Class 12 students stay ahead in their studies and feel confident during their school tests.
FAQs
Our advanced study package for Part B Macroeconomics Chapter 2 National Income Accounting includes detailed concepts, diagrams, Mind Maps, and explanation of complex topics to ensure Class 12 students learn as per syllabus for 2026 exams.
The Mind Maps provided for Part B Macroeconomics Chapter 2 National Income Accounting act as visual anchors which will help faster recall during high-pressure exams.
Yes, teachers use our Class 12 Economics resources for lesson planning as they are in simple language and have lot of solved examples.
Yes, You can download the complete, mobile-friendly PDF of the Economics Part B Macroeconomics Chapter 2 National Income Accounting advanced resources for free.
Yes, our subject matter experts have updated the Part B Macroeconomics Chapter 2 National Income Accounting material to align with the rationalized NCERT textbooks and have removed deleted topics and added new competency-based questions.