
Read and download the CBSE Class 12 Economics Determination of Income and Employment Revision Notes. Designed for 2026-27, this advanced study material provides Class 12 Economics students with detailed revision notes, sure-shot questions, and detailed answers. Prepared by expert teachers and they follow the latest CBSE, NCERT, and KVS guidelines to ensure you get best scores.
Advanced Study Material for Class 12 Economics Part B Macroeconomics Chapter 4 Determination of Income and Employment
To achieve a high score in Economics, students must go beyond standard textbooks. This Class 12 Part B Macroeconomics Chapter 4 Determination of Income and Employment study material includes conceptual summaries and solved practice questions to improve you understanding.
Class 12 Economics Part B Macroeconomics Chapter 4 Determination of Income and Employment Notes and Questions
Explain equilibrium level of national income using saving and investment approach.
Draw a diagram in support of your explanation.
The equilibrium level of income and output is that level at which planned saving and planned investment are equal. In the diagram equilibrium is at e and equilibrium income is OY.

At an income level OY1, planned savings are greater than planned investment. This means that household’s aggregate expenditure is less than output.as a result inventories increase. Firms, seeing a buildup of unplanned inventories start cutting production, and hence output, income and savings fall. This process continues till planned investments are equal.
At an income level OY2 planned savings are less than planned investment. This means that aggregate expenditure is more than output. Firms seeing a depletion of planned inventories step up production, and hence output and income increase. Savings increase. This process continues till planned savings and planned investments are equal.
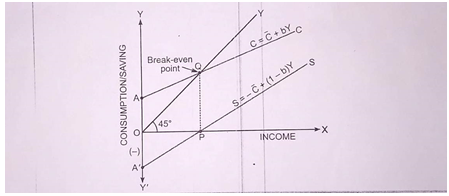
Draw a straight line consumption curve. From it derive a savings curve explaining the process of derivation in this diagram:
(a) The level of income at which Average propensity to consume is equal to one.
(b) A level of income at which Average propensity to save is negative.
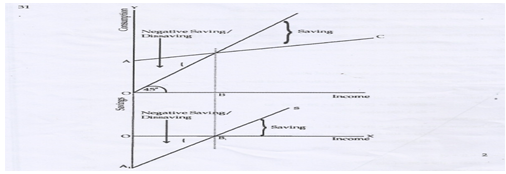
AC is the consumption curve and OA is the consumption expenditure at zero level of income. Income minus investments is savings. When income is 0, the economy’s consumption level is OA. Thus the corresponding level of savings is –OA .so A is the starting point of saving curve .At OB level of income consumption is equal to income so savings are 0 so B1 is another point on saving curve. Joining A and B and extending we get the saving curve S.
- The level of income at which APC is equal to one is OB.
- A level of income at which APS is negative is the level less than OB.

Explain the working of a multiplier with an example.
Ans. Multiplier tells us what will be the final change in the income, as a result of change in investment. Change in investment results in the change in income. Symbolically:
The working of a multiplier can be explained with the help of the following table which is based on the consumption that is, AI-1000 and MPC=4/5.
PROCESS OF INCOME GENERATION.
As per the table the initial increase in the investment of Rs 1000 there is a total increase in the income by Rs 5000 given MPC=4/5 . Out of this total increase in the income Rs 4000 will be consumed and Rs 5000 be saved. The sum of total increase in income is also derived as: Ay=1000+800-640+512+ infinity. The equilibrium level of income is s 300 core and at this point S (100) =i (100) the equilibrium may necessarily not be at the full employment level.
When saving exceeds planned investment means people are consuming less and spending more as a result AD is less than AS. This will lead to accumulation of more goods with producer .this will make the businessmen to reduce production consequently, output, income & employment will be reduced till the equilibrium level of income.
Draw a hypothetical propensity to consume curve from it draw the propensity curve to save curve
Ans. APC=C/Y APS=S/Y
Propensity to save curve
Is drawn from propensity to consume curve
When Y=C APC=1
Till that point APS is negative at point's'
When y>c there is a positive saving

Explain the determination of income and employment with AD and AS. (Give schedule)
AD=C+I
AS=C+S AS=Y (refers to countries national income)
The equilibrium level of income is determined at a point when AD=AS.
Equilibrium can be achieved at full employment and even at under employment situation. It may not be always at full employment condition in an economy.
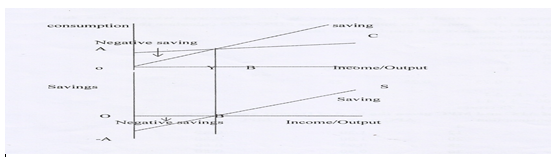
Ac is the consumption curve and OA is the consumption expenditure at zero level of income. Income minus consumption is saving. When income is 0, the economy's consumption level is OA. The corresponding level of saving is -OA.
So -a is the starting point of saving curve. At OB level of income consumption is equal to income, so saving are zero, so B is another point on saving curve . Join A and B and extend this line to S, AS is the saving curve.
a) The level of income at which APC is equal to one is OB.
b) A level of income at which APS is negative OY.
HOTS questions
Explain the equilibrium level of income determination with the help of savings and investment curves OR Explain multiplier with a diagram.
The equilibrium level of national income is that level at which planned saving and planed investment are equal. In the diagram equilibrium is at E and equilibrium income is OY*.
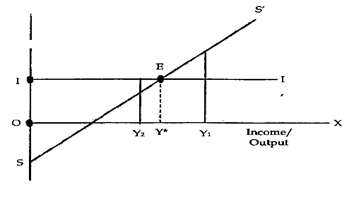
At an income level OY, planned savings are greater than planned investment. This means that household’s aggregate expenditure is less than income. As a result inventories increase. Firms, seeing a buildup of unplanned inventories start cutting production, and hence output, income and savings fall. This process continues till planned savings and planned investment are equal. At an income level OY2, planned savings are less than planned investment. This means that aggregate expenditure is more than income. Firms, seeing depletion of planned inventories step up production, and hence output and income increase. Savings increase. This process continues till planned savings and planned investment are equal.
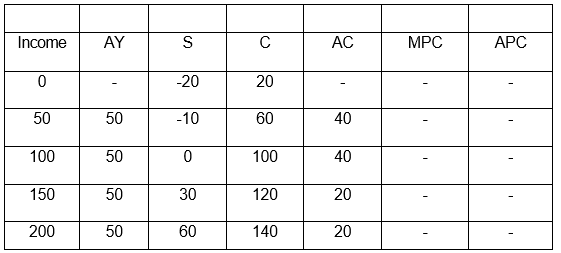
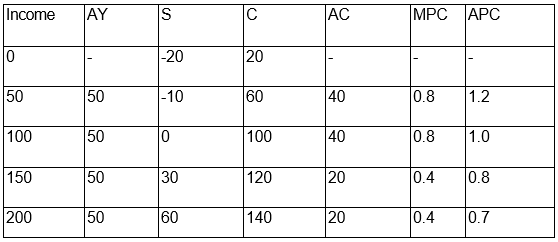
Complete the following Table
Derive a savings curve from consumption curve with the help of a diagram.
AC is the consumption curve and OA is the consumption expenditure at zero level of income. Income minus consumption is savings. When income is zero, the economy's consumption level is OA. Thus, the corresponding level of savings is - OA.
So, A1 is the starting point of saving curve At OB level of income consumption is equal to income, so savings are zero. So Bi is another point on saving curve Joining Ai and Bi and extending we get the saving curve S. The level of income at which APC is equal to one is OB A level of income at which APS is negative is the level less than OB.
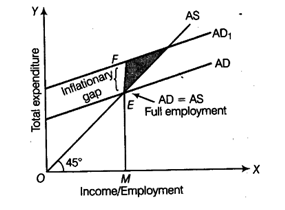
Explain the concept of Inflationary gap with the help of a diagram.
ANS: Inflationary gap is the excess of aggregate demand over and above its level required to maintain full employment equilibrium in the economy. Full employment equilibrium is struct at point E. If the level of demand of employment increases to AD1, it is the excess of what is required to maintain full employment. This causes inflation. Hence the difference between AD1 and AD (EF) is called inflationary gap .
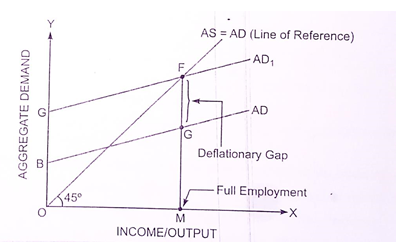
Deflationary gap is the deficiency of AD required to maintain full employment equilibrium .Fulex ployment equilibrium as struck at point E .however, if the level of demand happens tobe AD , it is short of of its full employment level. Accordingly, deflationary gap occurs to the tune of AD1-AD= FG.
Outline the steps required to be taken in deriving saving curve from the given consumption curve . Use diagram.
ANS:
Explain the meaning of Underemployment equilibrium . Explain two measures
by which full employment equilibrium will be reached .
ANS: Underemployment equilibrium refers to the situation where AD= AS but all those who are able to work and willing to work(at the existing wage rate) do not get work.
Figure explain the situation of underemployment equilibrium.
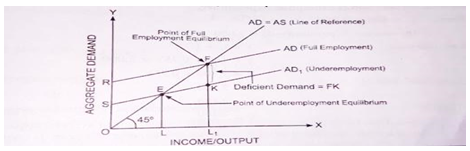
Underemployment equilibrium occurs owing to deficient demand or the lack of aggregate demand(AD). In Figure, deficient demand is equal to FK. Accordingly, this can be addressed by way of increasing AD. Two important measures to raise AD and reach the situation of full employment areas
under:
(i) Public expenditure on public works, public welfare and public investment should be increased. All this will act as an injection of demand into the system and is expected to induce private
expenditure. Accordingly, aggregate demand is expected to rise and the situation of full employment equilibrium will be reached
(ii) Central bank should decrease the repo rate. It is the rate at which the central bank lends money to the commercial banks. A decrease in repo rate lowers the market rate of interest, promoting a rise in demand for credit. An expansion in the demand for credit leads to a rise in aggregate demand. Accordingly, the situation of full employment equilibrium will be reached.
Explain the situation of deficit demand in an economy with the help of a diagram.
ANS: Deficient demand refers to a situation when AD < AS ( corresponding to full employment level in the economy ).
Accordingly , there is a deflationary gap in the economy.
Figure illustrates the situation.
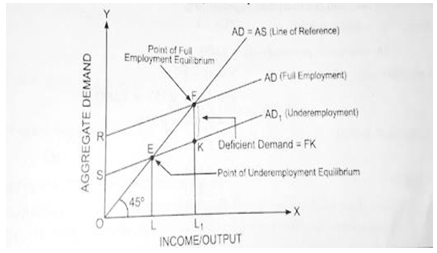
Full employment level of demand is indicated be AD1 (Intersecting the line at point F , the point of full employment equilibrium).
If demand level happens to be AD2 , the gap between AD1 and AD2 is equal to FG which is situation of deficient demand.
Explain the situation of excess demand in an economy with the help of a diagram.
ANS: Excess demand refers to a situation when AD> S (corresponding to full employment level) Accordingly , there is inflationary gap in the economy.
In figure , full employment requires FM level of aggregate demand . But it happens to be EM as shown in the figure .Accordingly, excess demand is equal to EF , which is known as Inflationary gap.
BALANCE OF PAYMENTS
1. Explain Determination of Equilibrium Foreign Exchange Rate with the help of diagram.
The price of a foreign currency in the foreign exchange market, is determined in the same way as the price of a commodity is determined in a market.
It is determined by Demand and Supply of Foreign Exchange. Exchange Rate is Determined – Foreign Exchange Rate of a currency is determined by the forces of demand or supply.
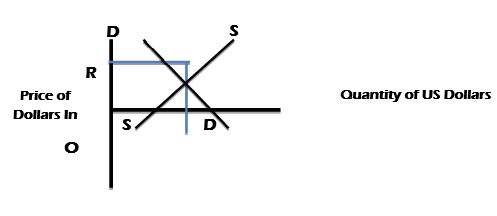
Equilibrium Exchange Rate – It is determined at a point where demand and supply of foreign exchange are equal.
OQ= Quantity of US Dollars
There is Inverse Relationship between Price of foreign exchange & Demand for foreign exchange.
High Exchange Rate –Less Demand
Lower Exchange Rate- More demand
When Foreign Exchange Rate falls there is more demand for Foreign Currency.
US Dollars from Rs. 50 to Rs. 45 which means less Rupees are needed to buy 1 Dollar. Therefore, imports increases.
(ii) It promotes tourisms to Foreign country (as dollar has become cheaper in comparison to Rupees ) .There is direct relationship between supply to Foreign Currency and Price of Foreign Currency, when price increase –supply increase, when price decrease -supply decrease. Therefore, downwards supply when Foreign Exchange Rate increases and supply also increases. US Dollar rises from Rs. 50 to Rs. 60 its supply also increases because home country’s goods (India) become cheaper to Foreign and export increases.
Free study material for Economics
CBSE Class 12 Economics Part B Macroeconomics Chapter 4 Determination of Income and Employment Study Material
Students can find all the important study material for Part B Macroeconomics Chapter 4 Determination of Income and Employment on this page. This collection includes detailed notes, Mind Maps for quick revision, and Sure Shot Questions that will come in your CBSE exams. This material has been strictly prepared on the latest 2026 syllabus for Class 12 Economics. Our expert teachers always suggest you to use these tools daily to make your learning easier and faster.
Part B Macroeconomics Chapter 4 Determination of Income and Employment Expert Notes & Solved Exam Questions
Our teachers have used the latest official NCERT book for Class 12 Economics to prepare these study material. We have included previous year examination questions and also step-by-step solutions to help you understand the marking scheme too. After reading the above chapter notes and solved questions also solve the practice problems and then compare your work with our NCERT solutions for Class 12 Economics.
Complete Revision for Economics
To get the best marks in your Class 12 exams you should use Economics Sample Papers along with these chapter notes. Daily practicing with our online MCQ Tests for Part B Macroeconomics Chapter 4 Determination of Income and Employment will also help you improve your speed and accuracy. All the study material provided on studiestoday.com is free and updated regularly to help Class 12 students stay ahead in their studies and feel confident during their school tests.
FAQs
Our advanced study package for Part B Macroeconomics Chapter 4 Determination of Income and Employment includes detailed concepts, diagrams, Mind Maps, and explanation of complex topics to ensure Class 12 students learn as per syllabus for 2026 exams.
The Mind Maps provided for Part B Macroeconomics Chapter 4 Determination of Income and Employment act as visual anchors which will help faster recall during high-pressure exams.
Yes, teachers use our Class 12 Economics resources for lesson planning as they are in simple language and have lot of solved examples.
Yes, You can download the complete, mobile-friendly PDF of the Economics Part B Macroeconomics Chapter 4 Determination of Income and Employment advanced resources for free.
Yes, our subject matter experts have updated the Part B Macroeconomics Chapter 4 Determination of Income and Employment material to align with the rationalized NCERT textbooks and have removed deleted topics and added new competency-based questions.