
Read and download the CBSE Class 12 Economics Consumers Equilibrium and Demand Revision Notes. Designed for 2026-27, this advanced study material provides Class 12 Economics students with detailed revision notes, sure-shot questions, and detailed answers. Prepared by expert teachers and they follow the latest CBSE, NCERT, and KVS guidelines to ensure you get best scores.
Advanced Study Material for Class 12 Economics Part A Microeconomics Chapter 2 Theory of Consumer Behaviour
To achieve a high score in Economics, students must go beyond standard textbooks. This Class 12 Part A Microeconomics Chapter 2 Theory of Consumer Behaviour study material includes conceptual summaries and solved practice questions to improve you understanding.
Class 12 Economics Part A Microeconomics Chapter 2 Theory of Consumer Behaviour Notes and Questions
POINTS TO REMEMBER:-
Consumer: is an economic agent who consumes final goods and services to satisfy wants.
Utility:- It is the want satisfying power of a commodity. This is measured in terms of ‘utils’-
Utility can be of two types.
(a) Total Utility:- TU is the sum total of satisfaction that the consumer derives when a certain number of units of a particular commodity are consumed.
Tux= f(Qx) or TU = ∑ MU
(b) Marginal Utility:- It is a change in total utility by consuming an additional unit of a commodity or in other words MU is the additional satisfaction derived from the consumption of an additional unit of the commodity.
MUn = TUn – TUn-1
Alternatively: MUx= ∆ TUx/ ∆/Qx
Law of Diminishing Marginal Utility : As consumer consumes more and more units of commodity, the Marginal utility derived from the each successive unit goes on declining.
Consumer Equilibrium :-Consumer equilibrium refers to a situation when a consumer maximizes her satisfaction out of her given money income and the price of the desired good(s) and there is no tendency to deviate from that situation.
Conditions of consumer equilibrium
In case of one good:
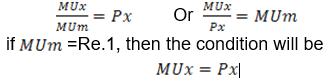
MUx/PX=Mum or MUx / MUm=PX or Mux=PX
Let the consumer consume a good X and its price is and MU derived from it is .
The condition of consumer equilibrium will be
ORDINAL UTILITY ANALYSIS (IC ANALYSIS)
Introduction:
Two English economists J. R. Hicks and R.G.D. Allen fired heavily shells at cardinal utility theory and propounded indifference curve approach based upon the notion of ordinal utility. It implies that utility being psychological concepts cannot be measured cardinally rather they can be ranked. Indifference Curve method was evolved to supersede the cardinal utility analysis of demand.
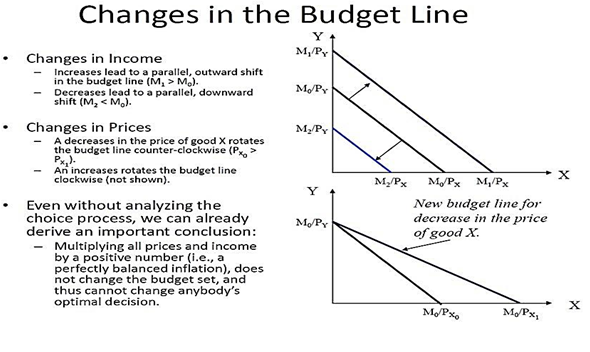
Budget set/ Budget Space:
Budget set is the collection of all those consumption bundles which costs the consumer exactly equal or strictly less than two her money income. Mathematically:
P1x1+P2x2 ≤ M
Budget Line/ Price Line:
It is the locus of points of all those consumption bundles which costs the consumer exactly equal to her money income. Mathematically:
P1x1+P2x2 = M
(i) Monotonic preferences:
A consumer’s preference is said to be monotonic if and only if the preferred bundle consists of more of at least one good and no less of the other good in comparison to the non-preferred bundle.
INDIFFERENCE CURVE (IC) :
Indifference Curve (IC) is the locus of points of all those consumption bundles among which the consumer’s preference is indifferent. In other wards it is the locus of points of all the consumption bundles which gives the consumer equal level of satisfaction.
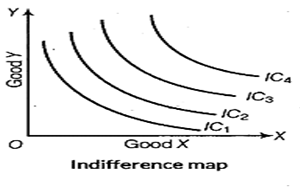
Indifference Map:
It is the family (Collection) of indifference curves
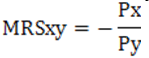
Marginal Rate of Substitution (MRS):
MRS is the rate of sacrifice of one good in order to consume an additional unit of another good along an Indifference curve. This can be under stood from the following table and diagram.
It is measured by
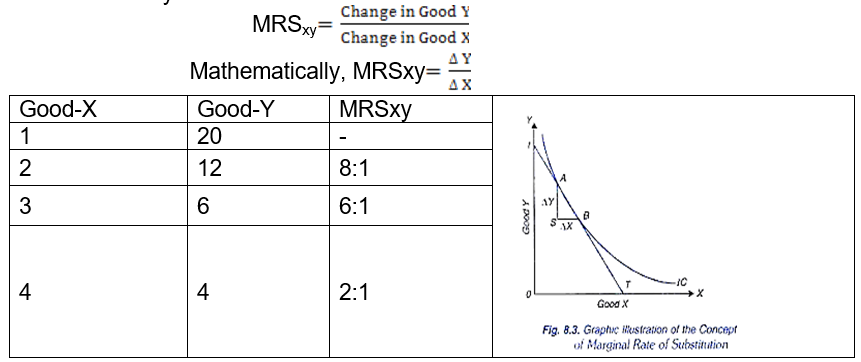
This MRS xy is nothing but the slope of the Indifference Curve.
Properties of Indifference Curve:
(a) Indifference curve is downward sloping from left to right
(b) Indifference curve is convex to the point of origin
(c) Higher IC represents higher level of satisfaction
(d) Two IC’s can never intersect each other
Consumer’s equilibrium by IC Analysis (Hicks and Allen approach) Conditions:
- First order/Necessary Conditions:
Or, Slope of IC = Slope of Budget Line
Or, Budget Line is tangent to the IC
- Second Order / Sufficient Conditions:
At the point of tangency IC must be convex to the point of origin Or , MRSxy must be diminishing
DEMAND
Introduction:
We are interchangeably using the word desire , want and demand. In a layman’s point of view demand means effective desire to have a commodity backed by willingness to pay and ability to pay.

In economics demand is something different. The demand for a commodity is essentially consumer’s attitude and reaction towards that commodity. This consumer’s attitude gives rise to actions in purchasing a certain number of units of a commodity at various given prices.
Meaning:
Demand refers to various quantities of a particular commodity that a consumer is ready to buy at different prices.
Types of demand:
Demand is two types:
- Individual demand
- Market demand
Individual demand -It refers to various quantities of a particular commodity that a particular consumer is ready to buy at its various possible prices
Determinants
Followings are the determinants of individual demand
• Own price: when price of commodity is fall its quantity demand increases and when its price rises its quantity demand decrease
• Price of related goods: the quantity demand of a commodity is affected by the price of its related commodity. Like its substitutes and complementary goods
• Substitute Goods: Two goods are called substitute to each other when price of one good and quantity demand of the other varies directly with each other. In simple language those goods which are used one in others place are called substitute typo each other. Ex: Tea and Coffee
• Complementary Goods: Two goods are called complementary to each other when price of one good and quantity demand of the other varies inversely with each other. In simple language those goods which are used jointly are called substitute typo each other. Ex: Tea and Sugar
• Income of the consumer: When income of a consumer rises its quantity demand will increase and when income falls its quantity demand decreases
• Tastes and preferences: if a commodity is in fashion or preferred by the consumer then its demand will increase and if it is out of fashion its demand will decrease.
Demand schedule:
Tabular representation of various quantities of a particular commodity that a particular consumer is ready to buy at its various possible prices is called a demand schedule.
Demand curve:
Graphic representation of a demand schedule which represents various quantities of a particular commodity that a particular consumer is ready to buy at its various possible prices is called a demand curve
Demand Function:
Functional relationship between quantity demand of a commodity and its various determinants
qx = f(Px,Pr,I,T)
qx = Quantity demand of commodity-X , Px= Price of commodity X , Pr = Price of related commodity of X , I = Income of the consumer , T = Taste of the consumer
but in general we keep other determinants constant and draw the relationship between price of a commodity and its quantity demand
q = f(p)
In a typical linear equation the demand equation is
q = a-bp
Here a is the vertical intercept and (-) b is the slope of the demand curve: (-)
![]() (Rate at which q changes with respect to p)
(Rate at which q changes with respect to p)
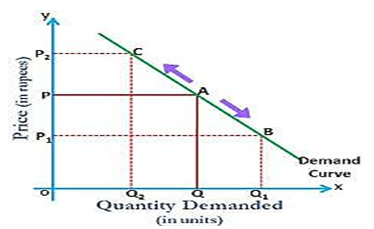
Slope of a demand curve:
♦ Slope of the demand curve measures the rate at which demand changes with respect to its price
♦ Slope of a curve is derived by the ratio of change in the dependent variable to change in the independent variable and through a graph by the ratio of change in the variable in vertical axis to change in the variable in horizontal axis
♦ Generally we take the independent variable in horizontal axis and dependent variable in vertical axis But in case of the demand curve we are taking the reverse
♦ So the demand curve is an inverse demand curve ,Therefore its slope as per the curve is the inverse as per the equation
Market demand:
It refers to various quantities of a particular commodity that all consumers in the market are ready to buy at its various possible prices. It is the summation of individual demands.
![]()
Law of demand
Statement:
Other things remaining constant (Ceteris Paribus) when price of a commodity rises its quantity demand decreases and when price of a commodity falls its quantity demand decreases
Assumptions:
• Income of the consumer remain constant
• Price of the substitute and complementary goods remain constant
• Taste and preferences of the consumer remain constant
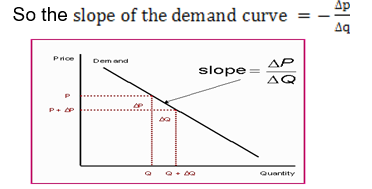
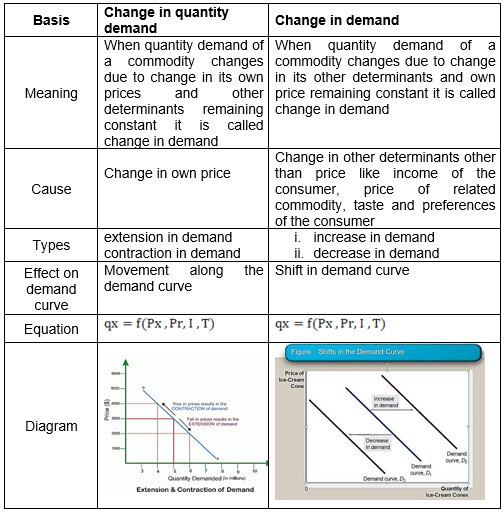
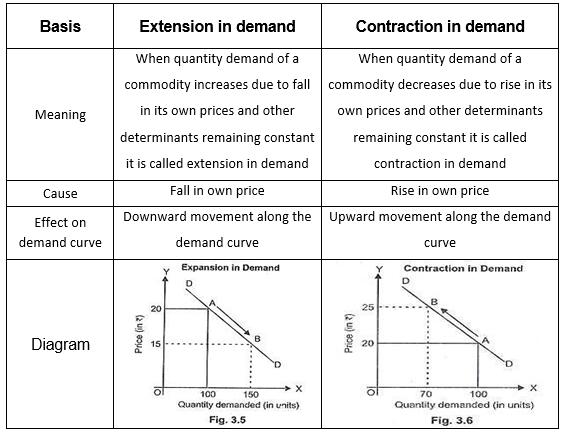
Change in quantity demanded: (Movement along the demand curve)
When quantity demand of a commodity changes due to change in its own prices and other determinants remaining constant it is called change in demand
This is of two types:
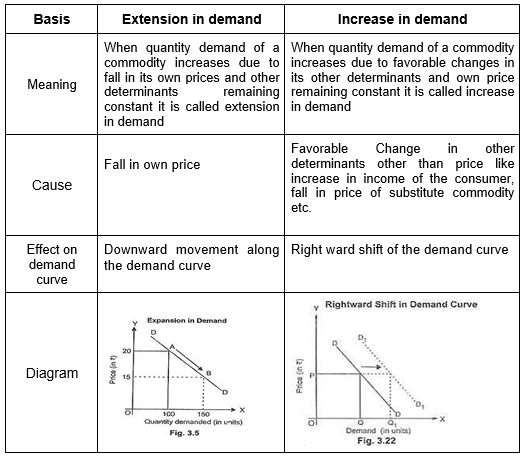
(a) Expansion/extension in demand:
• When quantity demand of a commodity increases due to fall in its price in this case there is upward movement along the demand curve
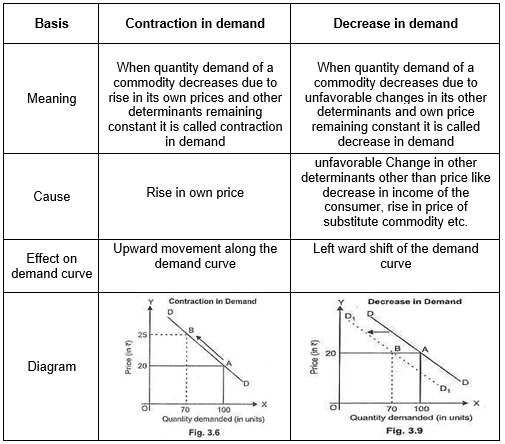
(b) Contraction in demand:
• When quantity demand of a commodity increases due to fall in price in this case there is upward movement along the demand curve
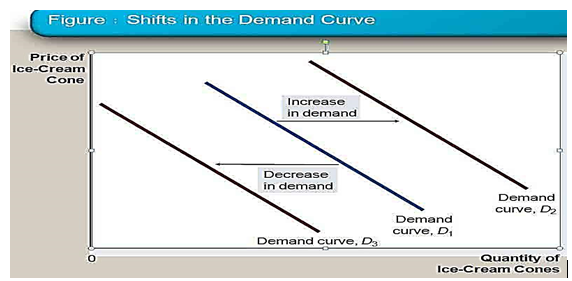
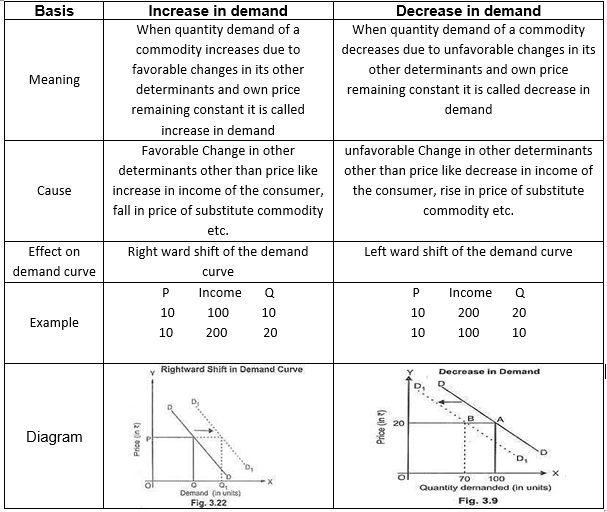
Change in demand (Shift in demand curve)
When quantity demand of a commodity changes due to change in its other determinants and own price remaining constant it is called change in demand
Types:
This is of two types:
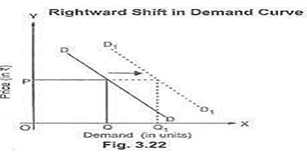
(i) Increase in demand:
♦ When quantity demand of a commodity increases due to favorable change in its other determinants like income , price of related commodity and own price remaining constant
♦ In this case there is right ward parallel shift of the demand curve
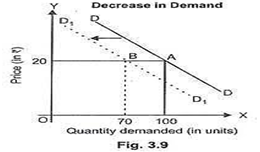
(ii) Decrease in demand:
♦ When quantity demand of a commodity decreases due to unfavorable change in its other determinants like income , price of related commodity and own price remaining constant
♦ In this case there is left ward parallel shift of the demand curve
Distinction between change in demand and change in quantity demand
Distinction between extension in demand and increase in demand
Distinction between contraction in demand and decrease in demand
Distinction between extension in demand and contraction in demand
Distinction between increase in demand and decrease in demand
Effect of change in income of the consumer on quantity demand of a commodity
The effect of change in income of a commodity on quantity demand of a commodity can be explained in case of two types of commodity
Case-I: Normal good:
Meaning:
A good is called normal good when its quantity demand varies directly with change in income of the consumer. It implies that when income of the consumer rises its quantity demand increase and when income of the consumer falls its quantity demand decrease. For example good quality rice
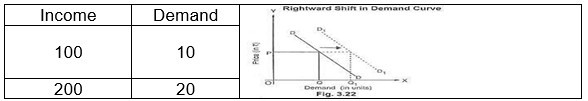
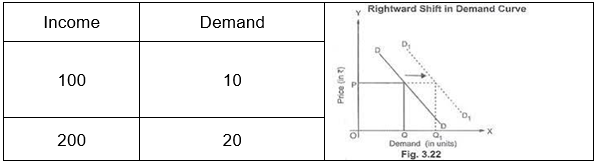
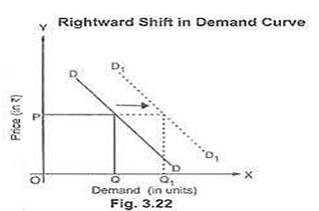
The effect on change income can be explained for the two cases When income increases:
• In this table when the income of the consumer increase from 100 to 200 units its quantity demand increase from 10 to 20 units
• In the diagram the original demand curve is D
• When income increased the demand curve shifts rightward as D1
This implies there is increase in demand
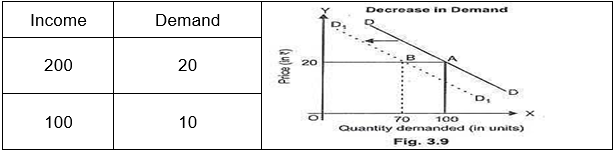
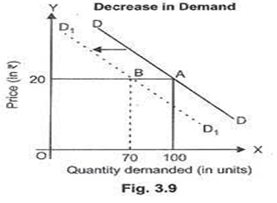
When income decreases
• In this table when the income of the consumer decrease from 200 to 100 units its quantity demand decrease from 20 to 10 units
• In the diagram the original demand curve is D
• When income decreased the demand curve shifts leftward as D1
• This implies there is decrease in demand
Case-II: Inferior good:
Meaning:
A good is called inferior good when its quantity demand varies inversely with change in income of the consumer. It implies that when income of the consumer raises its quantity demand decrease and when income of the consumer falls its quantity demand increase. For example low quality rice
The effect on change income can be explained for the two cases
When income increases:
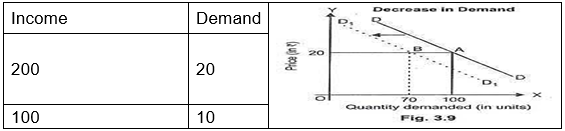
• In this table when the income of the consumer increase from 100 to 200 units its quantity demand decrease from 20 to 10 units
• In the diagram the original demand curve is D
• When income increased the demand curve shifts leftward as D1
• This implies there is decrease in demand
When income decreases
• In this table when the income of the consumer decrease from 200 to 100 units its quantity demand increase from 10 to 20 units
• In the diagram the original demand curve is D
• When income decreased the demand curve shifts rightward as D1
Effect of change in price of related commodity on quantity demand of a commodity
The effect of change in price of related commodity on quantity demand of a commodity can be explained in case of two types of commodities.
Case-I : Substitute / Competitive goods
Meaning:
In a layman’s point of view two goods are called substitute to each other when they are used one in others place.
But in economic sense two goods are called substitute to each other when price of one good and quantity demand of the other varies directly with each other. It implies when price of one good increases quantity demand of the other increases and when price of one good decreases quantity demand of the other decreases. For example: Tea and Coffee, rice and bread, pen and pencil etc
The effect of change in price of substitute good can be explained under the two cases - case of tea and coffee
When price of substitute good increases
• When price of tea increases , the consumer will consume less amount of tea (due to law of demand)
• At the same time price of coffee remaining constant it will became comparative cheaper to tea
• As coffee is used in place of tea so the consumer will substitute tea for coffee
• As result the quantity demand of coffee will increase
• In this diagram the original demand curve of coffee is D
• Due to rise in price of tea the demand curve of coffee will shift rightward as D1
• This implies there is increase in demand
When price of substitute good decreases
• When price of tea decreases, the consumer will consume more amount of tea (due to law of demand)
• At the same time price of coffee remaining constant it will became comparative costlier to tea
• As coffee is used in place of tea so the consumer will substitute coffee for tea
• As result the quantity demand of coffee will decrease
• In this diagram the original demand curve of coffee is D
• Due to fall in price of tea the demand curve of coffee will shift leftward as D1
• This implies there is decrease in demand
Case-II : Complementary / Supplementary goods
Meaning:
In a layman’s point of view two goods are called complementary to each other when they are jointly demanded.
But in economic sense two goods are called complementary to each other when price of one good and quantity demand of the other varies inversely with each other. It implies when price of one good increases quantity demand of the other decreases and when price of one good decreases quantity demand of the other increases. For example: Tea and Sugar, Shoe and Socks, Car and petrol etc.
The effect of change in price of complementary good can be explained under the two cases – case of tea and sugar
When price of complementary good increases
• When price of tea increases , the consumer will consume less amount of tea (due to law of demand)
• As sugar is jointly demanded with tea the demand for sugar will also decreases
• In this diagram the original demand curve of sugar is D
• Due to rise in price of tea the demand curve of sugar will shift leftward as D1
• This implies there is decrease in demand
When price of complementary good decreases
• When price of tea decreases , the consumer will consume more amount of tea (due to law of demand)
• As sugar is jointly demanded with tea the demand for sugar will also increases
• In this diagram the original demand curve of sugar is DD1
• Due to fall in price of tea the demand curve of sugar will shift rightward as D2D3
• This implies there is increase in demand
ELASTICITY OF DEMAND
The Law of demand which you have studied in the last chapter tells you only the direction of change in price and quantity demand of a commodity. It does not tell you about the intensity of relationship between price and quantity demand of a commodity. It is captured by the concept of “Elasticity of Demand”
PRICE ELASTICITY OF DEMAND
Meaning:
It is the degree of responsiveness of change in quantity demand of a commodity due to change in its price.
Properties:
• It is a pure number i.e. free from the unit of measurement
• It is always express with a minus(-) sign as there is inverse relationship between price and quantity demand of a commodity
• The elasticity of demand associated with a flatter demand curve is more in comparison to a steeper demand curve
Degrees of elasticity of demand:
• The extent of responsiveness of demand with change in the price is not always the same.
• The demand for a product can be elastic or inelastic, depending on the rate of change in the demand with respect to change in price of a product.
• Elastic demand is the one when the response of demand is greater with a small proportionate change in the price. On the other hand, inelastic demand is the one when there is relatively a less change in the demand with a greater change in the price.
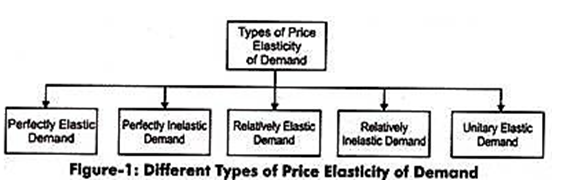
For better understanding the concepts of elastic and inelastic demand, the price elasticity of demand has been divided into five types, which are shown in Figure-1:
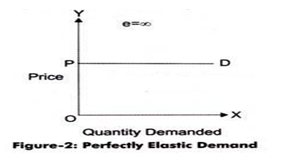
(a) Perfectly Elastic Demand:
• When a small change in price of a product causes a major change in its demand, it is said to be perfectly elastic demand.
• In perfectly elastic demand, a small rise in price results in fall in demand to zero, while a small fall in price causes increase in demand to infinity.
• In such a case, the demand is perfectly elastic or ep = ∞
The degree of elasticity of demand helps in defining the shape and slope of a demand curve. Therefore, the elasticity of demand can be determined by the slope of the demand curve. Flatter the slope of the demand curve, higher the elasticity of demand.
In perfectly elastic demand, the demand curve is represented as a horizontal straight line, which is shown in the following figure 2.
• Though, perfectly elastic demand is a theoretical concept and cannot be applied in the real situation. However, it can be applied in cases, such as perfectly competitive market and homogeneity products. In such cases, the demand for a product of an organization is assumed to be perfectly elastic.
(b) Perfectly Inelastic Demand:
• A perfectly inelastic demand is one when there is no change produced in the demand of a product with change in its price.
• The numerical value for perfectly inelastic demand is zero (ep=0).
In case of perfectly inelastic demand, demand curve is represented as a straight vertical line, which is shown in Figure-3:
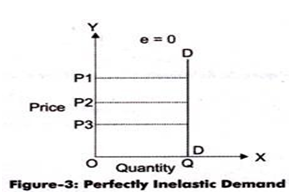
Perfectly inelastic demand is a theoretical concept and cannot be applied in a practical situation. However, in case of essential goods, such as salt, the demand does not change with change in price. Therefore, the demand for essential goods is perfectly inelastic.
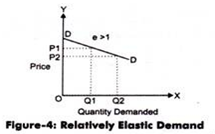
(c) Relatively Elastic/Elastic Demand:
• Relatively elastic demand refers to the demand when the proportionate change produced in demand is greater than the proportionate change in price of a product.
• The numerical value of relatively elastic demand ranges between one to infinity. (ep>1)
The demand curve of relatively elastic demand is gradually sloping, as shown in Figure-4:
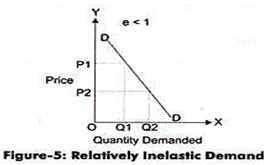
(d) Relatively Inelastic/Inelastic Demand
• Relatively inelastic demand is one when the percentage change produced in demand is less than the percentage change in the price of a product.
• The numerical value of relatively elastic demand ranges between zero to one (ep<1). Marshall has termed relatively inelastic demand as elasticity being less than unity.
The demand curve of relatively inelastic demand is rapidly sloping, as shown in Figure-5
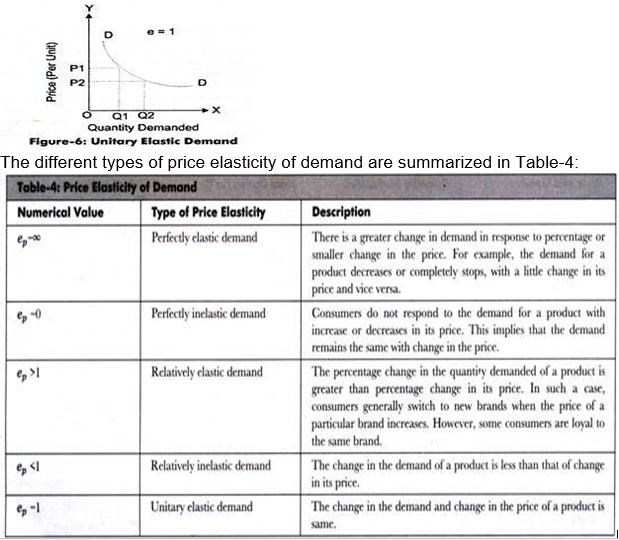
(e) Unitary Elastic Demand:
• When the proportionate change in demand produces the same change in the price of the product, the demand is referred as unitary elastic demand.
• The numerical value for unitary elastic demand is equal to one (ep=1).
• The shape of the demand curve is rectangular hyperbola
• A curve is a rectangular hyperbola when area under the curve is same at every point
Mathematically, pq = c
The demand curve for unitary elastic demand is represented as a rectangular hyperbola, as shown in Figure-6:
Percentage method of measuring elasticity of demand
There are basically three methods of measuring elasticity of demand.
In this method elasticity of demand is measured as a ratio between change in quantity demand to change in price of a commodity
Mathematically
![]()
Free study material for Economics
CBSE Class 12 Economics Part A Microeconomics Chapter 2 Theory of Consumer Behaviour Study Material
Students can find all the important study material for Part A Microeconomics Chapter 2 Theory of Consumer Behaviour on this page. This collection includes detailed notes, Mind Maps for quick revision, and Sure Shot Questions that will come in your CBSE exams. This material has been strictly prepared on the latest 2026 syllabus for Class 12 Economics. Our expert teachers always suggest you to use these tools daily to make your learning easier and faster.
Part A Microeconomics Chapter 2 Theory of Consumer Behaviour Expert Notes & Solved Exam Questions
Our teachers have used the latest official NCERT book for Class 12 Economics to prepare these study material. We have included previous year examination questions and also step-by-step solutions to help you understand the marking scheme too. After reading the above chapter notes and solved questions also solve the practice problems and then compare your work with our NCERT solutions for Class 12 Economics.
Complete Revision for Economics
To get the best marks in your Class 12 exams you should use Economics Sample Papers along with these chapter notes. Daily practicing with our online MCQ Tests for Part A Microeconomics Chapter 2 Theory of Consumer Behaviour will also help you improve your speed and accuracy. All the study material provided on studiestoday.com is free and updated regularly to help Class 12 students stay ahead in their studies and feel confident during their school tests.
FAQs
Our advanced study package for Part A Microeconomics Chapter 2 Theory of Consumer Behaviour includes detailed concepts, diagrams, Mind Maps, and explanation of complex topics to ensure Class 12 students learn as per syllabus for 2026 exams.
The Mind Maps provided for Part A Microeconomics Chapter 2 Theory of Consumer Behaviour act as visual anchors which will help faster recall during high-pressure exams.
Yes, teachers use our Class 12 Economics resources for lesson planning as they are in simple language and have lot of solved examples.
Yes, You can download the complete, mobile-friendly PDF of the Economics Part A Microeconomics Chapter 2 Theory of Consumer Behaviour advanced resources for free.
Yes, our subject matter experts have updated the Part A Microeconomics Chapter 2 Theory of Consumer Behaviour material to align with the rationalized NCERT textbooks and have removed deleted topics and added new competency-based questions.