
Download the latest CBSE Class 9 Mathematics Statistics Notes Set 01 in PDF format. These Class 9 Mathematics revision notes are carefully designed by expert teachers to align with the 2026-27 syllabus. These notes are great daily learning and last minute exam preparation and they simplify complex topics and highlight important definitions for Class 9 students.
Revision Notes for Class 9 Mathematics Chapter 12 Statistics
To secure a higher rank, students should use these Class 9 Mathematics Chapter 12 Statistics notes for quick learning of important concepts. These exam-oriented summaries focus on difficult topics and high-weightage sections helpful in school tests and final examinations.
Chapter 12 Statistics Revision Notes for Class 9 Mathematics
CBSE Class 9 Concepts for Statistics. Learning the important concepts is very important for every student to get better marks in examinations. The concepts should be clear which will help in faster learning. The attached concepts made as per NCERT and CBSE pattern will help the student to understand the chapter and score better marks in the examinations.
Chapter 14
Statistics
Chapter Notes
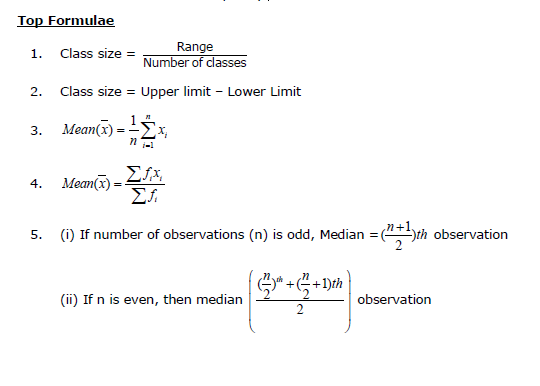
Top Definitions
1. Facts or figures collected with a definite purpose are called data.
2. Statistics deals with collection, presentation, analysis and interpretation of numerical data.
3. Arranging data in a order to study their salient features is called presentation of data.
4. Data arranged in ascending or descending order is called arrayed data or an array.
5. When an investigator with a definite plan or design in mind collects data first handedly, it is called primary data.
6. Data when collected by someone else, say an agency or an investigator, comes to you, is known as the secondary data.
7. Variable is a quantity that assumes different values.
8. Range of the data is the difference between the maximum and the minimum values of the observations.
9. The small groups obtained on dividing all the observations are called classes or class intervals and the size is called the class size or class width.
10. Class mark of a class is the mid value of the two limits of that class.
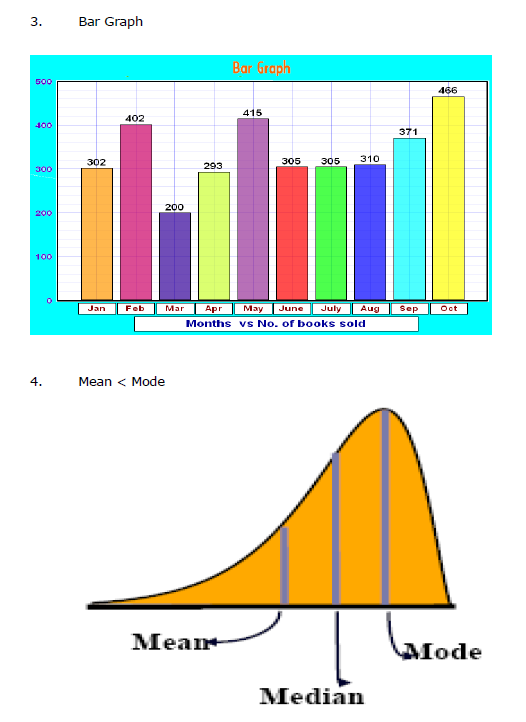
11. A bar graph is the diagram showing a system of connections or interrelations between two or more things by using bars.
12. A histogram is the bar graph such that the area over each class interval is proportional to the relative frequency of data within this interval.
13. The number of times an observation occurs in the data is called the frequency of the observation.
14. A frequency distribution in which the upper limit of one class differs from the lower limit of the succeeding class is called an Inclusive or discontinuous Frequency Distribution.
15. A frequency distribution in which the upper limit of one class coincides from the lower limit of the succeeding class is called an exclusive or continuous Frequency Distribution.
16. A bar graph is a pictorial representation of data in which rectangular bars of uniform width are drawn with equal spacing between them on one axis, usually the x axis. The value of the variable is shown on the other axis that is the y axis.
17. A histogram is a set of adjacent rectangles whose areas are proportional to the frequencies of a given continuous frequency distribution.
18. The Cumulative Frequency of a class-interval is the sum of frequencies of that class and the classes which precede (come before) it.
19. The mean value of a variable is defined as the sum of all the values of the variable divided by the number of values.
20. Median is the value of middle most observation(s).
21. Mode of a statistical data is the value of that variate which has the maximum frequency.
Top Concepts
1. In case of continuous frequency distribution, the upper limit of a class is not to be included in that class while in discontinuous both the limits are included.
2. The height of rectangles corresponds to the numerical value of the data.
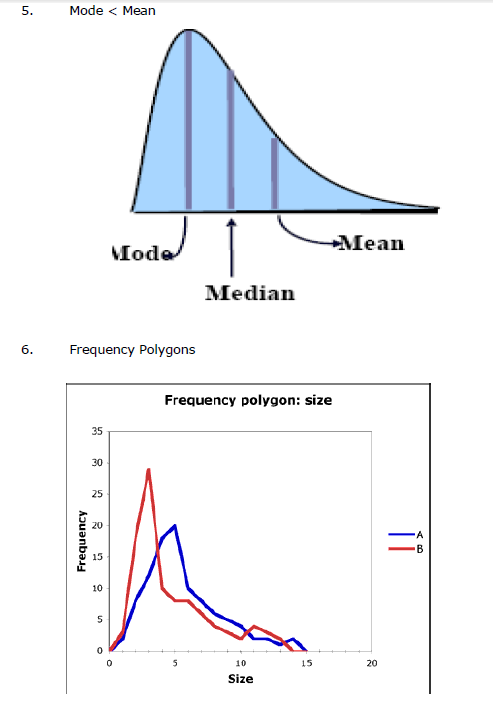
3. Frequency polygons are a graphical device for understanding the shapes of distributions.
4. Bar charts are used for comparing two or more values.
5. A histogram differs from a bar chart, as in the former it is the area of the bar that denotes the value, not the height.
6. The height of the rectangle as the ratio of the frequency of the class to the width or size of the class.
7. Last cumulative frequency is always the sum total of all the frequencies.
8. If both a histogram and a frequency polygon are to be drawn on the same graph, then we should first draw the histogram and then join the mid-points of the tops of the adjacent rectangles in the histogram with line-segments to get the frequency polygon.
9. If classes are not of equal width, then the height of the rectangle is calculated by the ratio of the frequency of that class, to the width of that class.
10. A measure of central tendency tries to estimate the central value which represents the entire data.
11. The three measures of central tendency for ungrouped data are mean, mode and median.
12. The disadvantage of arithmetic mean is that it is affected by extreme values.
13. The median is to be calculated only after arranging the data in ascending order or descending order.
22. Average height is the modal value.
23. Disadvantage of the mode is that it is not uniquely defined in many cases.
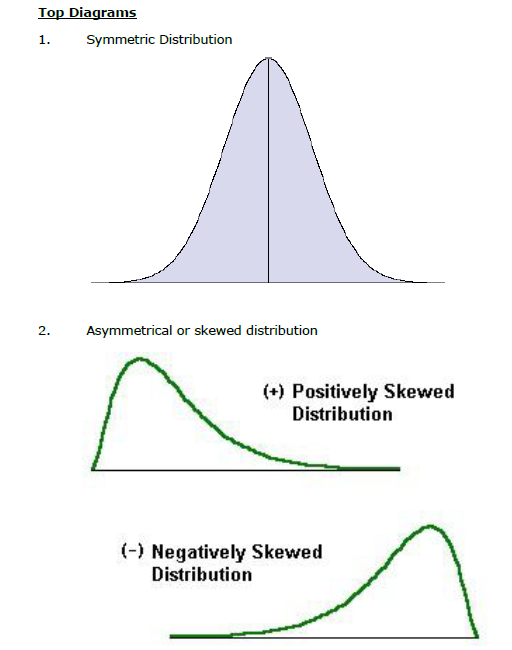
24. The data is symmetric about the mean position when the three averages mean median and mode are all equal.
25. The data is asymmetric when the three measures are unequal.
14. The variate corresponding to the highest frequency is to be taken as the mode and not the frequency.
Please click the link below to download pdf file for CBSE Class 9 Concepts for Statistics.
Free study material for Mathematics
CBSE Class 9 Mathematics Chapter 12 Statistics Notes
Students can use these Revision Notes for Chapter 12 Statistics to quickly understand all the main concepts. This study material has been prepared as per the latest CBSE syllabus for Class 9. Our teachers always suggest that Class 9 students read these notes regularly as they are focused on the most important topics that usually appear in school tests and final exams.
NCERT Based Chapter 12 Statistics Summary
Our expert team has used the official NCERT book for Class 9 Mathematics to design these notes. These are the notes that definitely you for your current academic year. After reading the chapter summary, you should also refer to our NCERT solutions for Class 9. Always compare your understanding with our teacher prepared answers as they will help you build a very strong base in Mathematics.
Chapter 12 Statistics Complete Revision and Practice
To prepare very well for y our exams, students should also solve the MCQ questions and practice worksheets provided on this page. These extra solved questions will help you to check if you have understood all the concepts of Chapter 12 Statistics. All study material on studiestoday.com is free and updated according to the latest Mathematics exam patterns. Using these revision notes daily will help you feel more confident and get better marks in your exams.
FAQs
You can download the teacher prepared revision notes for CBSE Class 9 Mathematics Statistics Notes Set 01 from StudiesToday.com. These notes are designed as per 2026-27 academic session to help Class 9 students get the best study material for Mathematics.
Yes, our CBSE Class 9 Mathematics Statistics Notes Set 01 include 50% competency-based questions with focus on core logic, keyword definitions, and the practical application of Mathematics principles which is important for getting more marks in 2026 CBSE exams.
Yes, our CBSE Class 9 Mathematics Statistics Notes Set 01 provide a detailed, topic wise breakdown of the chapter. Fundamental definitions, complex numerical formulas and all topics of CBSE syllabus in Class 9 is covered.
These notes for Mathematics are organized into bullet points and easy-to-read charts. By using CBSE Class 9 Mathematics Statistics Notes Set 01, Class 9 students fast revise formulas, key definitions before the exams.
No, all study resources on StudiesToday, including CBSE Class 9 Mathematics Statistics Notes Set 01, are available for immediate free download. Class 9 Mathematics study material is available in PDF and can be downloaded on mobile.