
Get the most accurate NCERT Solutions for Class 12 Economics Chapter 4 Aggregate Demand and Its Related Concepts here. Updated for the 2026-27 academic session, these solutions are based on the latest NCERT textbooks for Class 12 Economics. Our expert-created answers for Class 12 Economics are available for free download in PDF format.
Detailed Chapter 4 Aggregate Demand and Its Related Concepts NCERT Solutions for Class 12 Economics
For Class 12 students, solving NCERT textbook questions is the most effective way to build a strong conceptual foundation. Our Class 12 Economics solutions follow a detailed, step-by-step approach to ensure you understand the logic behind every answer. Practicing these Chapter 4 Aggregate Demand and Its Related Concepts solutions will improve your exam performance.
Class 12 Economics Chapter 4 Aggregate Demand and Its Related Concepts NCERT Solutions PDF
Question. What is marginal propensity to consume? How is it related to marginal propensity to save?
Answer: (i) The ratio of change in consumption (C) to change in income (Y) is known as marginal propensity to consume. It indicates the proportion of additional income that is being spent on consumption. The sum of MPC and MPS is equal to one. It can be proved as under: We know: ΔY = ΔC + ΔS Dividing both sides by AY, we get ,ΔY/ΔY=ΔC/ Y + ΔS/ΔY or 1=MPC+MPS [ΔY/ΔY=1; ΔC/ΔY =MPC ΔS/ΔY=MPS] MPC + MPS = 1 because total increment in income is either used for consumption or for saving.
MORE-QUESTIONS SOLVED
I. Very Short Answer Type Questions
Question. What is Aggregate demand in Macroeconomics?
Answer: It is aggregate expenditure on ex-ante (planned) consumption and ex-ante (planned) investment that all sectors of the economy are willing to incur at each income level.
Question. What is Aggregate Supply in Macroeconomics?
Answer: Aggregate supply is the total amount of money value of goods and services, (which is paid to the factor of production against their factor services) that all the producers are willing to supply in an economy.
Question. What is consumption function?
Answer: Consumption function expresses functional relationship between aggregate consumption and national income.
Question. Can the value of APC be less than zero?
Answer: No, because even at the zero level of income, we will consume something i.e., autonomous consumption.
Question. Why can value of MPC be not greater than one?
Answer: It is so because Keynes’ psychological law of consumption states that when income increases, consumption also increases but at a lesser rate. So, increase in consumption is always less than increase in income, i.e., MPC=ΔC/ΔY is always less than one.
Question. Can the value of average propensity to save be negative? If yes,when?
Answer: Yes, the value of average propensity to save can be negative when consumption is more than national income, i.e., before the break-even point.
Question. What can be the maximum value of marginal propensity to save?
Answer: The maximum value of marginal propensity to save is 1. It is only possible when MPC = 0, i.e., the entire additional income is saved.
Question. What is the relationship between APC and APS?
Answer: The sum of APC and APS is equal to one, i.e., APC + APS = 1.
Question. What is the relationship between marginal propensity to save and marginal
propensity to consume?
Answer: The sum total of MPC and MPS is equal to one, i.e., MPC + MPS = 1.
Question. Give the meaning of autonomous consumption.
Answer: It refers to minimum level of consumption (i.e., C), which is needed for survival,i.e., consumption at zero level of national income.
Question. Let the consumption be C = 50 + 0.75 Y, then calculate saving function?
Answer: As we know that
S = Y – C = Y -(50 + 0.75 Y)
– Y – 50 – 0.75Y
S = -50 + Y(l-0.75) = -50 + 0.25Y
II. Multiple Choice Questions
Question. If APS is 0.9, how much will be the APC?
(a) 0.2
(b) 0.5
(c) 1
(d) 0.1
Answer: (d)
Question. If MPC is 0.6, what will be the MPS?
(a) 0.2
(b) 0.4
(c) 0.9
(d) 0.5
Answer: (b)
Question. If disposable income is? 1000 and consumption expenditure is ?750, the value of average propensity to save will be——————-.
(a) 0.25
(b) 0.9
(c) 0.85
(d) 0.2
Answer: (a)
Question. If the saving function is S = -50 + 0.2Y, then the MPC is
(a) 0.45
(b) 0.8
(c) 0.65
(d) 0.25
Answer: (b)
Question. There is parametric shift in the consumption line when —————.
(a) slope changes
(b) intercept changes
(c) APC changes
(d) none of them
Answer: (a)
Question. Guideline is the alternative name of ——————.
(a) aggregate demand
(b) aggregate supply
(c) MPC
(d) APS
Answer: (b)
Question. What is the value of MPC when MPS = 0?
(a) 0
(b) 4
(c) 3
(d) 1
Answer: (d)
Question. If MPS is one, how much is MPC?
(a) 3
(b) 2
(c) 0
(d) 1
Answer: (c)
III. Short Answer Type Questions
Question. Explain the components of aggregate demand.
Or
State components of AD. Describe anyone.
Answer: The components of aggregate demand are:
1. Private (or Household) consumption demand
(a) The total expenditure incurred by all the households of the county on their personal consumption is known as private consumption expenditure.
(b) Consumption demand depends mainly on disposable income and propensity to consume.
2. Private investment demand
(a) Private investment demand refers to the demand for capital goods by private investors.
(b) It is addition to the existing stock of real capital assets such as machines, tools, factory-building etc.
(c) Investments demand depends upon marginal efficiency of capital (Marginal efficiency of investment) and interest rate.
(d) Investment is of two types, Autonomous Investment and Induced investment, but in Keynes theory investment assumed to be Autonomous.
3. Government demand for goods and services
(a) In a modem economy, the government is an important buyer of goods and services.
(b) The government demand may be on account of public needs for roads, schools, hospitals, power, irrigation etc, for the maintenance of law and order and for defence.
4. Demand for net export (X – M)
(a) Net export represents foreign demand for goods and services produced by an economy.
(b) When exports exceed imports, net exports is positive and when imports exceed,net exports is negative.
(c) Exports and imports of a country are influenced by a number of factors such as foreign trade policy, exchange- rate, prices and quality of goods etc.
Thus, aggregate demand consists of these four types of demand.
AD = C + I + G + (X – M)
Question. Explain the distinction between ‘autonomous investment’ and “induced investment’.
Answer:
| BASIS FOR COMPARISON |
|
INDUCED INVESTMENT | |
| Meaning | Autonomous investment is commonly linked with the determinants like new resources, population growth, increase in labor force, technological innovations, etc. | Induced investment is the type of investment which is associated with the current, income, output, sales and profit. | |
| Nature | Income Inelastic | Income-elastic | |
| Relation with national income | Unrelated to national income | Positively related to national income | |
| Influenced by | Exogenous Factors | Endogenous Factors | |
| Demand | It affects the demand for goods and services. | It is influenced by the demand for goods and services. | |
| Determined by | Social Welfare | Profit Motive | |
| Investment Curve | Parallel to the X-axis | Slopes upwards to the right | |
| Undertaken by | Public Authorities like Central, state or Local Self Government. | Private Individuals and Firms. |
Question. Briefly state the concept of consumption function. Explain with schedule and diagram.
Answer: (i) Consumption function expresses functional relationship between aggregate
consumption and national income. Thus, consumption (C) is a function of income (Y).
C = F (Y)
Where,
C = Consumption
F = Function
Y = Disposable income
(ii) It can be explained with the help of the following schedule and diagram:
| National Income (Y) | Consumption (C) |
| 0 | 20 |
| 10 | 25 |
| 20 | 30 |
| 30 | 35 |
| 40 | 40 |
| 50 | 45 |
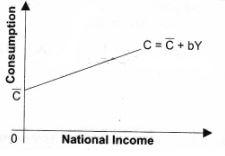
The above schedule and diagram shows Keynes’ Psychological law of Consumption, which states that as income increases consumption expenditure also increases but increase in consumption is smaller than the increase in income.
Question. With the help of consumption schedule or curve bring out meaning of breakeven point.
Answer: Break-even point refers to that point in the level of income at which consumption is just equal to income. In other words, whole of income is spent on consumption and there is no saving. Below this level of income, consumption is greater than income but above this level, income is greater than consumption.
It can be explained with the help of following schedule and diagram:
| National Income (Y) | Consumption (C) | Saving (S) |
| 40,000 | 46,000 | 6,000 |
| 50,000 | 53,000 | -3,000 |
| 60,000 | 60,000 | 0 |
| 70,000 | 67,,000 | 3,000 |
| 80,000 | 74,000 | 6,000 |
In the above imaginary house hole schedule of consumption and saving, at annual income level of Rs 60,000, consumption is Rs 60,000 and in consequence there is no saving. This is break-even point.
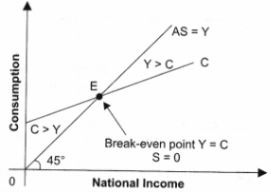
In the above diagram, when Consumption (C) = National Income(Y), savings are zero. This is known as break-even point. This is shown by point E in the diagram. Thus break even point indicates a point where consumption becomes equal to income or consumption curve cuts the income curve.
Question. What is APC? How is it calculated?
Answer: The ratio of aggregate consumption expenditure to aggregate income is known as average propensity to consume. It indicates the percentage (or ratio) of income which is being spent on consumption. It is worked out by dividing total consumption expenditure (C) by total income (Y). APC=C/Y
| National Income (Y) | Consumption (C) | APC = C/Y |
| 0 | 80 | --- |
| 100 | 160 | 1.6 |
| 200 | 240 | 1.2 |
| 300 | 320 | 1.06 |
| 400 | 400 | 1 |
| 500 | 480 | 0.96 |
Question. Distinguish between APS and MPS. The value of which of these two can be negative and when?
Answer:
| Basis | Average Propensity to Save (APS) | Marginal Propensity to Save (MPS) |
| Meaning | It is the ratio of saving to the corresponding income level. | It is the ratio of change in saving to the change in total income. |
| Value less than zero | When there are dissavings, Average Propensity to Save can be less than zero. It means that till consumption is more than national income, APS will be less than zero. | As the change in saving can never be negative, Marginal Propensity to Save can never be less than zero. It means that as the change in consumption can never be more than change in income, MPS will never be less than zero. |
| Formula | APS=S/Y | MPS= ΔS/ΔY |
Question. Differentiate between APC and APS and tell which of them is negative.
Answer:
| Average Propensity to Consume (APC) | Basis | Average Propensity to Save (APS) |
| It is the ratio of consumption expenditure (C) to the corresponding level of income (Y) at a point of time | Meaning | It refers to the ratio of savings. (S) to the corresponding level of income (Y) at a point of time. |
| APC can never be less than zero because even at zero level of income, we have consumption i.e., autonomous consumption. | Value less than zero | APS can be less than zero when there are dis-savings, i.e., till consumption is more than national income. |
| APC: = C/Y | Formula | APS = S/Y |
APS can be negative. When at low level of income consumption exceeds income, savings are negative and make the APS negative. It can be explained with the help of the following schedule.
| National Income | Consumption | Saving | APS |
| 10 | 20 | -10 | -1 |
| 20 | 25 | -5 | -5/20 = - 1/4 = -0.25 |
Question. Differentiate between APC and MPC.
Answer:
| BASIS FOR COMPARISON | AVERAGE PROPENSITY TO CONSUME (APC) | MARGINAL PROPENSITY TO CONSUME (MPC) | |
| Meaning |
|
Marginal Propensity to Consume (MPC) is the ratio between additional consumption and additional income. | |
| Indicates | Consumption per unit of total income. | Consumption per unit of additional income. | |
| Slope of Consumption function | Not indicated by APC | Indicated by MPC | |
| Zero | APC can never be zero | MPC can be zero | |
| Represented as |
|
Difference between two points on the curve |
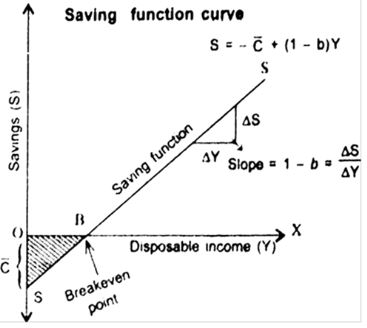
Question. Explain saving function with the help of schedule and diagram.
Answer: Saving function schedule and curve.
| Income (Y) | Consumption C) | Saving (S = Y – C) |
| 0 | 30 | -30 |
| 100 | 100 | 0 |
| 200 | 170 | 30 |
| 300 | 240 | 60 |
| 400 | 310 | 90 |
A diagrammatic representation of relationship between income and savings level gives the saving function curve. In the figure given below, saving function curve SS is a straight line because slope of saving is constant. The curve slopes upward which depicts direct relationship between income and saving. The saving function line SS cuts the income line at point B which is called Break-even point because at this point consumption expenditure is equal to income (or savings are zero). To the left of breakeven point savings are negative indicating consumption being more than income whereas to the right of breakeven point, savings are positive indicating consumption expenditure being less than income. The shaded area reflects dissavings which is equal to the area of autonomous consumption shown as C in the fig given below.
IV. True Or False
Giving reasons, state whether the following statements are true or false:
Question. Average propensity to save is always greater than zero.
Answer: False. Because at very low level of income, when consumption exceeds income, then saving becomes negative and APS < 0. It can be explained with the help of the following schedule:
| Notional Income | Consumption | Saving | APS |
| 10 | 20 | -10 | -1 |
| 20 | 25 | -5 | 5/20 = -1/4 = -0.25 |
Question. Value of average propensity to save can never be less than zero
Answer: False. The value of APS can be less than zero (i.e., negative). When consumption expenditure (C) becomes greater than income then the volume of savings becomes negative. Hence APS will be negative, (i.e., less than zero). This is shown as;
Let C = 1500 and Y = 1,000.
We know, S = Y – C = 1,000 – 1500 = -500
APS=S/Y = -500/1000 =(-)0.5
Thus, the value of APS can be less than zero (i.e. negative).
Question. When the value of average propensity to save is negative, the value of marginal propensity to save will also be negative.
Answer: False. Value of APS has no relationship with MPS. APS is closely related with APC,
i.e., APS + APC = 1. When APC is greater than unity (as in case of lower level of income), the value of APS is negative.
Question. The value of marginal propensity to save can never be negative.
Answer: True. MPS can never be less than zero as change in savings can never be negative,
i.e., change in consumption can never be more than the change in income.
Question. The value of average propensity to save can never be greater than 1.
Answer: True because Saving can never be greater than Income.
Question. Sum of average propensity to consume and marginal propensity to consume is always equal to 1.
Answer: False. The value of APC has no relationship with MPC. Either APC + APS = 1 or MPC + MPS = 1
Question. If income is Rs 10,000 crore and consumption is Rs 5,000 crore, APC would be 0.5.
Answer: True. As,APC=C/Y =5000/10000 =0.5
Note: As per CBSE guidelines, no marks will be given if reason to the answer is not explained.
V. Long Answer Type Questions
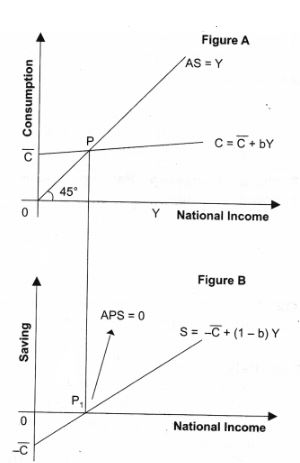
Question. Draw a straight line consumption curve. From it derive the saving curve.
Explain the process of derivation on the diagram, show:
(i) The income level at which APC =1.
(ii) The income level at which APS is negative. Or
Outline the steps taken in deriving saving curve from the consumption curve. Use diagram. Or
Draw on a diagram a straight line Consumption curve for an economy. From it derive the saving curve, explaining the method of derivation. Show a point on the consumption curve at which APS = 0?
Answer: To explain the below figure we define the following two terms.
(i) Consumption function: Consumption function expresses functional relationship between aggregate consumption and national income. It can be expressed as consumption is equal to national income, which is known as break-even point. At point P, APC = 1 because consumption is equal to income at this point.
(iv) Corresponding to point P, we derive the point in figure B where Saving is equal to zero. At point APS =0. After point P in figure A, national income is greater than consumption, i.e., positive saving, which has shown in figure B, after point , where savings are positive.
(v) Before point P in figure A consumption is greater than income, i.e., negative saving or dis-saving, which has been shown in figure B before point where savings are negative.
(vi) It can be explained with the help of the following algebraic presentation;
C = C + bY [given]
S = ?
As we know Income is either consumed or saved
Y = C + S
SY = CY - [C + by]
= Y-C - by
S = - C + [1- b] Y
Question. Draw on a diagram a straight line savings curve for an economy. From it derive the consumption curve, explaining the method of derivation. Show a point on the consumption curve at which APC =1?
Answer: To explain the above figure we define the following two terms.
(1) Saving function: Propensity to save (or saving function) shows the functional relationship between aggregate savings and income. It can be expressed as S = - C + (1 - b) Y , where, - C = dis - saving and (1 - b) = MPS
(i) Consumption function: Consumption function expresses functional relationship between aggregate consumption and national income. It can be expressed as C = C + bY where = Autonomous consumption, b = marginal propensity to consume.
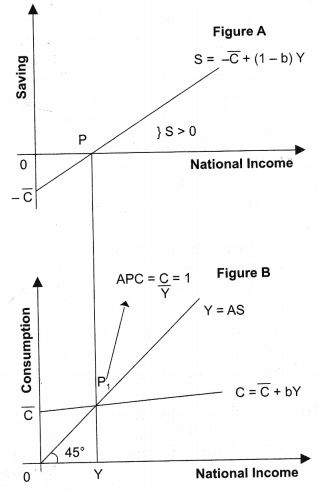
(iii) Figure B is derived from A. In Figure A at point P saving = 0. Corresponding to point P, we derive the point P: in figure B where income = consumption. Point Pj is known as to be break-even point and at this point only APC = 1.
(iv) After point P in figure A savings are positive, which has been shown in figure B, after point Pt where Income is greater than consumption, i.e., positive saving.
(v) Before point P in figure A savings are negative which has shown in figure B before point Pi; where consumption is greater than income, i.e., negative saving or dis-saving.
(vi) It can be explained with the help of the following algebraic presentation.
S = - C + [1 - b] Y [given]
C = ?
As we know Income is either consumed or saved
Y = C + S
C = Y - S = Y - [ - C + [1 - b] Y ]
=Y + C - Y + bY
C = C + bY
VI. Higher Order Thinking Skills
Question. Why APC falls with the increase in income?
Answer: APC falls continuously with the increase in income because the proportion of income spent on consumption keeps on decreasing.
Question. Can APC be zero?
Answer: APC can be zero only when consumption becomes zero. However, consumption is never zero at any level of income. Even at zero level of national income, there is autonomous consumption (C ).
Question. What can be the maximum value of marginal propensity to save?
Answer: The maximum value of marginal propensity to save is 1. It is possible only when MPC = 0, i.e., the entire additional income is saved.
Question. MPC of the poor is more than that of the rich.
Answer: True. It happens because the poor spend a greater percentage of their increased income on consumption as most of their basic needs remain unsatisfied. As against it, the rich people spend a smaller proportion as their basic needs are already satisfied.
Question. In Keynes theory, MPC fall with an increase in income.
Answer: False. Because Keynes assumed MPC remains constant. So, with the increase in income, MPC remains constant.
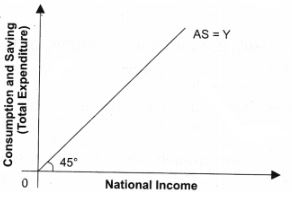
Question. What is a guideline?
Answer: The aggregate supply (AS) curve which is a 45° positively sloping line from the origin. -It is also called a guideline. Every point on AS curve is equidistant from the horizontal axis and the vertical axis implying that total income is equal to total expenditure or spending, i.e., C + S. If whole of national income is spent on consumption of goods and services, S = 0. It is called break-even point.
Question. Complete the following table:
| Income | Marginal Propensity to Consume | Saving | Average Propensity to Save |
| 0 | --- | -90 | --- |
| 100 | 0.75 | --- | --- |
| 200 | 0.75 | --- | --- |
| 300 | 0.75 | --- | --- |
Answer:
| Income | MPC | MPS = 1 - MPC |
ΔS = MPS x ΔY |
Saving (S) | ΔPS = S/Y |
| 0 | -- | - | - | -90 | - |
| 100 | 0.75 | 0.25 | 25 | -65 | -0.65 |
| 200 | 0.75 | 0.25 | 25 | -40 | -0.2 |
| 300 | 0.75 | 0.25 | 25 | -15 | -0.05 |
VII. Value Based Question
Question. Why do the consumption expenditure of involuntary unemployed worker is not zero, even at zero level of income?
Answer: A worker has to incur some expenditure to fulfil his basic needs even at zero level of income.
Value: Analytic.
VIII. Applications Based Questions
Question. Given below is the consumption function of an economy C = 100 + 0.5Y.With the help of a numerical example show that in this economy as income increases APC will decrease.
Answer: C=100+0.5Y("Give")
To show tha APC decreases with increase in income, consider the following hypothetical schedule:
| Income (Y) (₹) |
Consumption (C) (₹) C = 100 + 0.5Y |
APC APC = C/Y |
| 100 | 150 | 1.50 |
| 200 | 200 | 1 |
| 300 | 250 | 0.83 |
| 400 | 300 | 0.75 |
| 500 | 350 | 0.70 |
As seen in the above schedule, when the income increases from 100 crore to 200 crore and then to 300 crore and so on, APC decreases from 1.5 to 1 and then to 0.83 and keeps on decreasing with increase in income, Therefore, with an increase in income, APC decreases.
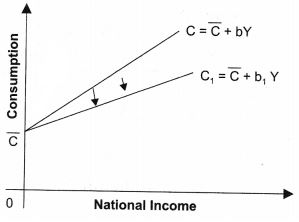
Question. What do you understand by ‘parametric shift of a line’? How does a line shift when its (i) slope increases and (ii) its intercept increases?
Answer: (i) when b increases from 0.5 to 0.75, then consumption curve (which is a straight line) pivots upwards. This is called a parametric hift of a graph. It is shown in figure.
(ii) When C increases: It is the autonomous part of the consumption function. It graphically gives the intercept of the consumption curve. If increases from 2 to 5, there will be parallel upward shift in the consumption curves. It is shown in figure given.
(i) When C decreases: It is the autonomous part of the consumption function. It graphically gives the intercept of the consumption curve. If decreases from 5 to 3, there will be parallel downward shift in the consumption curves. It is shown in the given figure:
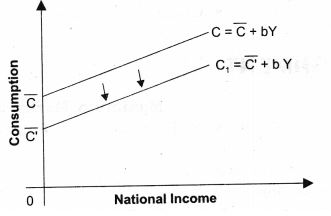
Thus, when slope changes, there is parametric shift in the curve. When intercept changes, there is parallel shift in the curve.
Question. “Economists are generally concerned about the rising Marginal Propensity to Save (MPS) in an economy”. Explain why?
Answer:
1. As we know, the sum of MPC and MPS is unity. Any Increase in Marginal Propensity to save (MPS) would leads to decrease in Marginal Propensity to consume (MPC).
2. It means, with the increase in Income, lesser and lesser proportion of Income is spend on consumption.
3. As, consumption is an important component of Aggregate Demand. If consumption falls, Aggregate Demand/Expenditure Fall, which will further leads to fall in Equilibrium level of Income in the economy.
Question. Derive a straight line saving curve using the following consumption function: C = 200 + 0.6 Y. Presuming the income levels to be Rs 100, Rs 200 and Rs 300 crores. Also calculate that level of income where consumption is equal to income.
Answer: C = 200 + 0.6Y
S = Y - C
= Y - (200 + 0.6Y)
- Y - 200 - 0.6Y
= - 200 + Y - 0.6Y
S= - 200+ Y(10.6)
S = - 200 + 0.4Y
| Income (Y) (3) | Consumption (C) (₹) C = 200 + 0.6Y |
| 100 | 200 + 0.6 (100) 200 + 60 = 260 |
| 200 | 200 + 0.6 (200) 200 + 120 = 320 |
| 300 | 200 + 0.6 (300) 200 + 180 = 380 |
| 400 | 200 + 0.6 (400) 200 + 240 = 440 |
| 500 | 200 + 0.6 (500) 200 + 300 = 500 |
So, Income Consumption at Income = level 500.
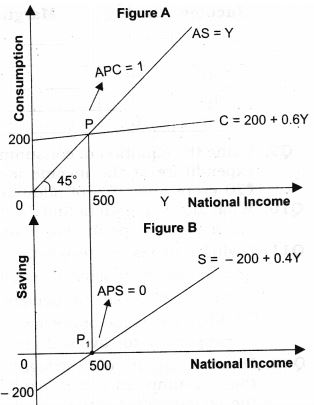
1. Figure B is derived from figure A. In Figure A at point P, consumption is equal to national income, which is known as break-even point. At point P, APC = 1 because consumption is equal to income at this point.
2. Corresponding to point P, we derive the point Pj in figure B where Saving is equal to zero. At point P: APS = 0. After point P in figure A, national income is greater than consumption, i.e., positive saving, which has shown in figure B, after point P1( where savings are positive.
3. Before point P in figure A consumption is greater than income, i.e., negative saving or dis-saving, which has been shown in figure B before point Pi; where savings are negative.
Free study material for Economics
NCERT Solutions Class 12 Economics Chapter 4 Aggregate Demand and Its Related Concepts
Students can now access the NCERT Solutions for Chapter 4 Aggregate Demand and Its Related Concepts prepared by teachers on our website. These solutions cover all questions in exercise in your Class 12 Economics textbook. Each answer is updated based on the current academic session as per the latest NCERT syllabus.
Detailed Explanations for Chapter 4 Aggregate Demand and Its Related Concepts
Our expert teachers have provided step-by-step explanations for all the difficult questions in the Class 12 Economics chapter. Along with the final answers, we have also explained the concept behind it to help you build stronger understanding of each topic. This will be really helpful for Class 12 students who want to understand both theoretical and practical questions. By studying these NCERT Questions and Answers your basic concepts will improve a lot.
Benefits of using Economics Class 12 Solved Papers
Using our Economics solutions regularly students will be able to improve their logical thinking and problem-solving speed. These Class 12 solutions are a guide for self-study and homework assistance. Along with the chapter-wise solutions, you should also refer to our Revision Notes and Sample Papers for Chapter 4 Aggregate Demand and Its Related Concepts to get a complete preparation experience.
FAQs
The complete and updated is available for free on StudiesToday.com. These solutions for Class 12 Economics are as per latest NCERT curriculum.
Yes, our experts have revised the as per 2026 exam pattern. All textbook exercises have been solved and have added explanation about how the Economics concepts are applied in case-study and assertion-reasoning questions.
Toppers recommend using NCERT language because NCERT marking schemes are strictly based on textbook definitions. Our will help students to get full marks in the theory paper.
Yes, we provide bilingual support for Class 12 Economics. You can access in both English and Hindi medium.
Yes, you can download the entire in printable PDF format for offline study on any device.