
Read and download the CBSE Class 10 Statistics Sure Shot Questions Set 01. Designed for 2026-27, this advanced study material provides Class 10 Mathematics students with detailed revision notes, sure-shot questions, and detailed answers. Prepared by expert teachers and they follow the latest CBSE, NCERT, and KVS guidelines to ensure you get best scores.
Advanced Study Material for Class 10 Mathematics Chapter 13 Statistics
To achieve a high score in Mathematics, students must go beyond standard textbooks. This Class 10 Chapter 13 Statistics study material includes conceptual summaries and solved practice questions to improve you understanding.
Class 10 Mathematics Chapter 13 Statistics Notes and Questions
CBSE Class 10 Statistics Sure Shot Questions Set A. There are many more useful educational material which the students can download in pdf format and use them for studies. Study material like concept maps, important and sure shot question banks, quick to learn flash cards, flow charts, mind maps, teacher notes, important formulas, past examinations question bank, important concepts taught by teachers. Students can download these useful educational material free and use them to get better marks in examinations. Also refer to other worksheets for the same chapter and other subjects too. Use them for better understanding of the subjects.
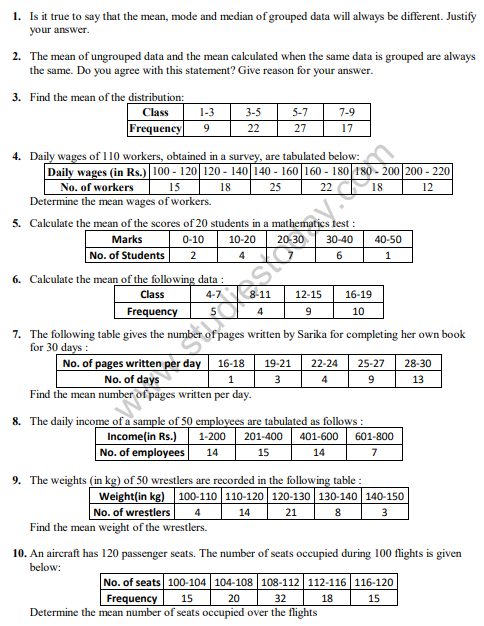
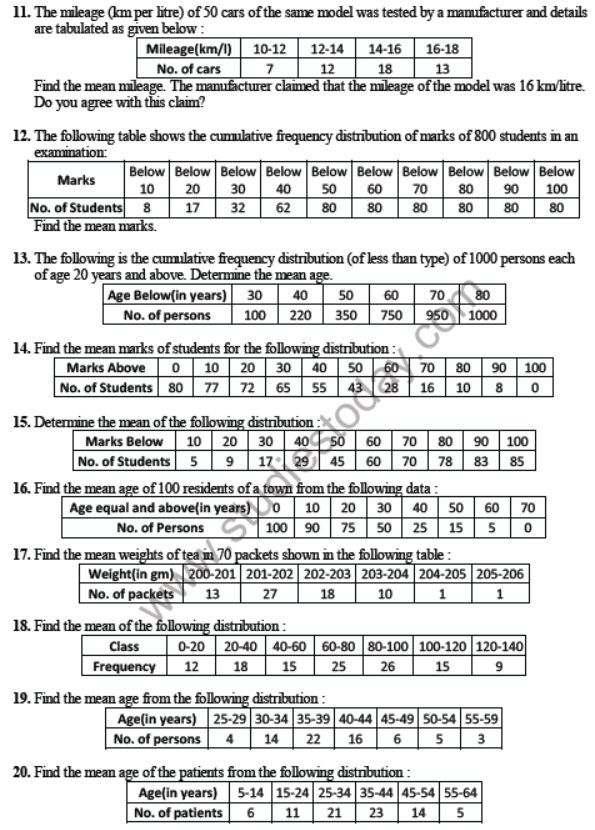
More MCQs for NCERT Class 10 Mathematics Statistics.......
1. Consider the following table: The mode of the above data is
(A) 23.5
(B) 24
(C) 24.4
(D) 25
Answer : (C)
2. The median and mode of a frequency distribution are 26 and 29 respectively. Then, the mean is
(A) 27.5
(B) 24.5
(C) 28.4
(D) 25.8
Answer : (B)
3. For a symmetrical frequency distribution, we have
(A) mean < mode < median
(B) mean > mode > median
(C) mean = mode = median
(D) mode = 1/2 (mean + median)
Answer : (C)
4. Look at the cumulative frequency distribution table given below: Number of families having income range 20000 to 25000 is
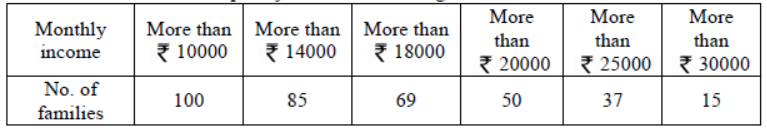
(A) 19
(B) 16
(C) 13
(D) 22
Answer : (C)
5. If the mean of a data is 27 and its median is 33. Then, the mode is
(A) 30
(B) 43
(C) 45
(D) 47
Answer : (C)
6. Which measure of central tendency is obtained graphically as the x-coordinate of the point of intersection of the two ogives?
(A) Mean
(B) Median
(C) Mode
(D) None of these
Answer : (B)
7. For the following distribution: The sum of the lower limits of the median class and the modal class is
![]()
(A) 15
(B) 25
(C) 30
(D) 35
Answer : (B)
8. Consider the following frequency distribution: The upper limit of the median class is
![]()
(A) 16.5
(B) 18.5
(C) 18
(D) 17
Answer : (D)
9. For finding the mean by using the formula x = A + h (∑fiui /∑fi) , we have ui = ?
(A) (A - xi )/h
(B) (xi - A) /h
(C) (A + xi ) /h
(D) h(xi - A)
Answer : (B)
10. While computing the mean of the grouped data, we assume that the frequencies are
(A) evenly distributed over the classes
(B) centred at the class marks of the classes
(C) centred at the lower limits of the classes
(D) centred at the upper limits of the classes
Answer : (B)
11. Consider the frequency distribution of the heights of 60 students of a class
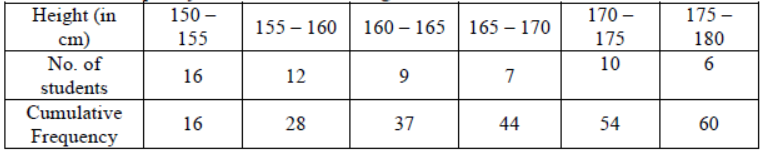
The sum of the lower limit of the modal class and the upper limit of the median class is
(A) 310
(B) 315
(C) 320
(D) 330
Answer : (B)
12. Mode = ?
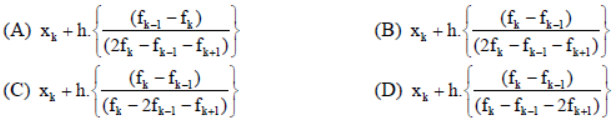
Answer : (B)
13. If the mean and median of a set of numbers are 8.9 and 9 respectively, then the mode will be
(A) 7.2
(B) 8.2
(C) 9.2
(D) 10.2
Answer : (C)
14. Look at the frequency distribution table given below: The median of the above distribution is
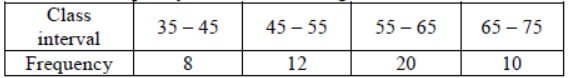
(A) 56.5
(B) 57.5
(C) 58.5
(D) 59
Answer : (B)
MEAN OF GROUPED DATA
- A certain value representative of the whole data and signifying its characteristics is called mean of the data. To calculate the mean of grouped data we have the following methods.
- Direct Method: If the frequencies of \( n \) observations \( x_1, x_2, ......., x_n \) be \( f_1, f_2, f_3, ...., f_n \) respectively, then the mean, \( \bar{x} \) is given by \[ \bar{x} = \frac{x_1 f_1 + x_2 f_2 + x_3 f_3 + ..... + x_n f_n}{f_1 + f_2 + f_3 + ..... + f_n} = \frac{\sum x_i f_i}{\sum f_i} \]
- Deviation Method or Assumed Mean Method : In this case, mean \( \bar{x} = a + \frac{\sum f_i d_i}{\sum f_i} \), where \( a \) = assumed mean, \( n = \sum f_i \) = total frequency and \( d_i = x_i – a \).
MODE OF GROUPED DATA
- The observation, which occurs most frequently among the given observations is called mode. A class with the maximum frequency is known as modal class. In grouped data, mode is a value lie in the modal class and it is given by the formula: \[ \text{Mode} = l + \left( \frac{f_1 - f_0}{2f_1 - f_0 - f_2} \right) \times h \] where
\( l \) = lower limit of modal class,
\( h \) = size of the class interval,
\( f_1 \) = frequency of the modal class,
\( f_0 \) = frequency of the class preceding the modal class,
\( f_2 \) = frequency of the class succeeding the modal class.
MEDIAN OF GROUPED DATA
- Median is defined as the middle most or the central observation when the observations are arranged either in ascending or in descending order of their magnitudes.
- In grouped data, median can be calculated by the formula given as : \[ \text{Median} = l + \left( \frac{\frac{n}{2} - cf}{f} \right) \times h \] where
\( l \) = lower limit of the median class,
\( n \) = number of observations,
\( cf \) = cumulative frequency of class preceding the median class,
\( f \) = frequency of the median class,
\( h \) = class size.
Note : Cumulative frequency (\( cf \)) can be defined as the sum of all previous frequencies upto the current point.
RELATIONSHIP AMONG MEAN, MEDIAN AND MODE
- Empirical relation among the three measures of central tendency is given by :
Mode = 3 Median – 2 Mean or Mean \( = \frac{3(\text{Median}) - \text{Mode}}{2} \)
Question. Find the class marks of classes 10–20 and 35–55.
(a) 10, 35
(b) 20, 55
(c) 15, 45
(d) 17.5, 45
Answer: (c)
Question. If \( d_i = x_i – 13 \), \( \sum f_i d_i = 30 \) and \( \sum f_i = 120 \), then mean, \( \bar{x} \) is equal to
(a) 13
(b) 12.75
(c) 13.25
(d) 14.25
Answer: (c)
Question. The mean of first ten odd natural numbers is
(a) 5
(b) 10
(c) 20
(d) 19
Answer: (b)
Question. If the mean of first \( n \) natural numbers is \( \frac{5n}{9} \), then \( n \) is equal to
(a) 5
(b) 9
(c) 10
(d) 11
Answer: (b)
Question. If the mean of \( x, x + 3, x + 6, x + 9 \) and \( x + 12 \) is 10, then \( x \) equals
(a) 1
(b) 2
(c) 4
(d) 6
Answer: (c)
Question. Four observations are 2, 4, 6 and 8. The frequencies of the first three observations are 3, 2 and 1 respectively. If the mean of the observations is 4, then find the frequency of the fourth observation.
(a) 8
(b) 4
(c) 1
(d) 2
Answer: (c)
Question. The following distribution shows the daily pocket allowance of children of a locality. The mean pocket allowance is ₹ 18. Find the missing frequency f.
Daily pocket allowance (in ₹): 11-13, 13-15, 15-17, 17-19, 19-21, 21-23, 23-25
Frequency: 7, 6, 9, 13, f, 5, 4
(a) 18
(b) 20
(c) 22
(d) 19
Answer: (b)
Question. The mean of the following data is
Class interval: 0-10, 10-20, 20-30, 30-40, 40-50
Frequency: 3, 5, 9, 5, 3
(a) 20
(b) 24
(c) 22
(d) 25
Answer: (d)
Question. The mean of \( n \) observations \( x_1, x_2, x_3, ..., x_n \) is \( \bar{x} \). If each observation is multiplied by \( p \), then the mean of the new observations is
(a) \( \frac{\bar{x}}{p} \)
(b) \( p\bar{x} \)
(c) \( \bar{x} \)
(d) \( p + \bar{x} \)
Answer: (b)
Question. The algebraic sum of all the deviations of all the observations from their mean is always
(a) 0
(b) +ve
(c) –ve
(d) equal to the number of observations.
Answer: (a)
Question. Consider the following frequency distribution.
Class interval: 0-10, 10-20, 20-30, 30-40, 40-50, 50-60
Frequency: 3, 9, 15, 30, 18, 5
The modal class is
(a) 10-20
(b) 20-30
(c) 30-40
(d) 40-50
Answer: (c)
Question. Life time of electric bulbs are given in the following frequency distribution.
Life time (in hours): 250-300, 300-350, 350-400, 400-450, 450-500
Number of bulbs: 5, 14, 21, 12, 10
Find the class mark of the modal class.
(a) 350
(b) 375
(c) 400
(d) 150
Answer: (b)
Question. The frequency of the class succeeding the modal class in the following frequency distribution is
Class interval: 10–15, 15–20, 20–25, 25–30, 30–35, 35–40, 40–45
Frequency: 3, 7, 16, 12, 9, 5, 3
(a) 3
(b) 6
(c) 9
(d) 12
Answer: (d)
Question. The modal class of data given below is 10–15, then
Class interval: 0-5, 5-10, 10-15, 15-20, 20–25
Frequency: 8, 6, f, 4, 3
(a) \( f < 9 \)
(b) \( f \geq 9 \)
(c) \( f > 9 \text{ only} \)
(d) \( f < 3 \)
Answer: (b)
Question. The mode for the following distribution is
Marks: 0–10, 10–20, 20–30, 30–40, 40–50
Number of students: 6, 10, 12, 32, 20
(a) 36
(b) 35.5
(c) 36.25
(d) 35
Answer: (c)
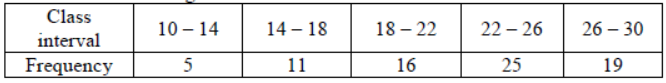
Question. Consider the following table:
Class interval: 10-14, 14-18, 18-22, 22-26, 26-30
Frequency: 5, 11, 16, 25, 19
The mode of the above data is
(a) 23.5
(b) 24
(c) 24.4
(d) 25
Answer: (c)
Question. If the median of the data: 6, 7, \( x – 2 \), \( x \), 17, 20 written in ascending order, is 16. Then \( x \) is equal to
(a) 15
(b) 16
(c) 17
(d) 18
Answer: (c)
Question. Find the class mark of the modal class in the following distribution.
Class interval: 40–50, 50–60, 60–70, 70–80, 80–90, 90–100
Frequency: 10, 25, 28, 12, 10, 15
(a) 45
(b) 55
(c) 65
(d) 63
Answer: (c)
Question. The median class for the following data is
Class interval: 20-40, 40-60, 60-80, 80-100
Frequency: 10, 12, 20, 22
(a) 20–40
(b) 40–60
(c) 60–80
(d) 80–100
Answer: (c)
Question. For a frequency distribution, mean, median and mode are connected by the relation
(a) Mode = 3 Mean – 2 Median
(b) Mode = 2 Median – 3 Mean
(c) Mode = 3 Median – 2 Mean
(d) Mode = 3 Median + 2 Mean
Answer: (c)
Question. The mean and mode of a frequency distribution are 28 and 16 respectively. The median is
(a) 22
(b) 23.5
(c) 24
(d) 24.5
Answer: (c)
Question. If mode of a series exceeds its mean by 12, then mode exceeds the median by
(a) 4
(b) 8
(c) 6
(d) 10
Answer: (b)
Question. The mean of 1, 2, 3, 4, ........, \( n \) is given by
(a) \( \frac{n(n+1)}{2} \)
(b) \( \frac{n+1}{4} \)
(c) \( \frac{n}{2} \)
(d) \( \frac{n+1}{2} \)
Answer: (d)
Question. The mean of 15 numbers is 25. If each number is multiplied by 4, mean of the new numbers is
(a) 60
(b) 100
(c) 10
(d) none of these
Answer: (b)
Question. The correct formula for finding the mode of a grouped frequency distribution is
(a) \( \text{Mode} = l + \left( \frac{f_1 - f_0}{2f_1 - f_0 - f_2} \right) \times h \)
(b) \( \text{Mode} = f_1 + \left( \frac{f_1 - f_0}{2h - f_1 - f_2} \right) \times l \)
(c) \( \text{Mode} = l - \left( \frac{f_1 - f_0}{2f_1 - f_0 - f_2} \right) \times h \)
(d) \( \text{Mode} = l + \left( \frac{f_1 - f_0}{2f_1 - f_0 - f_2} \right) \times h \)
Answer: (d)
Question. Consider the following frequency distribution.
Class interval: 1-7, 8-14, 15-21, 22-28, 29-35
Frequency: 3, 10, 5, 8, 12
The upper limit of the median class is
(a) 14.5
(b) 14.5
(c) 28
(d) 28.5
Answer: (c)
Question. Extreme value of a given data
(a) affect the median
(b) do not affect the median
(c) nothing can be said
(d) none of these
Answer: (b)
Question. One of the properties of mode is
(a) Not easy to calculate
(b) It is not affected by greatest and least values
(c) Algebraic
(d) Difference of greatest and least values
Answer: (b)
Question. The mean of \( n \) observations is \( \bar{X} \). If the first item is increased by 1, second by 2 and so on, then the new mean is
(a) \( \bar{X} + n \)
(b) \( \bar{X} + \frac{n}{2} \)
(c) \( \bar{X} + \frac{n+1}{2} \)
(d) None of these
Answer: (c)
Question. Look at the frequency distribution table given below.
Class interval: 35-45, 45-55, 55-65, 65-75
Frequency: 8, 12, 20, 10
The median of the above distribution is
(a) 56.5
(b) 57.5
(c) 58.5
(d) 59
Answer: (b)
Question. The mean, mode and median of the observations, 7, 7, 5, 7 and \( x \) are the same. Then the observation \( x \) is
(a) 10
(b) 9
(c) 8
(d) 7
Answer: (b)
Question. Mean of 20 observations is 15. If each observation is multiplied by \( \frac{2}{3} \), then the mean of new observations is
(a) 10
(b) 30
(c) 45
(d) 15
Answer: (a)
Question. The mean of six numbers : \( x – 5, x – 1, x, x + 2, x + 4 \) and \( x + 12 \) is 15. Find the mean of first four numbers.
(a) 11
(b) 12
(c) 13
(d) 14
Answer: (b)
Question. The numbers are arranged in the descending order : 108, 94, 88, 82, \( x + 7, x – 7, 60, 58, 42, 39 \). If the median is 73, the value of \( x \) is
(a) 72
(b) 73
(c) 76
(d) 75
Answer: (b)
Question. If the mean of the following distribution is 2.6, then the value of \( y \) is
Variable (\( x_i \)): 1, 2, 3, 4, 5
Frequency: 4, 5, y, 1, 2
(a) 3
(b) 8
(c) 13
(d) 24
Answer: (b)
Question. The mean of \( x_1, x_2,.......,x_n \) is \( M \). If \( x_i, i = 1,2,......, n \) is replaced by \( 5x_i \), the mean becomes \( M_1 \), then \( M_1 \) is equal to
(a) 5M
(b) M + 5
(c) M + 100
(d) 10 M
Answer: (a)
Question. If mean of ten consecutive odd numbers is 120, then the mean of first five odd numbers among them is
(a) 113
(b) 115
(c) 114
(d) 116
Answer: (b)
Question. The numbers 3, 5, 7 and 9 have their respectively frequencies \( x – 2, x + 2 \), and \( x – 3, x + 3 \). If the mean is 6.5, then the value of \( x \) is
(a) 3
(b) 4
(c) 5
(d) 6
Answer: (c)
Please click the link below to download CBSE Class 10 Statistics Sure Shot Questions Set A.
Free study material for Mathematics
CBSE Class 10 Mathematics Chapter 13 Statistics Study Material
Students can find all the important study material for Chapter 13 Statistics on this page. This collection includes detailed notes, Mind Maps for quick revision, and Sure Shot Questions that will come in your CBSE exams. This material has been strictly prepared on the latest 2026 syllabus for Class 10 Mathematics. Our expert teachers always suggest you to use these tools daily to make your learning easier and faster.
Chapter 13 Statistics Expert Notes & Solved Exam Questions
Our teachers have used the latest official NCERT book for Class 10 Mathematics to prepare these study material. We have included previous year examination questions and also step-by-step solutions to help you understand the marking scheme too. After reading the above chapter notes and solved questions also solve the practice problems and then compare your work with our NCERT solutions for Class 10 Mathematics.
Complete Revision for Mathematics
To get the best marks in your Class 10 exams you should use Mathematics Sample Papers along with these chapter notes. Daily practicing with our online MCQ Tests for Chapter 13 Statistics will also help you improve your speed and accuracy. All the study material provided on studiestoday.com is free and updated regularly to help Class 10 students stay ahead in their studies and feel confident during their school tests.
FAQs
Our advanced study package for Chapter 13 Statistics includes detailed concepts, diagrams, Mind Maps, and explanation of complex topics to ensure Class 10 students learn as per syllabus for 2026 exams.
The Mind Maps provided for Chapter 13 Statistics act as visual anchors which will help faster recall during high-pressure exams.
Yes, teachers use our Class 10 Mathematics resources for lesson planning as they are in simple language and have lot of solved examples.
Yes, You can download the complete, mobile-friendly PDF of the Mathematics Chapter 13 Statistics advanced resources for free.
Yes, our subject matter experts have updated the Chapter 13 Statistics material to align with the rationalized NCERT textbooks and have removed deleted topics and added new competency-based questions.