
Read and download the CBSE Class 10 Statistics Important Formulas and concepts for exams. Designed for 2026-27, this advanced study material provides Class 10 Mathematics students with detailed revision notes, sure-shot questions, and detailed answers. Prepared by expert teachers and they follow the latest CBSE, NCERT, and KVS guidelines to ensure you get best scores.
Advanced Study Material for Class 10 Mathematics Chapter 13 Statistics
To achieve a high score in Mathematics, students must go beyond standard textbooks. This Class 10 Chapter 13 Statistics study material includes conceptual summaries and solved practice questions to improve you understanding.
Class 10 Mathematics Chapter 13 Statistics Notes and Questions
CBSE Class 10 Statistics Important Formulas and concepts for exams. There are many more useful educational material which the students can download in pdf format and use them for studies. Study material like concept maps, important and sure shot question banks, quick to learn flash cards, flow charts, mind maps, teacher notes, important formulas, past examinations question bank, important concepts taught by teachers. Students can download these useful educational material free and use them to get better marks in examinations. Also refer to other worksheets for the same chapter and other subjects too. Use them for better understanding of the subjects.
In many real-life situations, it is helpful to describe data by a single number that is most representative of the entire collection of numbers. Such a number is called a measure of central tendency. The most commonly used measures are as follows.
1. The mean, or average, of ‘n’ numbers is the sum of the numbers divided by n.
2. The median of ‘n’ numbers is the middle number when the numbers are written in order. If n is
even, the median is the average of the two middle numbers.
3. The mode of ‘n’ numbers is the number that occurs most frequently. If two numbers tie for most
frequent occurrence, the collection has two modes and is called bimodal.
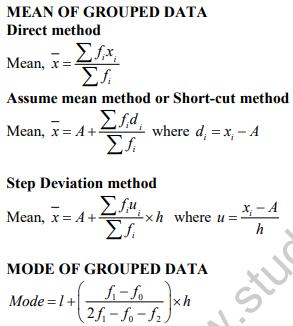
where l = lower limit of the modal class,
h = size of the class interval (assuming all class sizes to be equal),
f1 = frequency of the modal class,
f0 = frequency of the class preceding the modal class,
f2 = frequency of the class succeeding the modal class.
* Cumulative Frequency: The cumulative frequency of a class is the frequency obtained by adding the frequencies of all the classes preceeding the given class.
MEDIAN OF GROUPED DATA
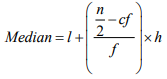
where l = lower limit of median class,
n = number of observations,
cf = cumulative frequency of class preceding the median class,
f = frequency of median class,
h = class size (assuming class size to be equal).
EMPIRICAL FORMULA
3Median = Mode + 2 Mean
v Cumulative frequency curve is also known as ‘Ogive’. There are three methods of drawing ogive:
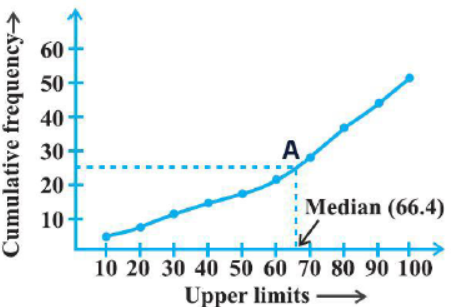
- LESS THAN METHOD
Steps involved in calculating median using less than Ogive approach-
> Convert the series into a 'less than ' cumulative frequency distribution.
> Let N be the total number of students who's data is given. N will also be the cumulative frequency of the last interval. Find the (N/2)th itemand mark it on the y-axis.
> Draw a perpendicular from that point to the right to cut the Ogive curve at point A.
> From point A where the Ogive curve is cut, draw a perpendicular on the x-axis. The point at which it touches the x-axis will be the median value of the series as shown in the graph.
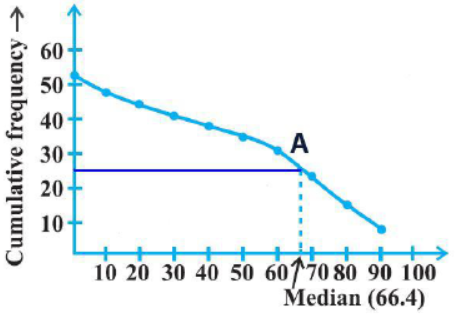
- MORE THAN METHOD
Steps involved in calculating median using more than Ogive approach-
> Convert the series into a 'more than ' cumulative frequency distribution.
> Let N be the total number of students who's data is given. N will also be the cumulative frequency of the last interval. Find the (N/2)th item and mark it on the y-axis.
> Draw a perpendicular from that point to the right to cut the Ogive curve at point A.
> From point A where the Ogive curve is cut, draw a perpendicular on the x-axis. The point at which it touches the x-axis will be the median value of the series as shown in the graph.
- LESS THAN AND MORE THAN OGIVE METHOD
Another way of graphical determination of median is through simultaneous graphic presentation of
both the less than and more than Ogives.
> Mark the point A where the Ogive curves cut each other.
> Draw a perpendicular from A on the x-axis. The corresponding value on the x-axis would be the median value.
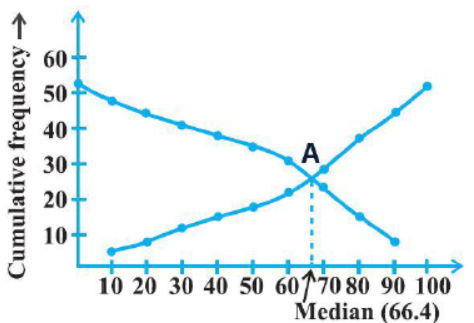
♦ The median of grouped data can be obtained graphically as the x-coordinate of the point of intersection of the two ogives for this data.
Please click the link below to download CBSE Class 10 Statistics Important Formulas and concepts for exams.
Free study material for Mathematics
CBSE Class 10 Mathematics Chapter 13 Statistics Study Material
Students can find all the important study material for Chapter 13 Statistics on this page. This collection includes detailed notes, Mind Maps for quick revision, and Sure Shot Questions that will come in your CBSE exams. This material has been strictly prepared on the latest 2026 syllabus for Class 10 Mathematics. Our expert teachers always suggest you to use these tools daily to make your learning easier and faster.
Chapter 13 Statistics Expert Notes & Solved Exam Questions
Our teachers have used the latest official NCERT book for Class 10 Mathematics to prepare these study material. We have included previous year examination questions and also step-by-step solutions to help you understand the marking scheme too. After reading the above chapter notes and solved questions also solve the practice problems and then compare your work with our NCERT solutions for Class 10 Mathematics.
Complete Revision for Mathematics
To get the best marks in your Class 10 exams you should use Mathematics Sample Papers along with these chapter notes. Daily practicing with our online MCQ Tests for Chapter 13 Statistics will also help you improve your speed and accuracy. All the study material provided on studiestoday.com is free and updated regularly to help Class 10 students stay ahead in their studies and feel confident during their school tests.
FAQs
Our advanced study package for Chapter 13 Statistics includes detailed concepts, diagrams, Mind Maps, and explanation of complex topics to ensure Class 10 students learn as per syllabus for 2026 exams.
The Mind Maps provided for Chapter 13 Statistics act as visual anchors which will help faster recall during high-pressure exams.
Yes, teachers use our Class 10 Mathematics resources for lesson planning as they are in simple language and have lot of solved examples.
Yes, You can download the complete, mobile-friendly PDF of the Mathematics Chapter 13 Statistics advanced resources for free.
Yes, our subject matter experts have updated the Chapter 13 Statistics material to align with the rationalized NCERT textbooks and have removed deleted topics and added new competency-based questions.