
Read and download the CBSE Class 12 Geography The World Population Distribution Density And Growth Worksheet in PDF format. We have provided exhaustive and printable Class 12 Geography worksheets for Chapter 2 The World Population Distribution Density and Growth, designed by expert teachers. These resources align with the 2026-27 syllabus and examination patterns issued by NCERT, CBSE, and KVS, helping students master all important chapter topics.
Chapter-wise Worksheet for Class 12 Geography Chapter 2 The World Population Distribution Density and Growth
Students of Class 12 should use this Geography practice paper to check their understanding of Chapter 2 The World Population Distribution Density and Growth as it includes essential problems and detailed solutions. Regular self-testing with these will help you achieve higher marks in your school tests and final examinations.
Class 12 Geography Chapter 2 The World Population Distribution Density and Growth Worksheet with Answers
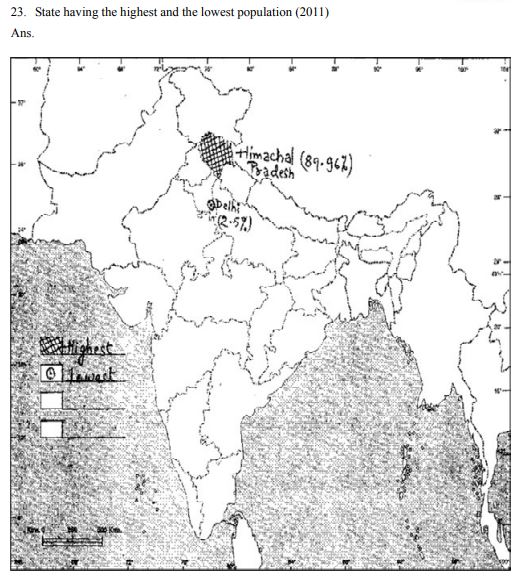
Question. Identify the area which comes under low density regions of population.
(a) Zaire Basin of Africa
(b) Western China
(c) South-East Asia
(d) East Asia
Answer : A
Question. Who stated that the number of people world increase faster that the supply of food.
(a) Thomas Alter
(b) Thomas Malthus
(c) Griffith Taylor
(d) Ellen C Semple
Answer : A
Question. The ratio between the number of people to the size of land is known as ……… .
(a) population distribution
(b) population density
(c) population growth
(d) crude birth rate
Answer : B
Question. Which of the following formula correctly depicts natural growth of population?
(a) Births -Deaths
(b) Births-Deaths-In Migration + Out Migration
(c) Births-Deaths + In Migration
(d) Births -Deaths + In Migration -Out Migration
Answer : D
Question. Which of the following pairs is not correctly matched?
(a) Population Density = Population/Area
(b) Crude Birth Rate – = CBR = Bi/P × 1000
(c) Natural Growth – Births – Deaths + In Migration – Out Migration
(d) Crude Death Rate – = CDR = D/P × 1000
Answer : C
Question. Which is the most populous continent?
(a) North America
(b) Africa
(c) Europe
(d) Asia
Answer : D
Question. In most of the developed countries of the world, population in the higher age group increased due to :
(a) Increase in the life expectancy rate
(b) Decline in birth rate
(c) Decline in death rate
(d) Both (a) and (b)
Answer : D
Question. Which of the following is the main characteristic of the stage-I of Demographic Transition Theory?
(a) High fluctuating fertility and high mortality rate
(b) Time of population explosion
(c) Decline in fertility and mortality rate
(d) All of the above
Answer : A
Question. Kobe-Osaka region is located in which country?
(a) South Korea
(b) China
(c) Japan
(d) Vietnam
Answer : C
Question. Which of these is a major cause of female migration in India?
(a) Education
(b) Marriage
(c) Movement Rate
(d) Searching for employment
Answer : B
Question. Which of the following country does not have areas having high density?
(a) USA
(b) Pakistan
(c) Bangladesh
(d) Sweden
Answer : D
Question. According to Malthus, which of these is a preventive check for population control?
(a) Famine
(b) Disease
(c) War
(d) Tax Disincentives
Answer : D
Question. The term Crude Birth Rate (CBR) is closest to which of the following?
(a) Fertility
(b) Migration Rate
(c) Mortality Rate
(d) Natural growth Rate
Answer : A
Question. What was the reason behind the population explosion happened in the Eighteenth century?
(a) Industrial revolution
(b) Agricultural Expansion
(c) Colonisation
(d) Vaccine development
Answer : A
Question. Which of the following region/ area in the world has very high density of population?
(a) North-East USA
(b) Norway
(c) Amazon Basin
(d) Kalahari
Answer : A
Question. Which of the following is a push factor for migration?
(a) Job opportunities
(b) Peace and stability
(c) Socio-economic backwardness
(d) Pleasant climate
Answer : C
Question. Which of the following can be a consequence of very high population growth?
(a) Depletion of resources
(b) Rise in epidemics
(c) Shortage of food supply
(d) All of the above
Answer : D
Question. It took how many years for the world population to grow from 1 billion to 2 billion?
(a) 12 years
(b) 100 years
(c) 30 years
(d) 22 years
Answer : B
Question. Which of the following countries is in the first stage of Demographic transition?
(a) Bangladesh
(b) India
(c) Peru
(d) Canada
Answer : A
Question. Which of the following areas / regions are characterised by very less density of population?
(a) Asia
(b) Arabian Desert
(c) South-East Asi
(d) North-West Europe
Answer : B
Question. Consider the following and tell which of them can be reason/reasons for scarce population in an area?
1. Presence of river valleys
2. Mountains and hills
3. Harsh climate
4. Rich mineral deposits
Codes
(a) 1 and 4
(b) 1, 3 and 4
(c) 2 and 3
(d) 2, 3 and 4
Answer : C
Question. Arrange the following group of regions in sequence as per their population density.
1. Asia
2. Africa
3. Europe
4. North America
Codes
(a) 1, 2, 3, 4
(b) 4, 3, 2, 1
(c) 2, 3, 4, 1
(d) 2, 4, 1, 3
Answer : A
Question. Arrange the following stages of Demographic transition in chronological order.
1. High fertility, High mortality
2. Birth rate equal to death rate
3. Population explosion
Codes
(a) 1, 2, 3
(b) 1, 3, 2
(c) 3, 2, 1
(d) 2, 3, 1
Answer : B
Question. Match the following.
Column I Column II
(Regions) (World’s share in Population Density)
A. Asia 1. 59.5%
B. Africa 2. 16.9%
C. Europe 3. 9.7%
D. Latin America and the 4. 8.5%
Caribbean
E. Northern America 5. 4.8%
F. Oceania 6. 0.5%
Codes
A B C D E F
(a) 1 2 3 4 5 6
(b) 6 5 4 3 2 1
(c) 3 4 5 2 1 6
(d) 4 3 6 5 2 1
Answer : A
Question. Match the following.
Column I Column II
(Regions) (Area-wise Rank in the world)
A. Asia 1. 2nd
B. Africa 2. 3rd
C. Europe 3. 1st
D. North America 4. 5th
Codes
A B C D
(a) 1 2 3 4
(b) 4 3 2 1
(c) 3 1 2 4
(d) 4 1 3 2
Answer : C
General patternsof population distribution in the world, density of population, factors influencing the distribution of population, population growth, trends in population growth, doubling time of world population spatial pattern of population change, impact of population change, demographic transition, population control measures.
GENERAL:
• people are real wealth of the country
• Country is known by its people
• Population of the world is uneven
“ Asia has many people where people are few and few places where people are very many”- George B. Cressey
PATTERNS OF POPULATION DISTRIBUTION
• Pop. Distribution refers to “ the way the people are spaced over the earth surface”
• 90 % of people are living in 10% of its land
• 10 most populas countries (CHINA, INDIA, USA, INDONESIA, BRAZIL,
PAKISTAN CIS BANGLADESH, JAPAN & NIGERIA) contribute 60% of population.
DENSITYOF POPULATION - RATIO BETWEEN LAND AND PEOPLE
Measured in persons per sq. km Density = Total population
Total Area(km sq)
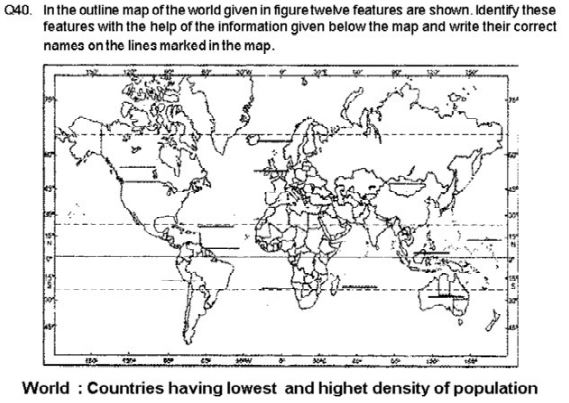
HIGH DENSITY AREAS: (more than 200persons/sq km) NE USA, NW EUROPE, S, SE, & E ASIA
LOW DENSITY AREAS (less the 1 person / sq km) HOT AND COLD DESERTS, LOW LATITUDE AREAS
MEDIUM DENSITY : (11-50 persons /sq.km)OTHER THAN ABOVE TWO AREAS
FACTORS INFLUENCING THE DISTRIBUTION OF POPULATION
• GEOGRPHICAL FACTORS
• Availability of water,
• Land forms,
• Climate,
• Soils
• ECONOMIC FACTORS
• Minerals,
• urbanization,
• industrialization
• SOCIAL AND CULTURAL FACTORS
• Religious factors,
• social and political unrest,
• border terrorism,
• govt. policies
• POPULATION GROWTH
• Change in number of persons of a place during a specific point of time, it may be positive or negative
• It may be represented in absolute numbers /percentage
• Change in population is an indicator of Economic Development
BASIC CONCEPTS ARE:
• growth of population,
• growth rate of population,
• natural growth of population,
• +ve growth of population
• –ve growth of population.
• Actual Growth of population
COMPONENTS OF POPULATION CHANGE
• Birth rate,
• Death Rate,
• Migration
CRUDE BIRTH RATE: Number of live births in a year per thousand of population CBR =
BiPX 1000
CBR= Crude Birth Rate
Bi: live births P = mid year population
CDR=numberof death in aparticularyearper thousand population.
CDR= DPX 1000
CDR= Crude Death Rate
D= NO. OF DEATHS P= ESTIMATED MID YEAR POPULATION
MIGRATION –
It is the spontaneous effort to achieve a better balance between population and resources. It may be permanent ,temporary/seasonal, it may be rural-rural ,rural-urban, urban-urban, urban – rural
Types of migration
• Immigration
• Emigration
FACTORS RESPOSIBLE FOR MIGRATION PUSH FACTORS:
• Unemployment,
• Poor living ,
• Political turmoil,
• Unpleasant climate,
• Natural disasters,
• Epidemics, and
• Socio- economics backwardness
PULL FACTORS:
• More attractive jobs,
• Good living conditions,
• Peace,
• Stability,
• Security of life,
• Pleasant climate
TRENDS IN POPULATION GROWTH:
Population growth is due to-
• Agricultural development,
• industrial revolution,
• transportation,
• sanitation and medical facilities,
• biotechnology,
• Information and computers technological revolution.
• Discovery of machines,
• medicines
Population Increased 10 times during last 500 years, 4 times in 20th century, 80 million people are added each year.
DOUBLING TIME OF WORLD POPULATION
• More than one million to become one billion population
• It took 12 years to become from 5 billion to 6 billion
• Developed countries take more time than developing countries
• Liberia highest growth rate: 8.2% Latvia lowest growth rate: -1.5%
SPATIAL PATTERN OF POPULATION CHANGE
When it is small change applied to large population it is large, growth rate declines but pop still increase
IMPACT OF HIGH GROWTH OF POPULATION
• Depletion of resources
• Spread of epidemics
• Reduced life expectancy
• Increase in social crime rate
• Health problems
DEMOGRAPHIC TRANSITION
• Predict the future population of any area
• Any region changes from high BR & DR to low BR & DR
• progress from rural to urban
• Illiterate to literate
These are collectively known as demographic cycle
STAGE-I :
• High fertility,
• High mortality,
• Low growth,
• More epidemics,
• Variable food supply ,
• Agriculture is occupation,
• Low life expectancy,
• Illiteracy,
• Low level of technology -
• Rain forest tribes, Bangladesh
STAGE -II
• Fertility remains high ,but decline with time,
• Reduced mortality,
• Medical facilities
• High growth rate
• Ex. Peru, Sri Lanka, Kenya
STAGE -III:
• Low birth rate and
• Death rate
• Slow growth
• Stable growth rate
CHARACTERSTICS OF URBAN POPULATION
• High technology
• Small families.
• Flexible families ex. Canada japan USA
• Population control measures:
• Limiting the population growth,
• Improving womens health,
PUPULATION CONTROL MEASURES
• Free availability of contraceptives,
• tax disincentives for large families,
• Government incentives for small families.
One marks questions
Question. Which Continent has the highest growth rate of population?
Answer: Africa
Question. Name three components of population change.
Answer: Birth rate , Death rate & Migration.
Question. Which country in the world has the highest growth rate of populations?
Answer: Liberia
Three Marks Question.
Question. What are the three stages of Demographic Transition ?
Answer: To predict the future population of an area, demographic transition theory can be used.
This theory explains 3 staged model of demographic transition:
Stage (i) High birth rate, high death rate , low growth rate : Example Bangladesh.
Stage (ii) Initially high birth rate , low death rate , high growth rate-example India
Stage (iii) Low birth rate, low death rate , stable or low growth rate –example Japan
Question. Classify the world into various regions on the basis of population density.
Answer: 1. Areas of high Density
(i) Monsoon Asia, South and South east Asia
(ii) Europe – river valley’s , coastal plains
(iii) Eastern coastal region of North America
2. Areas of Medium Density:
(i) Asia
(ii) Europe
(iii) USA ,Australia
(iv) Africa, South America
3. Areas of low Density:
(i) Hot Deserts
(ii) Areas around North & South poles
(iii) Cold Deserts
(iv) equatorial Region
Five marks Questions
Question. What is density of population? Explain with examples four geographical factors ,influencing the distribution of population in the World.
Answer: Density of population = population /Area
Geographical factors
(i) Availability of water
(ii) Landforms
(iii) Climate
(iv) Soil

CBSE Geography Class 12 Chapter 2 The World Population Distribution Density and Growth Worksheet
Students can use the practice questions and answers provided above for Chapter 2 The World Population Distribution Density and Growth to prepare for their upcoming school tests. This resource is designed by expert teachers as per the latest 2026 syllabus released by CBSE for Class 12. We suggest that Class 12 students solve these questions daily for a strong foundation in Geography.
Chapter 2 The World Population Distribution Density and Growth Solutions & NCERT Alignment
Our expert teachers have referred to the latest NCERT book for Class 12 Geography to create these exercises. After solving the questions you should compare your answers with our detailed solutions as they have been designed by expert teachers. You will understand the correct way to write answers for the CBSE exams. You can also see above MCQ questions for Geography to cover every important topic in the chapter.
Class 12 Exam Preparation Strategy
Regular practice of this Class 12 Geography study material helps you to be familiar with the most regularly asked exam topics. If you find any topic in Chapter 2 The World Population Distribution Density and Growth difficult then you can refer to our NCERT solutions for Class 12 Geography. All revision sheets and printable assignments on studiestoday.com are free and updated to help students get better scores in their school examinations.
FAQs
You can download the latest chapter-wise printable worksheets for Class 12 Geography Chapter 2 The World Population Distribution Density and Growth for free from StudiesToday.com. These have been made as per the latest CBSE curriculum for this academic year.
Yes, Class 12 Geography worksheets for Chapter 2 The World Population Distribution Density and Growth focus on activity-based learning and also competency-style questions. This helps students to apply theoretical knowledge to practical scenarios.
Yes, we have provided solved worksheets for Class 12 Geography Chapter 2 The World Population Distribution Density and Growth to help students verify their answers instantly.
Yes, our Class 12 Geography test sheets are mobile-friendly PDFs and can be printed by teachers for classroom.
For Chapter 2 The World Population Distribution Density and Growth, regular practice with our worksheets will improve question-handling speed and help students understand all technical terms and diagrams.