

Class 12 Accountancy Competency-Based Questions: CBSE Class 12 Accountancy Analysis of Financial Statements VBQs
Explore authentic value-based practice materials through the CBSE Class 12 Accountancy Analysis of Financial Statements VBQs. Tailored for Class 12 learners, utilizing these Accountancy VBQs ensures thorough preparation and strengthens moral reasoning skills before final CBSE evaluations.
Download Part 2 Chapter 04 Analysis of Financial Statements VBQ PDF with Solutions
View or download the dedicated CBSE Class 12 Accountancy Analysis of Financial Statements VBQs resource below. Engaging with these value-based scenarios ensures continuous academic progress and mastery of the 2026-27 exam format.
CBSE Class 12 Accountancy Analysis of Financial Statements VBQs
Question 1. Borrowing cost is in par with Rate of return.Still companies prefer to raise funds through borrowings and not through Share Capital. Identify the value followed by the company in raising funds.
Answer:
Management in few hands
Safe guarding
Interest of investors
Question 2. Government of India permitted NABARD to issue BhavishyaNirman Bond which channelized funds for priority areas of agriculture and rural development. The bank,accordingly has launched bonds of Rs.20,000/- per bond. The tenure of bonds is 10 years; however ,investors will have option to sell the bonds. The bonds have been rated as AAA by CRISIl and CARE. No tax will be deducted at source.
Answer:
Saving Habit
Improving the growth of agriculture sector
Rural Development
Question 3.A dealer of sewing machine in rural area wishes to purchase a number of sewing machines. He has only Rs.5760 to invest and has space for 20 items. An electronic sewing machine costs him Rs360 and manually operated sewing machine is Rs.240. He can sell an electronic sewing machine at a profit of Rs.22 and manually operated sewing machine at a profit of Rs.18. Justify the values to be promoted for the selection of manually operated machine.
Answer:
Conservation of Energy Electricity
Health Maintenance
Promoting Self skills
Question 4.By introducing debt in the capital structure shareholders are benefitted by getting more EPS, when company is being winded up shareholders may lose the investment money. Which value is violated?
Answer:
Values of Just and Equity
Question 5. The operating ratio of A Ltd; is 55% and that of B Ltd; is 65%. Which Company is performing better and identify the value.
Answer:
Social Responsibility
Saving in cost
Better utilization of Resources
Question 6. The Balance sheet of A ltd. showed Rs. 25 Lacs as Cash and Cash equivalents.Whereas its working capital requirement is only Rs. 5Lacs on an average. Which value do you think is missing in the financial planning of the company?
Answer:
Management of funds
Question 7.Prepare Comparative Statement from the following
31st March, 2007 31st March, 2008
Revenue from Operations 10,00,000 12,50,000
Cost of Goods Sold 5,00,000 6,50,000
Operating Expenses 50,000 60,000
Interest on investments Rs. 30.000 and taxes payable @ 50%. Identify the values involved in preparation of comparative statement.
Answer:
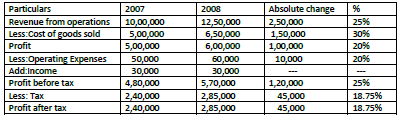
Question 8. Prepare a comparative income statement of X Ltd., with the help of the following information and identify the value involved in it-
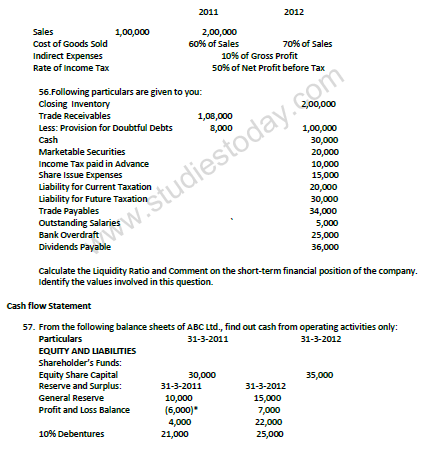
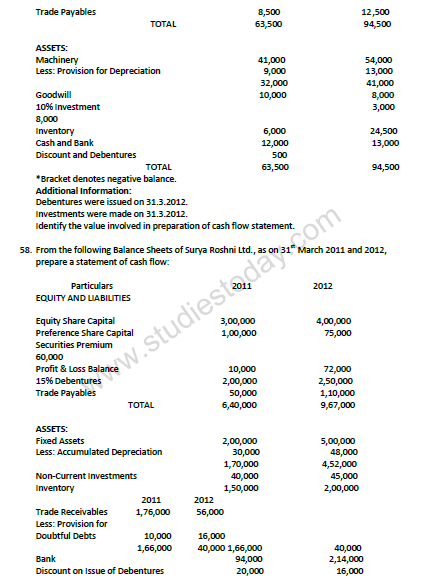
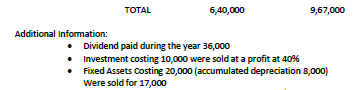
Additional debentures amounting to 50,000 were issued at par on 1st August 2011. Interest on debentures has been paid regularly. Mention the values involved in it.
Answer:
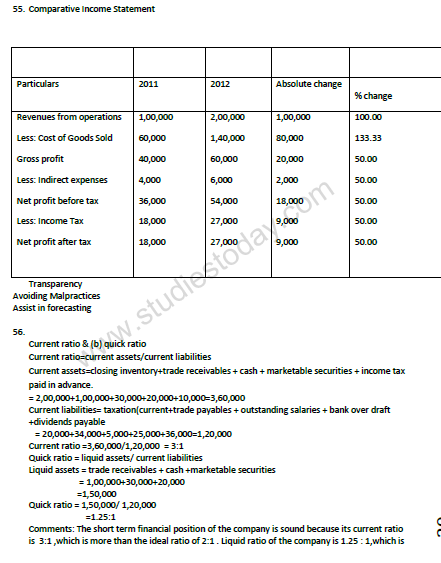

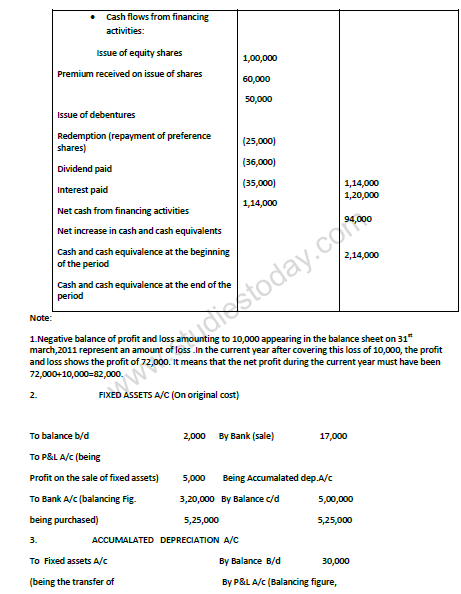
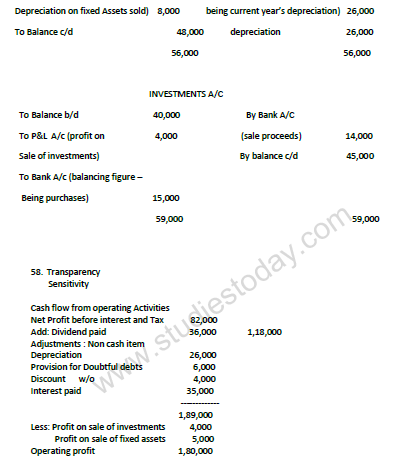
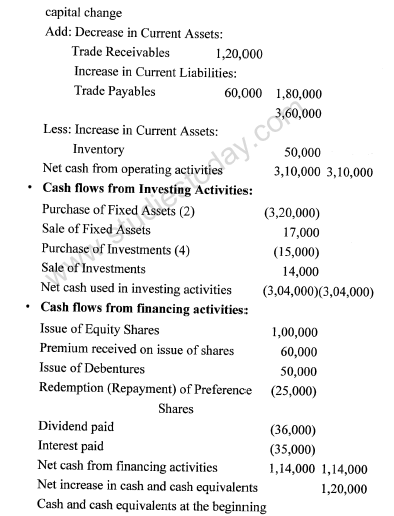
Question 9. It is mandatory for a public ltd. Company to prepare the cash flow statement as per AS-3(revised). Identify the value involved /followed by the company in preparing the statement .
Answer:
Transparency
Adherence to law
Question 10. When the company purchases an Asset and the vendors are settled by issue of shares and debentures, such transactions are not recorded in the cash flow statement as such transactions results in no flow of cash.Identify the value involved ?
Answer:
Adherence to accounting practice
Question 11. identify any two positive values involved in preparation of cash flow statement.
Answer:
Transparency
Sensitivity
Adherence to law
Question 12.Jamshedji Tata conceived an idea of formation of company in 1908 when East India Company was ruling Indian Market. He selected hilly region bordering three states Jharkhand (the then part of Bihar), Orissa and West Bengal. All states were thickly populated and under developed. Area he chose was rich in Iron ore so he decided to develop Iron and Steel Industry. He wanted to tap unproductive savings of public and Issued Capital of Rs. 5,00,000. Area was undeveloped so he decided to spend 10% of profits every year for providing Infrastructure to employees. To begin with he provided them accommodation and later he spent amount for schools, hospitals, development of playground and gardens and also contributed in road construction. He also built temples, mosques and churches. Employees were satisfied and worked hard as a result profit grew substantially 20% every year.More Industries were floated by him. Which values lead him to this road of success. (Any FIVE)
Answer:
i) Team work
ii) Employment
iii) Courage
iv) Sensitive towards social issue
v) Regional Development
vi) National Integration
vii) Capital formation
viii) improve people standard of living
ix) National Building
x) Motivation of employee.
Question 13.Cadbury India Ltd; a Chocolate company launched a factory in Baddi a small town of Himachal Pradesh. The workers who enter in factory have to wash their hands with sanitizer and wear overcoat, cap and shoes which are sterilized every day for which company spends Rs. 3,00,000 per month. All employees working in factory wear gloves and not allowed to touch directly either raw material or final product. All employees irrespective of their positions have to take food in mess at the same place and the same food . For this the company spends Rs. 4,00,000 per month. Which values are taken care of?
Answer: Equity/Equilibrium
Health Conscious
Balance Regional Development
Employment opportunity
Sharing & Caring
Question 14.MinalKhopkar’s 80 year old mother needs immediate knee replacement surgery. But it cannot take place as MS. Khopkar a resident of Pen in Maharastra’sRaigad district ,cannot access her account with the Urban Bank Ltd though she has three fixed deposits for 20lakh because of Chairman’s involvement in Bank Scam.The Bank operations were temporarily suspended.The Chairman allegedly responsible for their sufferings was the mastermind of a Rs.758 crore scam in bank.Justify the customer value violated by bank.Which value do you think is violated?
Answer:
Financial Regularity
Honesty
True/False
Question 21. Determining operating efficiency and profitability is an objective of financial analysis.
Answer: True
In simple words: Financial analysis helps us find out whether a company runs well and makes good profits. Both of these goals — checking efficiency and checking profits — are key reasons why we analyze financial statements.
Exam Tip: These are indeed core objectives — they're what most managers and investors want to learn from analyzing statements.
Question 22. Financial statement analysis does not ignore qualitative elements.
Answer: False
In simple words: Financial statements deal only with numbers and money facts. They ignore soft factors like the quality of the management team, worker morale, brand reputation, and customer loyalty. These qualitative things are not measured in accounting statements, even though they matter.
Exam Tip: This is a key weakness — statements miss the human and intangible side of business. Always remember what financial analysis cannot tell you.
Question 23. Horizontal analysis is based on one year's financial data.
Answer: False
In simple words: Horizontal analysis compares financial data across multiple years to find trends and changes over time. It requires at least two years of data, not just one. If you only have one year, you cannot do horizontal analysis.
Exam Tip: Horizontal means across time — you need multiple years. Vertical analysis is the one that uses a single year's data.
Question 24. Financial statement analysis is always free from personal bias.
Answer: False
In simple words: Even though analysis uses numbers, the person doing it can still let their own views and wishes shape how they interpret the results. Different analysts might look at the same statements and reach different conclusions based on what they want to believe.
Exam Tip: Remember this limitation — analysis is not purely objective. Bias can creep in through how you choose to present or focus on certain figures.
Question 25. Financial analysis is significant for investors, bankers, lenders, employees and management.
Answer: True
In simple words: All these groups have a stake in a company and need to understand its financial health. Investors and bankers decide whether to put money in. Lenders check if loans will be repaid. Employees care about job security. Management uses it for decisions. Everyone gains from good financial analysis.
Exam Tip: Think of financial analysis as a tool for all stakeholders — it serves many different audiences, each with their own questions to answer.
Fill in the Blanks
Question 26. The comparison of financial statements of a firm with that of another firm is known as ________.
Answer: inter-firm comparison.
In simple words: When you place one company's financial statements side by side with another company's statements to find differences and similarities, this process is called inter-firm comparison. It helps you see how one business stacks up against its rivals.
Exam Tip: Inter-firm means between firms — it's the opposite of intra-firm, which compares different departments within the same firm.
Question 27. In a firm, share capital is Rs 3,00,000 and Rs 3,60,000 at the end of two consecutive years. The percentage change is ________.
Answer: 20% increase.
In simple words: Share Capital grew from Rs 3,00,000 to Rs 3,60,000. Using the percentage change formula: (3,60,000 - 3,00,000) / 3,00,000 × 100 = 60,000 / 3,00,000 × 100 = 20%. This is an increase because the new figure is higher.
Exam Tip: Always show whether the change is an increase or decrease in your answer — it makes your meaning clear.
Question 28. __________ analysis is considered as dynamic.
Answer: Horizontal
In simple words: Horizontal analysis studies how figures move and change across multiple time periods. Because it follows change over time, it is called dynamic analysis. It moves across years to show trends, unlike static analysis which freezes one moment.
Exam Tip: Dynamic suggests motion and change over time — Horizontal analysis is the tool that tracks these changes year after year.
Question 29. Financial Statement analysis ignores price level changes, it is its ________.
Answer: limitation
In simple words: One major weakness of financial analysis is that it does not account for inflation or deflation. When prices rise or fall, old money figures become hard to compare with new ones, making the analysis less trustworthy. This inability to adjust for price changes is a real drawback.
Exam Tip: This is a critical limitation to mention in exams — always note that inflation is not addressed in standard financial analysis.
Question 30. In a company, Revenue from operations is Rs 6,00,000 and employee benefit expenses are Rs 75,000. __________ will be its percentage to revenue from operations.
Answer: 12.5%
In simple words: To find the percentage, divide employee benefit expenses by revenue: 75,000 / 6,00,000 = 0.125 = 12.5%. This tells us that one-eighth of the company's revenue goes toward paying its workers and covering their benefits.
Exam Tip: When calculating percentages of revenue, always divide the expense by total revenue and multiply by 100. This shows the cost as a share of income.
Question 28. How can 'Analysis of Historical Records' be considered a limitation of Comparative Statements?
Answer: Comparative Statements give an analysis of past financial statements. It is not reflective of future which is more relevant and useful.
In simple words: Comparative Statements only look back at what happened before. They don't show what may happen in the future, which is what people really need to know.
Exam Tip: Remember this is a key weakness - comparative analysis is historical by nature, so it cannot predict or guide future decisions.
Question 29. What is meant by intra-firm comparison?
Answer: When the financial statements of a firm for two or more years are compared, it is called intra-firm comparison.
In simple words: Intra-firm comparison means looking at one company's financial statements from different years side by side to see how it changed.
Exam Tip: Use the term "intra-firm" for internal company comparison over time, as opposed to comparing different companies.
Question 30. If a Company has Fixed Assets ₹6,00,000; Non-current Investments ₹1,00,000 and Current Assets ₹3,00,000, then find out the percentage of Current Assets to Total Assets.
Answer: Current assets are 30% of total assets.
In simple words: Total Assets = ₹6,00,000 + ₹1,00,000 + ₹3,00,000 = ₹10,00,000. Current assets of ₹3,00,000 divided by total of ₹10,00,000 equals 30%.
Exam Tip: Always add all asset categories to get the total, then divide the specific category by the total and multiply by 100 to get the percentage.
Question 31. If a Company has Fixed Assets worth ₹390 crores and Current Assets ₹260 crores, then find out the percentage of Current Assets to Total Assets.
Answer: Current assets are 40% of total assets.
In simple words: Total Assets = ₹390 crores + ₹260 crores = ₹650 crores. Current assets of ₹260 crores divided by total of ₹650 crores equals 40%.
Exam Tip: Apply the same formula consistently: (Current Assets / Total Assets) × 100 to find the percentage.
Question 32. Why are common size statements also known as 100% statements?
Answer: Common size statements are also known as 100% statements because in these statements, all items are expressed as percentage of the base item which is 100.
In simple words: In common size statements, one item is set as the base (100%), and all other items are shown as what percentage they are of that base. This helps compare items easily.
Exam Tip: Common size statements express all figures as percentages so items can be compared fairly across different years or companies, regardless of actual size.
Question 33. If a company has total equity and liabilities of worth ₹9,00,000 and shareholders' funds of ₹3,00,000, then find out the percentage of shareholders' funds to total equity and liabilities?
Answer: Shareholders' funds are 33.33% of total equity and liabilities.
In simple words: Shareholders' funds of ₹3,00,000 divided by total equity and liabilities of ₹9,00,000 equals 33.33%.
Exam Tip: To find the percentage of any component, divide that component by the total and multiply by 100.
Short Answer Questions [3, 4 marks]
Question 1. State the objectives of 'Analysis of Financial Statements'.
Answer: Objectives of 'Financial Statements Analysis': (Any four)
(i) Assessing the earning capacity or profitability of the firm as a whole as well as of its different departments so as to judge the financial health of the firm.
(ii) Assessing the managerial efficiency by using financial ratios to identify favourable and unfavourable variations in managerial performance.
(iii) Assessing the short-term and the long-term solvency of the enterprise to assess the ability of the company to repay principal amount and interest.
(iv) Assessing the performance of business in comparison to that of others through inter firm comparison.
(v) Assessing developments in future by forecasting and preparing budgets.
(vi) To Ascertain the relative importance of different components of the financial position of the firm.
In simple words: Financial analysis helps determine if a company makes good profits, if managers are doing their job well, if the company can pay its debts, how it compares to other businesses, and what may happen in the future.
Exam Tip: Remember any four objectives are acceptable - focus on the main purposes: profitability, efficiency, solvency, comparison, and forecasting.
Question 2. Explain briefly any four limitations of analysis of financial statements.
Answer: Limitations of 'Financial Statements Analysis': (Any four)
(i) It is a historial Analysis as it analyses what has happened till date. It does not reflect the future.
(ii) It ignores price level changes as a change in price level makes analysis of financial statements of different accounting years invalid.
(iii) It ignores quantative aspect as the quality of management, quality of staff etc. are ignored while carrying out the analysis of financial statements.
(iv) It suffers from the limitations of financial statements as the analysis is based on the information given in the financial statements.
(v) It is not free from bias of accountants such as method of inventory valuation, method of depreciation, etc.
(vi) It may lead to window dressing, i.e. showing a better financial position than what actually is by manipulating the books of accounts.
(vii) It may be misleading without the knowledge of the changes in accounting procedure by a firm.
In simple words: Financial analysis looks only at what happened in the past, ignores inflation or price changes, doesn't consider management quality, depends on the accuracy of financial statements, can be biased by accounting choices, may be misleading if a firm changes how it does its accounting, and can be used to make a company look better than it really is.
Exam Tip: Select any four limitations and explain each clearly - common ones in exams are historical nature, price level changes, bias, and window dressing.
Question 3. Briefly explain the significance of 'Analysis of financial statements' to (a) The Finance Manager, (b) Trade Payables.
Answer: (a) Significance to the Finance Manager: Finance Manager can make policies and decisions keeping in mind the liquidity, solvency, efficiency and profitability position of the terms of the firm.
(b) Significance to Trade Payables: Trade payables can know whether the firm is able to pay their debts on time or not.
In simple words: (a) Finance managers use analysis to make better decisions about cash flow, debt, spending, and profit. (b) Suppliers and creditors use analysis to decide if they should do business with a company or if the company will pay them on time.
Exam Tip: Connect the analysis significance to each user's specific needs - managers focus on internal strategy while trade payables focus on payment ability.
Question 4. From the following "Statement of Profit and Loss" for the year ended 31st March, 2013, prepare a 'Comparative Statement of Profit and Loss' of Good Services Ltd.:
Answer:
| Particulars | Note No. | 2011-12 (₹) | 2012-13 (₹) | Absolute Change (₹) | Percentage Change (%) | |
|---|---|---|---|---|---|---|
| A | - | - | B | (B - A) = C | C/A × 100 = D | |
| I. | Revenue from Operations | - | 15,00,000 | 20,00,000 | 5,00,000 | 33.33 |
| II. | Other Income | - | 4,00,000 | 10,00,000 | 6,00,000 | 150 |
| III. | Total Revenue (I + II) | - | 19,00,000 | 30,00,000 | 11,00,000 | 57.89 |
| IV. | Expenses | - | 15,00,000 | 21,00,000 | 6,00,000 | 40 |
| V. | Profit before tax (III - IV) | - | 4,00,000 | 9,00,000 | 5,00,000 | 125 |
| VI. | Income tax @ 50% | - | 2,00,000 | 4,50,000 | 2,50,000 | 125 |
| VII. | Profit after tax (V - VI) | - | 2,00,000 | 4,50,000 | 2,50,000 | 125 |
In simple words: The comparative statement shows how each item changed from 2011-12 to 2012-13. Revenue grew by ₹5,00,000 (33.33%), other income jumped by ₹6,00,000 (150%), expenses rose by ₹6,00,000 (40%), and profit after tax climbed by ₹2,50,000 (125%).
Exam Tip: Always calculate absolute change (difference) first, then percentage change using the formula (New - Old) / Old × 100. Present data clearly in a table format.
Question 5. From the following Statement of Profit and Loss of Suntrack Ltd., for the years ended 31st March, 2011 and 2012, prepare a 'Comparative Statement of Profit and Loss':
Answer:
| Particulars | Note No. | Absolute Amounts (₹) | Absolute Change (₹) | Percentage Change (%) | |
|---|---|---|---|---|---|
| 2010-11 | 2011-12 | (B - A) = C | C/A × 100 = D | ||
| A | B | ||||
| I. | Revenue from Operations | 12,00,000 | 20,00,000 | 8,00,000 | 66.67 |
| II. | Other Incomes | 9,00,000 | 12,00,000 | 3,00,000 | 33.33 |
| III. | Total Revenue (I + II) | 21,00,000 | 32,00,000 | 11,00,000 | 52.38 |
| IV. | Expenses | 10,00,000 | 13,00,000 | 3,00,000 | 30.00 |
| V. | Net Profit (III - IV) | 11,00,000 | 19,00,000 | 8,00,000 | 72.73 |
In simple words: The statement compares two years. Revenue from operations grew by ₹8,00,000 (66.67%), other income rose by ₹3,00,000 (33.33%), expenses climbed by ₹3,00,000 (30%), and net profit jumped by ₹8,00,000 (72.73%).
Exam Tip: Always ensure you calculate total revenue correctly by adding all income sources, then subtract total expenses to find net profit before presenting in table format.
Question 6. From the following information, prepare a Comparative Statement of Profit and Loss of Y Ltd. for the years ended 31st March, 2014 and 2015:
Answer:
| Particulars | 31st March 2014 (₹) | 31st March 2015 (₹) | Absolute Change (₹) | Percentage Change (%) |
|---|---|---|---|---|
| A | - | B | (B - A) = C | C/A × 100 = D |
| I. Revenue from Operations | 10,00,000 | 20,00,000 | 10,00,000 | 100.00 |
| II. Expenses | ||||
| (a) Cost of Materials Consumed | 6,00,000 | 15,00,000 | 9,00,000 | 150.00 |
| (b) Other Expenses | 60,000 | 1,80,000 | 1,20,000 | 200.00 |
| Total Expenses | 6,60,000 | 16,80,000 | 10,20,000 | 154.55 |
| III. Net Profit before Tax (II - III) | 3,40,000 | 3,20,000 | (20,000) | (5.88) |
| IV. Less: Tax | 1,02,000 | 1,28,000 | 26,000 | 25.49 |
| V. Net Profit after tax (III - IV) | 2,38,000 | 1,92,000 | (46,000) | (19.33) |
In simple words: From 2014 to 2015, revenue doubled from ₹10,00,000 to ₹20,00,000 (100% rise). However, expenses grew much faster (154.55% rise), so profit actually fell by ₹46,000 (19.33% drop).
Exam Tip: When preparing comparative statements, calculate each expense category first (remember 12% of materials in 2015 is 12% of 15,00,000 = 1,80,000), then calculate taxes based on profit before tax at 40%, and finally show the changes in both absolute and percentage terms.
Question 7. Following is the Income Statement of Raj Ltd. for the year ended 31st March, 2017. Prepare a Common Size Income Statement of Raj Ltd. for the year ended 31st March, 2017.
Answer:
| Particulars | Note No. | Absolute Amount (₹) | Percentage of Revenue from Operations (%) |
|---|---|---|---|
| I. Revenue from Operations | 2,00,000 | 100.00 | |
| II. Other Income | 15,000 | 7.50 | |
| III. Total Revenue (I + II) | 2,15,000 | 107.50 | |
| IV. Expenses | |||
| Cost of Materials Consumed | 1,10,000 | 55.00 | |
| Other Expenses | 5,000 | 2.50 | |
| Total Expenses | 1,15,000 | 57.50 | |
| V. Profit before Tax (III - IV) | 1,00,000 | 50.00 | |
| VI. Tax paid | 40,000 | 20.00 | |
| VII. Profit after Tax (V - VI) | 60,000 | 30.00 |
In simple words: In a common size statement, all items are shown as percentages of revenue from operations (₹2,00,000 = 100%). This makes it easy to see what portion of each rupee earned goes to different expenses and profit.
Exam Tip: Remember to base all percentages on revenue from operations only (not total revenue), use the formula (Item Amount / Revenue from Operations) × 100, and note that the statement must state this clearly in a note at the bottom.
Question 8. From the following information given below, prepare a comparative income statement.
Answer:
| Particulars | Note No. | 31.03.2016 (₹) | 31.03.2017 (₹) | Absolute Change (™) | Percentage Change (%) |
|---|---|---|---|---|---|
| A | B | (B - A) = C | C/A × 100 = D | ||
| I. Revenue from Operations (Net) | 2,00,000 | 2,00,000 | - | - | |
| II. Other Income | - | - | - | - | |
| III. Total Revenue (I + II) | 2,00,000 | 2,00,000 | - | - | |
| IV. Expenses | |||||
| (a) Cost of Materials Consumed | 1,20,000 | 1,00,000 | (20,000) | (16.67) | |
| (b) Other Expenses | 16,000 | 10,000 | (6,000) | (37.50) | |
| Total Expenses | 1,36,000 | 1,10,000 | (26,000) | (19.12) | |
| V. Profit before Tax (III - IV) | 64,000 | 90,000 | 26,000 | 40.63 | |
| VI. Tax @ 40% | 25,600 | 36,000 | 10,400 | 40.63 | |
| VII. Profit after Tax (V - VI) | 38,400 | 54,000 | 15,600 | 40.63 |
Working Note:
| Particulars | 2016 (₹) | 2017 (₹) |
|---|---|---|
| Revenue from Operations | 3,00,000 | 4,00,000 |
| Less: Sales Return | 1,00,000 | 2,00,000 |
| Revenue from Operations (Net) | 2,00,000 | 2,00,000 |
| Less: Cost of Materials Consumed | 1,20,000 | 1,00,000 |
| Gross Profit | 80,000 | 1,00,000 |
| Administrative Expenses | 20% on Gross Profit | 10% on Gross Profit |
| 16,000 | 10,000 |
In simple words: Revenue remained the same at ₹2,00,000 in both years. Material costs fell by ₹20,000 (from 60% to 50% of net revenue), and other expenses dropped by ₹6,000. This enabled profit before tax to climb by ₹26,000 (40.63%), and profit after tax to rise by ₹15,600 (40.63%).
Exam Tip: When calculating administrative expenses as percentages, apply them to gross profit (revenue minus cost of materials), not to total revenue. Always show your working notes clearly so the examiner can follow your calculations.
Question 9. From the following information, prepare a comparative income statement for the year 2016-2017.
Answer:
| Particulars | 2015-16 (₹) | 2016-17 (₹) | Absolute Change (₹) | Percentage Change (%) |
|---|---|---|---|---|
| I. Revenue from Operations | 7,00,000 | 8,50,000 | 1,50,000 | 21.43 |
| II. Materials Consumed | 3,30,000 | 4,20,000 | 90,000 | 27.27 |
| III. Gross Profit (I - II) | 3,70,000 | 4,30,000 | 60,000 | 16.22 |
| IV. Manufacturing and Office Expenses: | ||||
| Manufacturing Expenses (50% of Total) | 1,20,000 | 1,30,000 | 10,000 | 8.33 |
| Office Expenses (50% of Total) | 1,20,000 | 1,30,000 | 10,000 | 8.33 |
| Total Manufacturing and Office Expenses | 2,40,000 | 2,60,000 | 20,000 | 8.33 |
| V. Profit before Tax (III - IV) | 1,30,000 | 1,70,000 | 40,000 | 30.77 |
| VI. Income Tax @ 50% | 65,000 | 85,000 | 20,000 | 30.77 |
| VII. Profit after Tax (V - VI) | 65,000 | 85,000 | 20,000 | 30.77 |
In simple words: From 2015-16 to 2016-17, revenue grew by ₹1,50,000 (21.43%), materials consumed jumped by ₹90,000 (27.27%), manufacturing and office expenses rose by ₹20,000 (8.33%), and profit after tax climbed by ₹20,000 (30.77%) due to better cost management.
Exam Tip: When expenses are given as percentages of a category, calculate each component separately and clearly show your working. Remember that manufacturing expenses at 50% of the total = 50% of ₹2,60,000 = ₹1,30,000 in 2016-17.
Question 10. With the help of the following information obtained from the books of Raj Silk Mills, prepare a Comparative Income Statement for the year ended 31.3.2017:
Answer:
| Particulars | Note No. | 31st March, 2017 (Rs) | 31st March, 2016 (Rs) |
|---|---|---|---|
| Revenue from Operations | 36,00,000 | 20,00,000 | |
| Cost of Materials Consumed | 12,00,000 | 10,00,000 | |
| Other Expenses | 2,40,000 | 1,00,000 | |
| Total Expenses | 14,40,000 | 11,00,000 | |
| Profit before Tax | 21,60,000 | 9,00,000 | |
| Less: Tax @ 50% | 10,80,000 | 4,50,000 | |
| Net Profit after Tax | 10,80,000 | 4,50,000 |
In simple words: First figure out the cost of materials and other expenses for each year from the given percentages. Add these costs to get total expenses. Subtract total expenses from revenue to find profit before tax. Then deduct the tax to get the final profit after tax.
Exam Tip: Always calculate missing values using the percentage information provided, then verify that the statement balances correctly before finalizing.
Question 11. Prepare a Comparative Statement of Profit and Loss from the following details:
Answer:
| Particulars | Note No. | 31.03.2012 (Rs) | 31.03.2013 (Rs) | Absolute Change (Rs) | Percentage Change (%) |
|---|---|---|---|---|---|
| I. Revenue from Operations | 20,00,000 | 30,00,000 | 10,00,000 | 50 | |
| II. Other Income | 4,00,000 | 4,50,000 | 50,000 | 12.5 | |
| III. Total Revenue (I + II) | 24,00,000 | 34,50,000 | 10,50,000 | 43.75 | |
| IV. Expenses | 10,00,000 | 18,00,000 | 8,00,000 | 80 | |
| V. Profit before Tax (III - IV) | 14,00,000 | 16,50,000 | 2,50,000 | 17.85 |
In simple words: Revenue and expenses both grew from 2012 to 2013. Even though expenses went up more sharply, total profit still improved by Rs 2,50,000. The revenue increase of 50% shows strong business growth over the period.
Exam Tip: When calculating percentage change, always use the base year (earlier year) value as the denominator to show the true rate of growth.
Question 12. From the following Statement of Profit and Loss for the year ended 31st March, 2016, prepare Common Size Statement of Profit and Loss:
Answer:
| Particulars | Note No. | Absolute Amounts (Rs) | Percentage of Revenue from Operations | ||
|---|---|---|---|---|---|
| 2015 (Rs) | 2016 (Rs) | 2015 (%) | 2016 (%) | ||
| I. Revenue from Operations | 5,00,000 | 6,25,000 | 100.00 | 100.00 | |
| II. Expenses: | |||||
| Purchase of Stock-in-Trade | 3,60,000 | 4,35,000 | 72.00 | 69.60 | |
| Changes in Inventories of Stock-in-Trade | 15,000 | (10,000) | 3.00 | (1.60) | |
| Employees Benefit Expenses | 10,000 | 15,000 | 2.00 | 2.40 | |
| Depreciation and Amortisation Expenses | 15,000 | 25,000 | 3.00 | 4.00 | |
| Total Expenses | 4,00,000 | 4,65,000 | 80.00 | 74.40 | |
| III. Profit before Tax (I - II) | 1,00,000 | 1,60,000 | 20.00 | 25.60 | |
| IV. Tax @ 40% | 40,000 | 64,000 | 8.00 | 10.24 | |
| V. Profit after Tax (III - IV) | 60,000 | 96,000 | 12.00 | 15.36 | |
In simple words: A common size statement shows each item as a percentage of total revenue. This helps compare how the business structure changed year to year. In 2016, expenses dropped to 74.40% of revenue, leaving more profit margin at 25.60% compared to 2015's 20.00%.
Exam Tip: In common size statements, always base all percentages on the same denominator (revenue from operations) to make year-on-year comparisons meaningful and clear.
Question 13. From the following information, prepare Comparative Balance Sheet of X Ltd.:
Answer:
| Particulars | 31st March, 2016 (Rs) | 31st March, 2017 (Rs) | Absolute Change (Rs) | Percentage Change (%) |
|---|---|---|---|---|
| I. EQUITY AND LIABILITIES: | ||||
| 1. Shareholders' Funds | ||||
| (a) Share Capital | 25,00,000 | 25,00,000 | — | — |
| (b) Reserves and Surplus | 10,00,000 | 6,00,000 | (4,00,000) | (40) |
| 2. Non-Current Liabilities | ||||
| (a) Long term Borrowings | 15,00,000 | 16,00,000 | 1,00,000 | 6.67 |
| 3. Current Liabilities | 4,50,000 | 5,00,000 | 50,000 | 11.11 |
| Total | 54,50,000 | 52,00,000 | (2,50,000) | (4.58) |
| II. ASSETS: | ||||
| 1. Non-Current Assets | ||||
| (a) Fixed Assets | 25,00,000 | 35,00,000 | 10,00,000 | 40 |
| (b) Non-Current Investments | 15,00,000 | 10,50,000 | (4,50,000) | (30) |
| 2. Current Assets | 14,50,000 | 6,50,000 | (8,00,000) | (55.17) |
| Total | 54,50,000 | 52,00,000 | (2,50,000) | (4.58) |
In simple words: The company's total assets and liabilities fell slightly from Rs 54,50,000 to Rs 52,00,000. Fixed assets grew by 40%, but current assets dropped sharply. Reserves fell by 40%, showing lower retained profits in 2017 than in 2016.
Exam Tip: When preparing a comparative balance sheet, always verify that total assets equal total liabilities plus equity on both dates to confirm accuracy.
Question 1. From the following Balance Sheets of Megha Textile Ltd., prepare a Comparative Balance Sheet and comment upon the changes:
Answer:
| Particulars | Note No. | 2016 (Rs) | 2017 (Rs) | Absolute Change (Rs) | Percentage Change (%) |
|---|---|---|---|---|---|
| I. EQUITY AND LIABILITIES | |||||
| 1. Shareholders' Funds | |||||
| (a) Share Capital | 10,00,000 | 20,00,000 | 10,00,000 | 100.00 | |
| (b) Reserves and Surplus | 6,00,000 | 4,00,000 | (2,00,000) | (33.33) | |
| 2. Non-Current Liabilities | |||||
| (a) Long-term Borrowings | 10,00,000 | 16,00,000 | 6,00,000 | 60.00 | |
| 3. Current Liabilities | 4,00,000 | 8,00,000 | 4,00,000 | 100.00 | |
| Total | 30,00,000 | 48,00,000 | 18,00,000 | 60.00 | |
| II. ASSETS | |||||
| 1. Non-Current Assets | |||||
| (a) Fixed Assets | 20,00,000 | 30,00,000 | 10,00,000 | 50.00 | |
| 2. Current Assets | |||||
| (a) Inventories | 4,00,000 | 8,00,000 | 4,00,000 | 100.00 | |
| (b) Cash and Cash Equivalents | 6,00,000 | 10,00,000 | 4,00,000 | 66.66 | |
| Total | 30,00,000 | 48,00,000 | 18,00,000 | 60.00 |
Comments: The study of the above Comparative Balance Sheet provides the following findings:
(i) Share Capital has grown by Rs 10,00,000, i.e., 100% growth, that has improved the financial stability of the company.
(ii) Reserves and Surplus have fallen by Rs 2,00,000, i.e., 33.33% fall, which shows a loss in the business during the current year.
(iii) Fixed assets have grown by Rs 10,00,000, i.e., 50% growth.
(iv) Current liabilities have grown by Rs 4,00,000, i.e., 100% growth, but current assets have also grown by Rs 8,00,000, i.e., 80% growth.
In simple words: The company doubled its share capital, showing strong investor backing. However, profits fell during the year. The business bought more fixed assets and held more inventory and cash, suggesting expansion plans despite lower earnings.
Exam Tip: Always comment on major changes in key areas - capital, reserves, liabilities, and asset composition - to show thorough financial analysis beyond just calculating numbers.
Question 2. Prepare a Common Size Balance Sheet and comment on the financial position of M Ltd. and N Ltd. The Balance Sheets of M Ltd. and N Ltd. as at 31st March, 2017 are given below:
Answer: Common Size Balance Sheet of M Ltd. and N Ltd. as at 31st March, 2017
| Particulars | Note No. | M Ltd. (Rs) | % of Total | N Ltd. (Rs) | % of Total |
|---|---|---|---|---|---|
| I. EQUITY AND LIABILITIES: | |||||
| 1. Shareholders' Funds | |||||
| Share Capital | 6,00,000 | 50.00 | 8,00,000 | 53.33 | |
| 2. Non-Current Liabilities | |||||
| Long-term Borrowings | 4,00,000 | 33.33 | 6,00,000 | 40.00 | |
| 3. Current Liabilities | |||||
| Trade Payables | 2,00,000 | 16.67 | 1,00,000 | 6.67 | |
| Total | 12,00,000 | 100.00 | 15,00,000 | 100.00 | |
| II. ASSETS | |||||
| 1. Non-Current Assets | |||||
| Fixed Assets | |||||
| (i) Tangible Assets | 5,00,000 | 41.67 | 6,00,000 | 40.00 | |
| (ii) Intangible Assets | 3,00,000 | 25.00 | 2,00,000 | 13.33 | |
| 2. Current Assets | |||||
| Cash and Cash Equivalents | 4,00,000 | 33.33 | 7,00,000 | 46.67 | |
| Total | 12,00,000 | 100.00 | 15,00,000 | 100.00 |
Interpretation: The following differences may be noted in the financial position of both the companies on the basis of above Common Size Balance Sheets of M Ltd. and N Ltd.:
(i) The short-term financial position of N Ltd. is definitely better as compared to M Ltd. The current liabilities of N Ltd. are 6.67% of total funds invested whereas a proportion of current assets in these funds is 46.67%. On the other hand, the current liabilities of M Ltd. are 16.67% of total funds and current assets are 33.33% of these funds. Thus, the Trade Payables are more secured in N Ltd.
(ii) The long-term financial position of N Ltd. is also better than M Ltd. because net worth is 93.33% of total funds in case of N Ltd. while it is 83.33% in M Ltd.
(iii) M Ltd. has invested more amount (66.67%) in fixed assets as compared to (53.33%) N Ltd. Similarly, other percentages have been calculated.
In simple words: Common Size Balance Sheet shows each item as a percentage of the total. This helps compare two companies of different sizes. N Ltd. has a stronger short-term position because it owes less and holds more cash. N Ltd. also has better long-term strength with higher net worth. M Ltd. invests more in fixed assets while N Ltd. keeps more cash on hand.
Exam Tip: When comparing companies using common size statements, always focus on relative percentages rather than absolute figures - this makes comparison fair regardless of company size.
Question 1. Unique Ltd. Comparative Statement of Profit and Loss for the years ended 31st March, 2018 and 2019. Complete the above Comparative Statement of Profit and Loss for the year ended 31st March, 2018 and 2019.
Answer:
| Particulars | Note No. | 31st March, 2018 (Rs) | 31st March, 2019 (Rs) | Absolute Change (Increase or Decrease) (Rs) | Percentage Change (Increase or Decrease) (%) |
|---|---|---|---|---|---|
| I. Revenue from Operations | A | 8,40,000 | 16,00,000 | 7,60,000 | 90.48 |
| II. Expenses: | |||||
| (a) Purchases of Stock-in-Trade | 5,00,000 | 9,00,000 | 4,00,000 | 80.00 | |
| (b) Change in Inventories of Stock-in-Trade | 1,00,000 | 1,00,000 | - | - | |
| (c) Other Expenses | 60,000 | 80,000 | 20,000 | 33.33 | |
| Total Expenses | 6,60,000 | 10,80,000 | 4,20,000 | 63.64 | |
| III. Profit before Tax (I - II) | 1,80,000 | 5,20,000 | 3,40,000 | 188.89 | |
| IV. Less: Tax | 54,000 | 1,56,000 | 1,02,000 | 188.89 | |
| V. Profit after Tax (III - IV) | 1,26,000 | 3,64,000 | 2,38,000 | 188.89 |
In simple words: The company's revenue grew from Rs 8,40,000 to Rs 16,00,000, showing a 90.48% increase. Expenses also went up from Rs 6,60,000 to Rs 10,80,000. However, profit jumped significantly from Rs 1,26,000 to Rs 3,64,000 because revenue grew faster than expenses.
Exam Tip: When filling comparative statements, always verify that totals match the sum of their components - use this as a check before finalizing your answer.
Question 2. Following is the Comparative Balance Sheets of Sara Textile Ltd. You are required to complete the missing values:
Answer:
| Particulars | Note No. | 2016 (Rs) | 2017 (Rs) | Absolute Change (Rs) | Percentage Change (%) |
|---|---|---|---|---|---|
| I. EQUITY AND LIABILITIES | |||||
| 1. Shareholders' Funds | |||||
| (a) Share Capital | 2,50,000 | 5,00,000 | 2,50,000 | 100.00 | |
| (b) Reserves and Surplus | 1,50,000 | 1,00,000 | (50,000) | (33.33) | |
| 2. Non-Current Liabilities | |||||
| (a) Long-term Borrowings | 2,50,000 | 4,00,000 | 1,50,000 | 60.00 | |
| 3. Current Liabilities | |||||
| (a) Short-term Borrowings | 1,00,000 | 2,00,000 | 1,00,000 | 100.00 | |
| Total | 7,50,000 | 12,00,000 | 4,50,000 | 60.00 | |
| II. ASSETS | |||||
| 1. Non-Current Assets | |||||
| (a) Fixed Assets | |||||
| (i) Tangible Assets | 5,00,000 | 7,50,000 | 2,50,000 | 50.00 | |
| 2. Current Assets | |||||
| (a) Inventories | 1,00,000 | 2,00,000 | 1,00,000 | 100.00 | |
| (b) Cash and Cash Equivalents | 1,50,000 | 2,50,000 | 1,00,000 | 66.67 | |
| Total | 7,50,000 | 12,00,000 | 4,50,000 | 60.00 |
In simple words: Sara Textile Ltd. grew its total assets from Rs 7,50,000 to Rs 12,00,000, a 60% increase. Share Capital doubled, and all liabilities increased. On the asset side, tangible assets grew by 50%, and both inventories and cash rose significantly.
Exam Tip: Always check that the balance sheet equation holds true - Total Assets must equal Total Liabilities plus Equity for both years.
Question 3. You are provided with common size income statement of ALX Ltd. with missing information. You are required to fill in the blanks:
Answer:
| Particulars | Note No. | Absolute Amounts 2016 (Rs) | Absolute Amounts 2017 (Rs) | Percentage of Revenue from Operations 2016 (%) | Percentage of Revenue from Operations 2017 (%) |
|---|---|---|---|---|---|
| I. Revenue from Operations | 2,50,000 | 3,12,500 | 100.00 | 100.00 | |
| II. Expenses: | |||||
| Purchase of Stock in Trade | 1,80,000 | 2,17,500 | 72.00 | 69.60 | |
| Changes in Inventories of Stock-in-Trade | 7,500 | (5,000) | 3.00 | (1.60) | |
| Employees Benefit Expenses | 5,000 | 7,500 | 2.00 | 2.40 | |
| Depreciation and Amortisation Expenses | 7,500 | 12,500 | 3.00 | 4.00 | |
| Total Expenses | 2,00,000 | 2,32,500 | 80.00 | 74.40 | |
| III. Profit before Tax (I - II) | 50,000 | 80,000 | 20.00 | 25.60 | |
| IV. Less: Tax @ 40% | 20,000 | 32,000 | 8.00 | 10.24 | |
| V. Profit after Tax (III - IV) | 30,000 | 48,000 | 12.00 | 15.36 |
In simple words: ALX Ltd. showed improvement from 2016 to 2017. Revenue grew from Rs 2,50,000 to Rs 3,12,500. While total expenses also rose in absolute terms, they fell as a percentage of revenue from 80% to 74.40%. This means the company became more efficient, and profit after tax rose from Rs 30,000 to Rs 48,000.
Exam Tip: In common size statements, always verify that all percentages for a given year add up correctly - expenses should total to a specific percentage, and profit before and after tax should match the formula.
Free study material for Accountancy
VBQs with Answers for Class 12 Accountancy Part 2 Chapter 04 Analysis of Financial Statements
Download VBQs for Class 12 Accountancy Part 2 Chapter 04 Analysis of Financial Statements
Access targeted moral and value-driven questions for Class 12 Accountancy Part 2 Chapter 04 Analysis of Financial Statements. Designed to align with official CBSE guidelines, these problem sets test deep comprehension beyond standard textbook answers.
Expert Guidance for Part 2 Chapter 04 Analysis of Financial Statements VBQs
Built using the official NCERT book for Class 12 Accountancy, these solved problem sets provide reliable guidance. Cross-reference your answers with our expert-verified keys for complete conceptual clarity.
Enhance Analytical Depth for Class 12 Accountancy
Explore our wider library of free chapter notes, worksheets, and online mock tests to support your ongoing revision and secure top-tier academic results.
FAQs
The latest collection of Value Based Questions for Class 12 Accountancy Part 2 Chapter 04 Analysis of Financial Statements is available for free on StudiesToday.com. These questions are as per 2026 academic session to help students develop analytical and ethical reasoning skills.
Yes, all our Accountancy VBQs for Part 2 Chapter 04 Analysis of Financial Statements come with detailed model answers which help students to integrate factual knowledge with value-based insights to get high marks.
VBQs are important as they test student's ability to relate Accountancy concepts to real-life situations. For Part 2 Chapter 04 Analysis of Financial Statements these questions are as per the latest competency-based education goals.
In the current CBSE pattern for Class 12 Accountancy, Part 2 Chapter 04 Analysis of Financial Statements Value Based or Case-Based questions typically carry 3 to 5 marks.
Yes, you can download Class 12 Accountancy Part 2 Chapter 04 Analysis of Financial Statements VBQs in a mobile-friendly PDF format for free.