

Class 7 Mathematics Practice Assignments: CBSE Class 7 Mathematics Data Handling Assignment Set 01
Review targeted academic assignments with the CBSE Class 7 Mathematics Data Handling Assignment Set 01. Built according to official CBSE standards for the 2026-27 term, these downloadable Class 7 Mathematics worksheets support effective daily practice for Chapter 03 Data Handling.
Download Chapter 03 Data Handling Assignment PDF with Solutions
View or download the dedicated CBSE Class 7 Mathematics Data Handling Assignment Set 01 resource below. Engaging with these assignments under focused study conditions ensures continuous academic progress and mastery of the 2026-27 curriculum.
1 What is the arithmetic mean of 1, 2, .... , 9 and 10?
(A) 5.5
(B) 6
(C) 7.5
(D) 10
Answer : A
2 In a data, 10 numbers are arranged in increasing order. If the 71h entry is increased by 4, by how much does the median increase?
(A) Zero
(B) 4
(C) 6
(D) 5
Answer : A
3 What is the mean of x, x + 3, x + 6, x + 9 and x + 12?
(A) X + 3
(B) X + 6
(C) X + 9
(D) X + 12
Answer : B
4 The daily sales of kerosene (in litres) in a ration shop for six days is given in the box.
75, 120, 12, 50, 70.5, 140.5
What is the average daily sale?
(A) 150 l
(B) 1 0 l
(C) 142 l
(D) 78l
Answer : D
5 The mean of five numbers is 27. If one of the numbers is excluded, the mean gets reduced by 2. What is the excluded number?
(A) 35
(B) 27
(C) 25
(D) 40
Answer : A
6 What is the median of the data 46, 64, 87, 41,58,77,35,90,55,33,92?
(A) 87
(B) 77
(C) 58
(D) 60.2
Answer : C
7 Which of the following is true about mean?
(A) It occurs most frequently.
(B) It d ivides observations into two equal parts.
(C) It is representative of the whole group.
(D) It is the sum of observations.
Answer : C
8 If each entry of a data is increased by 5,how does the mean change?
(A) Remains the same .
(B) Increases by 5.
(C) Decreases by 5.
(D) Becomes half.
Answer : B
9 The arithmetic mean of five given numbers is 85. What is their sum?
(A) 425
(B) 85
(C) A number between 85 and 425.
(D) A number greater than 500.
Answer : A
10 The average weight of a sample of 10 apples is 52 g. Later it was found that the weighing machine had shown the weight of each apple 10 g less. What is the correct average weight of an apple?
(A) 62 g
(B) 54 g
(C) 56 g
(D) 52 g
Answer : A
11 The mean of6,y, 7,xand 14 is 8.Which of the following is true?
(A) X + y = 13
(B) X - y = 13
(C) 2x + 3y = 13
(D) x2 + y2 = 15
Answer : A
12 Which of the following is correct about mode?
(A) It is central.
(B) It occurs most frequently.
(C) It lies between the maximum and minimum observations .
(D) It is the average of the two middle terms.
Answer : B
13 Rajani has a box with 6 marbles numbered from 1 to 6 on each of them.
She picks a marble from it without seeing. What is the probability that the marble picked has the number 3 on it?
(A) 1/6
(B) 2/3
(C) 3/4
(D) 1/4
Answer : A
(14-18): The heights of six mountains are 8200 m, 6000 m, 8600 m, 7500 m, 8800 m and 6500 m . Based on this information, answer the questions given.
14 What is the approximate average height of the mountains?
(A) 7657 m
(C) 7756 m
(B) 7600 m
(D) 7765 m
Answer : B
15 Find the median height of the mountains.
(A) 7850 m
(C) 8750 m
(B) 7580 m
(D) 5780 m
Answer : A
16 What is the mode of the heights?
(A) 6000
(B) 8800
(C) Does not exist
(D) 7 500
Answer : C
17 Which of the following statements is true?
(A) The mean height of the mountains is greater than their median height.
(B) The mean height of the mountains is less than their mode.
(C) The median height of the mountains is less than their mode.
(D) The median height of the mountains is greater than their mean height.
Answer : B
18 Rakesh and Sanjay planned to go trekking on any of these mountains.
They wrote the heights on chits of paper, shuffled them and picked one. What is the probability that the height picked is the maximum?
(A) 1/3
(B) 2/3
(C) 1/6
(D) 1/4
Answer : C
(19-21): The ages (in years) of some teachers of a school are given in the box.
26, 32, 38, 41, 26, 31, 35, 33, 26, 37 l
Based on this information, answer the following questions.
19 What is the range of the ages of the teachers?
(A) 15 years
(C) 41 years
(B) 26 years
(D) 32 years
Answer : A
20 What is the mean age of the teachers?
(A) 23.5 years
(B) 32.5 years
(C) 35 years
(D) 38 years
Answer : B
21 What is the mode of the given data?
(A) 32 years
(B) 41 years
(C) 26 years
(D) 31 years
Answer :C
(22-25): The heights of 10 students, measured in em are as follows:
143,132,150, 139,128,135, 151, 146, 141, 149
Based on this information, answer the following questions.
22 What is the height of the shortest girl?
(A) 128 em
(B) 141 em
(C) 151 em
(D) 150cm
Answer : A
23 What is the range of the data?
(A) 35 em
(B) 31 em
(C) 23 em
(D) 28 em
Answer : C
24 What is the mean height of the students?
(A) 141.4 em
(B) 141 em
(C) 142cm
(D) 151 em
Answer : A
25 The height of how many students is greater than the mean height?
(A) 4
(B) 3
(C) 5
(D) 2
Answer : C
26 In which of these situations is a double bar graph useful?
(i) Enrolment of students in class VII in 2009 and2010.
(ii) Marks obtained in Term I and Term II examinations.
(iii) Marks obtained in all subjects of a term examination.
(A) (i) and (ii)
(C) (iii) and (i)
(B) (ii) and (iii)
(D) (i) only
Answer : A
27 Which of these is certain to happen?
(A) You look younger today than yesterday.
(B) You look older today than yesterday.
(C) A tossed coin will land heads up.
(D) Tomorrow will be a cloudy day.
Answer : B
28 Which of these is impossible to happen ?
(A) A tossed coin lands with heads up.
(B) A tossed die lands up with 4 on top.
(C) The next traffic light is red.
(D) A die thrown lands up with 7 on top.
Answer : D
29 Which of these can happen but not certainly?
(A) A tossed coin lands with heads up.
(B) The sun rises in the east.
(C) A die thrown lands with 8 on the top.
(D) The Earth revolves around the Sun.
Answer : A
30 Which of these is impossible?
(A) The next traffic light seen is red.
(B) A tossed die lands up with 8 on top.
(C) A flipped coin lands up with head on top.
(D) It rains tommorow.
Answer : B
31 Find the range of the data.
128, 139, 148, 132, 152, 154,140,143,146,149,142
(A) 9
(B) 26
(C) 5
(D) 24
Answer : B
32 The table shows the number of hours Pavan studies on different days of a week.
Mon Tue Wed Thurs Fri Sat
3 4 2 5 4 3
How many hours per day does he study on an average?
(A) 3.5 hours
(C) 4 hours
(B) 3 hours
(D) 4.5 hours
Answer : A
(33-35): The bar graph shows the sales of fruits and vegetables in a store in 4 hours on a certain evening.
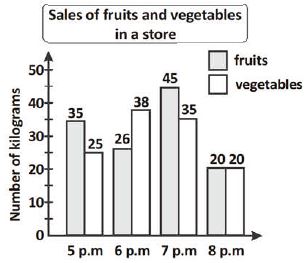
33 How many kilograms of fruits were sold during the four hours?
(A) 120 kg
(B) 124 kg
(C) 126 kg
(D) 144 kg
Answer : C
34 When was the sale of fruits lesser than that of vegetables?
(A) 7 p.m
(B) 6 p.m
(C) 8 p.m
(D) 5 p.m
Answer : B
35 During the four hours, which of the following is true about the sale of fruits and vegetables?
(A) The sale of vegetables was lesser than that of fruits.
(B) The sale of vegetables is 126 kg.
(C) The sale of fruits is 11 8 kg.
(D) The sale of vegetables is greater than that of fruits .
Answer : A
36 The number of chapatis needed for 30 students of a class are given in the box.
2, 1, 2, 3, 3, 2, 2, 2, 4, 4
3, 2, 3, 3, 2, 2, 2, 2, 3, 3
2, 3, 2, 2, 2, 3, 3, 3, 3, 4
Calculate the mode of the data.
(A) 3
(B) 2
(C) 1
(D) 4
Answer : B
Question 1. Define the terms-
a) data
b) frequency of an observation
c) mean of a data
d) median of a data
e) mode of a data
f) bar graph
g) double bar graph
Answer:
a) Data: A collection of numbers or information gathered to give some specific information.
b) Frequency of an observation: The number of times a particular observation occurs in a given data set.
c) Mean of a data: The average of a given set of numbers, calculated by dividing the sum of all observations by the total number of observations.
d) Median of a data: The middle value of a data set when the observations are arranged in ascending or descending order.
e) Mode of a data: The observation that occurs most frequently in a given data set.
f) Bar graph: A pictorial representation of numerical data using bars of uniform width, with heights proportional to the values they represent.
g) Double bar graph: A bar graph showing two sets of data simultaneously for comparison using two parallel bars of different colors or shades for each category.
In simple words: These are core statistical terms used to collect, organize, analyze, and visually represent information.
Exam Tip: Memorize exact definitions as they are frequently asked for 1 mark each in objective or short-answer sections.
Question 2. Prepare the frequency table for the following data:
5,2,1,3,4,4,5,6,2,2,4,5,5,6,2,2,4,5,5,1.
Answer:
Arranging the data in ascending order: 1, 1, 2, 2, 2, 2, 2, 3, 4, 4, 4, 4, 5, 5, 5, 5, 5, 5, 6, 6.
Counting the tally marks for each observation, we get the frequency table below:
| Number (Observation) | Tally Marks | Frequency |
|---|---|---|
| 1 | || | 2 |
| 2 | NN | 5 |
| 3 | | | 1 |
| 4 | |||| | 4 |
| 5 | NN | | 6 |
| 6 | || | 2 |
| Total | - | 20 |
In simple words: Count how many times each number appears and tally them up.
Exam Tip: Always verify that the sum of all frequencies equals the total number of items given in the raw data (here, total frequency = 20).
Question 3. Find the mean of first five natural numbers.
Answer:
First five natural numbers are 1, 2, 3, 4, and 5.
Sum of observations = 1 + 2 + 3 + 4 + 5 = 15
Total number of observations = 5
Mean = \(\frac{\text{Sum of observations}}{\text{Total number of observations}}\)
Mean = \(\frac{15}{5} = 3\)
In simple words: Add the first five counting numbers and divide by 5.
Exam Tip: Remember that natural numbers start from 1, whereas whole numbers start from 0.
Question 4. Find the mean of first five prime numbers.
Answer:
First five prime numbers are 2, 3, 5, 7, and 11.
Sum of observations = 2 + 3 + 5 + 7 + 11 = 28
Total number of observations = 5
Mean = \(\frac{28}{5} = 5.6\)
In simple words: Add the first five prime numbers and divide by 5.
Exam Tip: 1 is neither prime nor composite, so the first prime number is 2.
Question 5. The ages (in years) of 50 players of a school are given below:
Age (yr): 14, 15, 16, 17, 18
No. of players: 15, 14, 10, 8, 3
Find the mean age.
Answer:
Let age be \(x_i\) and number of players be frequency \(f_i\).
| Age (\(x_i\)) | No. of players (\(f_i\)) | \(f_i \times x_i\) |
|---|---|---|
| 14 | 15 | \(14 \times 15 = 210\) |
| 15 | 14 | \(15 \times 14 = 210\) |
| 16 | 10 | \(16 \sten \times 10 = 160\) |
| 17 | 8 | \(17 \times 8 = 136\) |
| 18 | 3 | \(18 \times 3 = 54\) |
| Total | \(\sum f_i = 50\) | \(\sum f_i x_i = 770\) |
Mean = \(\frac{\sum f_i x_i}{\sum f_i} = \frac{770}{50} = 15.4\) years.
In simple words: Multiply each age by its frequency, sum them up, and divide by the total number of players (50).
Exam Tip: Set up a table with columns for \(x_i\), \(f_i\), and \(f_i x_i\) to avoid calculation errors.
Question 6. The weights of 10 students (kg) are: 40, 52, 34, 47, 31, 35, 48, 41, 44, 38, 42.
Find the median weight.
Answer:
Arranging the 10 weights in ascending order:
31, 34, 35, 38, 40, 41, 42, 44, 47, 48, 52 (Wait, counting total terms given in question: 40,52,34,47,31,35,48,41,44,38,42 contains 11 values).
Let us list all 11 values: 31, 34, 35, 38, 40, 41, 42, 44, 47, 48, 52.
Total number of observations \(n = 11\) (which is odd).
Median = Value of the \(\left(\frac{n + 1}{2}\right)^{\text{th}}\) observation.
Median = Value of the \(\left(\frac{11 + 1}{2}\right)^{\text{th}} = 6^{\text{th}}\) observation.
6th observation in ascending order = 41 kg.
In simple words: Arrange numbers from smallest to largest and pick the exact middle number.
Exam Tip: Always arrange the data in ascending or descending order before finding the median; forgetting this is the most common student error.
Question 7. Calculate the median for the following data:
Marks: 17, 20, 22, 15, 30, 25
No. of students: 5, 9, 4, 3, 10, 6
Answer:
First, arrange the data in ascending order of marks and calculate the cumulative frequency (c.f.):
| Marks (\(x_i\)) | No. of Students (\(f_i\)) | Cumulative Frequency (c.f.) |
|---|---|---|
| 15 | 3 | 3 |
| 17 | 5 | 3 + 5 = 8 |
| 20 | 9 | 8 + 9 = 17 |
| 22 | 4 | 17 + 4 = 21 |
| 25 | 6 | 21 + 6 = 27 |
| 30 | 10 | 27 + 10 = 37 |
Total number of students \(N = 37\) (odd).
Median position = \(\frac{N + 1}{2} = \frac{37 + 1}{2} = 19^{\text{th}}\) observation.
Looking at the cumulative frequency table, the 19th observation falls in the cumulative frequency 21, which corresponds to the mark 22.
Median = 22 marks.
In simple words: Find cumulative frequencies and locate the middle student's score.
Exam Tip: When finding median from a frequency table, sort by the variable value (marks), not by frequency.
Question 8. Find the median of first 10 even numbers.
Answer:
First 10 even numbers are: 2, 4, 6, 8, 10, 12, 14, 16, 18, 20.
Here, number of observations \(n = 10\) (even).
Median = Mean of the \(\left(\frac{n}{2}\right)^{\text{th}}\) and \(\left(\frac{n}{2} + 1\right)^{\text{th}}\) observations.
Median = Mean of 5th and 6th observations.
5th observation = 10
6th observation = 12
Median = \(\frac{10 + 12}{2} = \frac{22}{2} = 11\)
In simple words: For an even count of numbers, average the two middle numbers.
Answer:
Arranging the data in ascending order: 28, 31, 32, 32, 32, 32, 34, 36, 38, 40, 41.
Frequency of each observation:
- 28 occurs 1 time
- 31 occurs 1 time
- 32 occurs 4 times
- 34 occurs 1 time
- 36 occurs 1 time
- 38 occurs 1 time
- 40 occurs 1 time
- 41 occurs 1 time
Since 32 has the maximum frequency (4 times), Mode = 32 years.
In simple words: The mode is the number that appears most often.
Exam Tip: A data set can have one mode, more than one mode, or no mode at all.
Question 10. Daily wages of 45 workers in a factory are given below:
Daily wages (in Rs.): 100, 125, 150, 175, 200
No. of workers: 6, 8, 9, 12, 10
Find the median, mean and mode.
Answer:
Let daily wage be \(x_i\) and number of workers be \(f_i\). Constructing the table with cumulative frequency (c.f.) and \(f_i x_i\):
| Wage (\(x_i\)) | Workers (\(f_i\)) | c.f. | \(f_i x_i\) |
|---|---|---|---|
| 100 | 6 | 6 | 600 |
| 125 | 8 | 14 | 1000 |
| 150 | 9 | 23 | 1350 |
| 175 | 12 | 35 | 2100 |
| 200 | 10 | 45 | 2000 |
| Total | \(\sum f_i = 45\) | - | \(\sum f_i x_i = 7050\) |
1. Mean:
Mean = \(\frac{\sum f_i x_i}{\sum f_i} = \frac{7050}{45} = \text{Rs. } 156.67\)
2. Median:
Total workers \(N = 45\) (odd).
Median position = \(\frac{45 + 1}{2} = 23^{\text{rd}}\) observation.
From the c.f. column, the 23rd observation is Rs. 150.
Median = Rs. 150
3. Mode:
The wage with the highest frequency (12 workers) is Rs. 175.
Mode = Rs. 175
In simple words: Calculate average, middle value, and most frequent value from the table.
Exam Tip: Double-check multiplication for \(f_i x_i\) to avoid silly arithmetic mistakes.
Question 11. The following table shows the weight of 12 players:
Weight in kg: 48, 50, 52, 54, 58
No. of players: 4, 3, 2, 2, 1
Find the median and mean weights.
Using empirical formula, calculate its mode. [Note: Empirical formula for calculating mode is Mode = 3 Median - 2 Mean]
Answer:
Let weight be \(x_i\) and players be \(f_i\). Constructing table:
| Weight (\(x_i\)) | Players (\(f_i\)) | c.f. | \(f_i x_i\) |
|---|---|---|---|
| 48 | 4 | 4 | 192 |
| 50 | 3 | 7 | 150 |
| 52 | 2 | 9 | 104 |
| 54 | 2 | 11 | 108 |
| 58 | 1 | 12 | 58 |
| Total | \(\sum f_i = 12\) | - | \(\sum f_i x_i = 612\) |
1. Mean weight:
Mean = \(\frac{\sum f_i x_i}{\sum f_i} = \frac{612}{12} = 51\) kg.
2. Median weight:
Total players \(N = 12\) (even).
Median = Mean of 6th and 7th observations.
From c.f., both 6th and 7th observations fall under weight 50 kg.
Median = 50 kg.
3. Mode using empirical formula:
Mode = \(3(\text{Median}) - 2(\text{Mean})\)
Mode = \(3(50) - 2(51)\)
Mode = \(150 - 102 = 48\) kg.
In simple words: Find mean and median normally, then use the given formula to find the mode.
Exam Tip: Memorize the empirical relationship: Mode = 3 Median - 2 Mean.
Question 12. The following table shows the no. of scooters produced by a company during 6 consecutive years. Draw a bar graph to represent.
Year: 2001, 2002, 2003, 2004, 2005, 2006
No. of scooters: 11000, 14000, 12500, 17500, 15000, 24000
Answer:
Steps of Construction:
1. Draw a horizontal X-axis representing the Years and a vertical Y-axis representing the Number of Scooters.
2. Choose a suitable scale on the Y-axis: 1 unit = 2000 scooters (or 1 cm = 5000 scooters).
3. Draw bars of equal width for each year with heights proportional to the number of scooters produced.
4. Leave uniform spacing between consecutive bars.
In simple words: Draw bars representing scooter production against each year with equal spacing.
Exam Tip: Always write the scale clearly at the corner of your graph.
Question 13. A coin is tossed 100 times and head is obtained 59 times. On tossing a coin at random, find the probability of getting:
a) A head.
b) A tail.
Answer:
Total number of trials = 100
a) Number of times head is obtained = 59
Probability of getting a head = \(\frac{59}{100} = 0.59\)
b) Number of times tail is obtained = \(100 - 59 = 41\)
Probability of getting a tail = \(\frac{41}{100} = 0.41\)
In simple words: Probability is favorable outcomes divided by total outcomes.
Exam Tip: The sum of probabilities of all possible outcomes of an event is always equal to 1.
Question 14. A dice is thrown 200 times and the outcomes are noted as shown below:
Outcome: 1, 2, 3, 4, 5, 6
Frequency: 21, 30, 42, 38, 29, 40
When a dice is thrown at random, find the probability of getting:
a) 5
b) 3
c) 4
d) 6.
Answer:
Total number of throws = 200
a) Frequency of 5 = 29
Probability of getting 5 = \(\frac{29}{200} = 0.145\)
b) Frequency of 3 = 42
Probability of getting 3 = \(\frac{42}{200} = \frac{21}{100} = 0.21\)
c) Frequency of 4 = 38
Probability of getting 4 = \(\frac{38}{200} = \frac{19}{100} = 0.19\)
d) Frequency of 6 = 40
Probability of getting 6 = \(\frac{40}{200} = \frac{1}{5} = 0.2\)
In simple words: Divide the frequency of each outcome by the total number of throws (200).
Answer:
Total number of bags = 5
Data of germinated seeds: 40, 48, 42, 39, 41.
a) Bags with more than 40 seeds: 48, 42, 41 (3 bags)
Probability = \(\frac{3}{5} = 0.6\)
b) Bags with 49 seeds: None (0 bags)
Probability = \(\frac{0}{5} = 0\)
c) Bags with more than 35 seeds: All 5 bags (40, 48, 42, 39, 41 are all > 35)
Probability = \(\frac{5}{5} = 1\)
d) Bags with at least 40 seeds (40 or more): 40, 48, 42, 41 (4 bags)
Probability = \(\frac{4}{5} = 0.8\)
e) Bags with at most 40 seeds (40 or less): 40, 39 (2 bags)
Probability = \(\frac{2}{5} = 0.4\)
In simple words: Count how many bags satisfy the condition and divide by 5.
Exam Tip: "At least" means greater than or equal to, while "at most" means less than or equal to.
Question 16. The distance covered by 10 athletes in 1 minute in a sprint race of 400 m is:
299, 248, 315, 320, 286, 370, 388, 379, 295, 300.
a) What is the maximum distance covered in 1 minute?
b) What is the minimum distance covered in 1 minute?
c) What is the range of the data?
d) What is the mean of the data?
e) How many athletes have covered distance more than the mean distance?
Answer:
Arranging the distances in ascending order:
248, 286, 295, 299, 300, 315, 320, 370, 379, 388.
a) Maximum distance = 388 m.
b) Minimum distance = 248 m.
c) Range = Maximum value - Minimum value = \(388 - 248 = 140\) m.
d) Sum of distances = 248 + 286 + 295 + 299 + 300 + 315 + 320 + 370 + 379 + 388 = 3200 m.
Mean = \(\frac{3200}{10} = 320\) m.
e) Distances greater than mean (320 m): 370, 379, 388 (3 athletes).
In simple words: Find highest, lowest, range, average, and count how many scored above average.
Exam Tip: Range is always Highest minus Lowest.
Question 17. The following table show the no. of boys and girls who have participated in various events conducted by a Rotary club of a city. Draw a double bar graph to represent the given data using an appropriate scale:
Event: Dance, Drama, Sports, Rangoli, Singing
Boys: 400, 480, 670, 220, 710
Girls: 580, 330, 590, 610, 720
Answer:
Steps of Construction:
1. Draw X-axis for Events and Y-axis for Number of Participants.
2. Choose a scale on Y-axis: 1 unit = 100 participants.
3. For each event, draw two adjacent bars—one for Boys and one for Girls—using different colors or shading.
4. Include a legend to distinguish between Boys and Girls.
In simple words: Create paired bars for boys and girls across all five events.
Exam Tip: Always include a legend indicating which color represents which category.
Question 18. Given below is the marks (M.M-100) obtained by Samaira (class VII) in First and Second Terminal Exam 2014. Represent it using a double bar graph.
Subject: English, Hindi, Maths, Science, So. Science, Sanskrit
1st term: 92, 93, 98, 91, 99, 100
2nd term: 98, 97, 100, 100, 99, 100
Answer:
Steps of Construction:
1. Draw X-axis for Subjects and Y-axis for Marks (0 to 100).
2. Choose a scale on Y-axis: 1 unit = 10 marks.
3. For each subject, draw two adjacent bars representing 1st Term and 2nd Term marks.
4. Include a clear legend.
In simple words: Compare Samaira's term 1 and term 2 marks using two side-by-side bars for each subject.
Exam Tip: Ensure all bar heights are accurately calculated according to the scale.
Free study material for Mathematics
Download Practice Assignments: Class 7 Mathematics Chapter 03 Data Handling
Revision Assignment: Chapter 03 Data Handling (CBSE)
Review targeted chapter assignments for Class 7 Mathematics Chapter 03 Data Handling. Built according to official CBSE guidelines, these downloadable problem sets help students build accuracy and prepare effectively for school tests.
Maximize Exam Scores with Chapter Practice Sets
- Exam Alignment: Questions strictly follow contemporary CBSE sample papers and grading schemes.
- Comprehensive Coverage: Features objective drills, case studies, and structured descriptive problems for Chapter 03 Data Handling.
- Pacing & Precision: Regular problem-solving builds critical calculation speed and test-taking accuracy.
How to Approach Mathematics Chapter 03 Data Handling Assignments
- Textbook Review: Always study the core NCERT book for Class 7 Mathematics prior to beginning the assignment.
- Independent Attempt: Solve Chapter 03 Data Handling questions on your own initially before cross-checking with expert solutions.
- Error Tracking: Record challenging concepts in a dedicated notebook and practice online MCQ tests for revision.
FAQs
You can download free PDF assignments for Class 7 Mathematics Chapter 03 Data Handling from StudiesToday.com. These practice sheets have been updated for the 2026-27 session covering all concepts from latest NCERT textbook.
Yes, our teachers have given solutions for all questions in the Class 7 Mathematics Chapter 03 Data Handling assignments. This will help you to understand step-by-step methodology to get full marks in school tests and exams.
Yes. These assignments are designed as per the latest CBSE syllabus for 2026. We have included huge variety of question formats such as MCQs, Case-study based questions and important diagram-based problems found in Chapter 03 Data Handling.
Practicing topicw wise assignments will help Class 7 students understand every sub-topic of Chapter 03 Data Handling. Daily practice will improve speed, accuracy and answering competency-based questions.
Yes, all printable assignments for Class 7 Mathematics Chapter 03 Data Handling are available for free download in mobile-friendly PDF format.