

Official CBSE Study Materials for Class 9 Social Science
Explore structured advanced study materials through the Class 9 Social Science Poverty As Challege Exam Notes. Tailored for Class 9 learners, utilizing these Social Science resources ensures thorough preparation and strengthens foundational knowledge before final CBSE evaluations.
Advanced Resources for Social Science
View or download the dedicated Class 9 Social Science Poverty As Challege Exam Notes resource below. Engaging with these advanced study guides under focused conditions ensures continuous academic progress and mastery of the 2026-27 curriculum for Chapter 03 Poverty as a Challenge.
This CBSE Class 9 Social Science exam notes page on Poverty as a Challenge explains the meaning of poverty, relative and absolute poverty, the two methods of measuring poverty, vulnerable groups, inter-state disparities, global poverty trends, causes of poverty, government measures and poverty alleviation programmes, with a glossary, exercise questions and the answer key for the MCQs.
PROBLEM OF POVERTY
Poverty: It is the situation in which a person is unable to get the minimum basic necessities of life, that is, food, clothing and shelter, for his or her sustenance.
Mass Poverty: When a large section of people in an economy are deprived of these basic necessities, that economy is said to be in mass poverty.
Poverty is used in two ways:
1. Relative poverty
2. Absolute poverty
1. Relative poverty: Under relative poverty, the economic condition of different regions or countries is compared.
Two indicators of relative poverty are:
1. Per capita income
2. National income
According to a report submitted by the UNO, those countries are treated as poor whose per capita income is less than US dollars 725 per annum.
2. Absolute poverty: It refers to the measure of poverty keeping in view the per capita intake of calories and the minimum level of consumption.
Per Capita Income = National Income / Population
National Income: It is the total value of goods and services produced within the country plus net income from abroad.
MEASUREMENT OF POVERTY
There are two approaches by which the number of poor is estimated:
(1) Expenditure Method
(2) Income Method
1. Expenditure Method:
(A) Under the expenditure method, first of all the minimum nutritional food requirement for survival is estimated.
(B) The food value is converted to calories.
(C) The caloric value of food is then converted to money value, that is, rupees.
(D) A minimum amount of money required for purchasing cloth and other necessities is added to the money value of food.
(E) The total equivalent amount is considered as the poverty line.
(F) All those families which spent less than the poverty line are counted as poor families.
2. Income Method: A person is considered poor if his or her income or consumption level falls below the minimum level necessary to fulfil basic needs. Each country uses an imaginary line that is considered appropriate for its existing level of development and its accepted minimum social norms.
(A) This method is used by the government while distributing food through the Public Distribution System at the local level.
(B) Under this method, a poverty line is fixed by the government. For example, for the year 1999-2000 it was fixed at Rs. 328 per capita per month for rural areas and Rs. 454 per capita per month for urban areas.
(C) All the families whose total income in a month is less than the poverty line fixed by the government are considered Below Poverty Line (BPL).
Poverty Line: It is the line which indicates the level of purchasing power required to satisfy the minimum needs of a person. In other words, it represents the capacity to satisfy the minimum level of human needs.
The line divides the population into two groups. Those who have this purchasing power or more are known as Above Poverty Line (APL), and those who do not have this much purchasing power are known as Below Poverty Line (BPL).
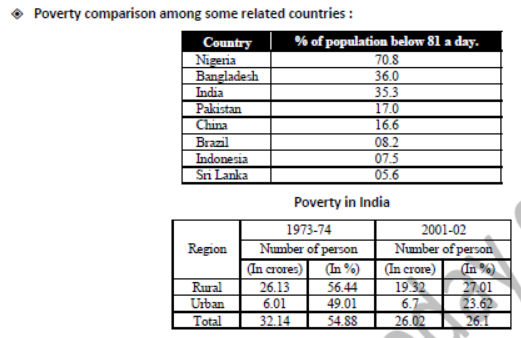
The number of persons living below the poverty line in 2001-02 was 26.02 crore. Among them, 19.32 crore lived in rural areas and 6.7 crore in urban areas. In 1973-74 about 55 per cent of India's population was living below the poverty line. By 1999-2000, this had come down to 26 per cent. This means only about a quarter of the population in India is now living below the poverty line.
VULNERABLE GROUPS
Vulnerability: Vulnerability to poverty is a measure which describes the greater probability of certain communities (say, members of a backward caste) or individuals (such as a widow or a physically handicapped person) of becoming, or remaining, poor in the coming years. Vulnerability is determined by the options available to different communities for finding an alternative living in terms of assets, education, health and job opportunities. It is also analysed on the basis of the greater risks these groups face at the time of natural disasters (earthquakes, tsunami) and terrorism.

Who are vulnerable: Poverty and occupation are closely related. Most of the poor people are agricultural and casual labourers, tribals, and the disabled or physically challenged. According to the estimates of the Planning Commission, agricultural labour households constitute 25 per cent of the total labour households, and of these 57.60 per cent live below the poverty line. In states where agricultural labourers form a great share, poverty is also higher.
In the case of the urban poor, poverty occurs primarily due to the outflow of the rural poor into urban areas. Casual workers, unemployed daily wage earners, domestic servants, rickshaw pullers, and hotel and restaurant workers fall in the category of the urban poor.
INTER-STATE DISPARITIES
Poverty in some states of India, 1999-2000
| High poverty states | Number of people below poverty line (in lakh) | Percent of people below poverty line | Low poverty states | Number of people below poverty line (in lakh) | Percent of people below poverty line |
|---|---|---|---|---|---|
| Bihar | 425.64 | 42.60 | Goa | 0.70 | 4.40 |
| Madhya Pradesh | 298.54 | 37.43 | Gujarat | 67.89 | 14.07 |
| Maharashtra | 227.99 | 25.03 | Haryana | 17.34 | 8.74 |
| Orissa | 169.09 | 47.15 | Himachal Pradesh | 5.12 | 7.63 |
| Tamil Nadu | 130.48 | 21.12 | Jammu & Kashmir | 3.46 | 3.48 |
| Uttar Pradesh | 529.89 | 31.15 | Kerala | 41.04 | 12.72 |
| West Bengal | 213.49 | 27.02 | Punjab | 14.49 | 6.16 |
Poverty in India also has another aspect or dimension. The proportion of poor people is not the same in every state. Recent estimates show that in 20 states and union territories, the poverty ratio is less than the national average. On the other hand, poverty is still a serious problem in Orissa, Bihar, Assam, Tripura and Uttar Pradesh. Orissa and Bihar continue to be the two poorest states, with poverty ratios of 47 and 43 per cent respectively.
Along with rural poverty, urban poverty is also high in Orissa, Madhya Pradesh, Bihar and Uttar Pradesh. States like Punjab and Haryana have traditionally succeeded in reducing poverty with the help of high agricultural growth rates. Kerala has focused more on human resource development. In West Bengal, land reform measures have helped in reducing poverty. In Andhra Pradesh and Tamil Nadu, public distribution of food grains could have been responsible for the improvement.
GLOBAL POVERTY SCENARIO
The proportion of people in developing countries living in extreme economic poverty, defined by the World Bank as living on less than US dollar 1 per day, has fallen from 28 per cent in 1990 to 21 per cent in 2001.
Although there has been a substantial reduction in global poverty, it is marked by great regional differences. Poverty declined substantially in China and Southeast Asian countries as a result of rapid economic growth and massive investments in human resource development. In Sub-Saharan Africa, poverty in fact rose from 41 per cent in 1981 to 46 per cent in 2001. In Latin America, the ratio of poverty remained the same.
Poverty comparison among some related countries:
| Country | % of population below US dollar 1 a day |
|---|---|
| Nigeria | 70.8 |
| Bangladesh | 36.0 |
| India | 35.3 |
| Pakistan | 17.0 |
| China | 16.6 |
| Brazil | 08.2 |
| Indonesia | 07.5 |
| Sri Lanka | 05.6 |
Poverty in India
| Region | 1973-74 Number of persons (In crores) | 1973-74 Number of persons (In %) | 2001-02 Number of persons (In crore) | 2001-02 Number of persons (In %) |
|---|---|---|---|---|
| Rural | 26.13 | 56.44 | 19.32 | 27.01 |
| Urban | 6.01 | 49.01 | 6.7 | 23.62 |
| Total | 32.14 | 54.88 | 26.02 | 26.1 |
CAUSES OF POVERTY
1. British Rule: The British ruled India for more than 100 years. Prior to British rule, traditional industries, for instance textiles, were flourishing in India. During the British rule, they adopted policies to discourage such industries. This left millions of weavers poor.
2. Rural Economy: In India, 70 per cent of the total population is engaged in agriculture, but its contribution to the national income is low. India is predominantly an agricultural country, yet it is very much backward in agriculture.
3. Heavy Pressure of Population: Population in India has been increasing very rapidly. The main factor accounting for it is a sharp fall in the death rate with a stable birth rate for the last many decades. This pressure of population serves as a big stumbling block to economic development. In spite of an increase in total production, per capita income is very low.
4. Chronic Unemployment and Under-employment: Due to increasing pressure on land, per hectare availability of land is decreasing. Due to the division of land, production is decreasing. The agricultural sector is also facing the problem of disguised unemployment.
5. Lack of Proper Industrialisation: India is very backward from the industrial point of view. Hardly 3 per cent of the working population is engaged in large scale industries. No doubt, consumer goods industries have developed to a large scale, but capital and producer goods industries have not yet developed properly. We still have to depend on foreign countries for these industries.
6. Social Factors: Social factors like illiteracy, large size of family, law of inheritance and caste system are also responsible for the prevalence of poverty.
REMOVAL OF POVERTY
The following are some of the measures undertaken by the government for alleviation of poverty.
1. Trickle Down Effect:
(A) Under this, the government laid stress on the development of agriculture and industries.
(B) It was assumed that development of industry and agriculture would create employment opportunities and incomes, which would lead to rapid economic development.
(C) It was assumed that the benefits would reach particular sections across the country, particularly the poorer ones. This is also known as the trickle down effect.
2. Land Reforms: Due to the economic policies of the British, there was a huge gap between the income of the rich and the poor. Wealth and other resources like land were concentrated in the hands of a few. To reduce the gap, the government introduced the following land reforms:
1. Abolition of Zamindari system
2. Land ceiling
3. Fixation of rents
3. Promotion of Cottage and Small Scale Industries: Cottage and small scale industries, which employ more labourers and less machinery, are encouraged. The government has reserved some products solely for these industries.
4. Income Redistribution Measures: To reduce the gap between the poor and the rich, the government made an attempt through income redistribution measures. This is done by taxing:
(A) The rich and the middle class
(B) The commodities of luxury consumption
(C) Subsidising the provision of essential goods to lower income groups
POVERTY ALLEVIATION PROGRAMMES
1. Swarna Jayanti Gram Swarojgar Yojana (SJGSY) (launched in 1999). Main objectives:
(A) Help the existing poor families to come above the poverty line.
(B) Families below the poverty line are provided with financial assistance.
(C) This is a centrally sponsored scheme.
2. Sampoorna Gramin Rojgar Yojana (SGRY) (launched on 1-09-2001). Main objectives:
1. To provide opportunities to surplus labour.
2. To provide security of fertilisers and manures.
3. Development of the basic infrastructure.
4. Development of the regional economic and social conditions.
3. Prime Minister Rozgar Yojana (PMRY): PMRY started in 1993 with the objective of providing self-employment opportunities to the educated unemployed youth and to set up village industries.
4. Swarnajayanti Shahari Rozgar Yojana: This was started in 1997. The main objectives are:
1. To alleviate poverty in urban areas.
2. To provide self-employment to the educated unemployed in urban areas.
5. Pradhan Mantri Gramodaya Yojana (PMGY) (launched in 2000-01). Objectives: to provide basic services such as primary health, primary education, rural shelter and rural drinking water.
GLOSSARY
1. Poverty: A state in which people do not have sufficient income to fulfil the basic necessities of life like food, clothing and shelter.
2. Absolute Poverty: It refers to the total number of people living below the poverty line.
3. Relative Poverty: It refers to the poverty of people in relation to other people, regions or nations.
4. Poverty Line: The level of income which divides the population into poor and non-poor. It is drawn on the basis of minimum consumption expenditure.
5. International Poverty Line: It is defined by the World Bank as an income of less than US dollar 1 per day.
6. Social Exclusion: The state of living in very poor condition and being excluded from facilities, benefits and opportunities that others enjoy.
7. Vulnerability: It describes the level of poverty when people have a greater probability of being adversely affected than other people at the time of natural disasters.
8. Economic Growth: The term which defines an increase in the real output of a country.
9. Mass Poverty: A situation in which a large section of people in an economy are deprived of the basic necessities.
EXERCISE
A. VERY SHORT ANSWER TYPE QUESTIONS
Q.1 What is poverty?
Q.2 How does rapid growth of population be responsible for poverty?
Q.3 Mention two methods of estimate poverty?
Q.4 Mention any two steps which have been taken by the government to alleviate poverty.
Q.5 What is poverty line?
Q.6 Mention any two objectives of the Prime Minister Rozgar Yojana.
Q.7 Mention any two poverty alleviation programmes.
Q.8 Name any four poverty ridden states.
Q.9 Mention any two land reforms introduced by the government.
Q.10 What is mass poverty?
Q.11 Mention the major indicators of poverty.
Q.12 How is poverty line estimated periodically?
Q.13 Why is calorie requirement higher in rural areas than in urban areas?
Q.14 Despite less calorie requirement, urban areas have a higher poverty line. Why?
Q.15 Which groups are the most vulnerable in India?
Q.16 Who are the urban poor?
Q.17 Why does the poverty line vary with time and place?
Q.18 Is it possible to achieve better success in poverty reduction? How?
Q.19 What do you mean by poverty alleviation programme?
Q.20 Who is the poorest of the poor?
B. SHORT ANSWER TYPE QUESTIONS
Q.1 Explain briefly how the poverty line is estimated in India?
Q.2 Describe the poverty trends in India since 1973.
Q.3 Discuss briefly the global poverty trends as studied by the World Bank.
Q.4 Give a brief account of inter-state disparities in poverty in India.
Q.5 Give a brief account of inter-state disparities in poverty in India.
Q.6 What are the main features of the National Rural Employment Guarantee Act 2005?
Q.7 How does economic growth lead to poverty reduction?
Q.8 Discuss the major dimensions of poverty.
Q.9 The result of poverty alleviation programmes have been mixed. Give any four reasons.
Q.10 Explain poverty as seen by the social scientists.
Q.11 Mention any four social factors responsible for poverty.
Q.12 Give the poverty trends in India since 1973.
C. LONG ANSWER TYPE QUESTIONS
Q.1 Explain the major causes of poverty
Q.2 Explain the steps taken by government for the removal of poverty
Q.3 Describe measurement of poverty.
Q.4 Suggest some measures to remove poverty in India.
D. MULTIPLE CHOICE QUESTIONS
Q.1 What is the number of persons living below poverty line in 2001-02?
(A) 26.02 crore (B) 20.52 crore
(C) 22.67 crore (D) 24.52 crore
Q.2 Which region has high percentage of people living below poverty line?
(A) Rural (B) Urban
(C) Hilly (D) All the above
Q.3 What is accepted average calorie requirement in rural areas in India?
(A) 2000 cal (B) 2600 cal
(C) 2400 cal (D) 3000 cal
Q.4 What is accepted average calorie requirement in urban areas in India?
(A) 1500 cal (B) 2100 cal
(C) 2400 cal (D) 2700 cal
Q.5 What is the poverty line for the rural areas in India at present?
(A) Rs. 400 per month (B) Rs. 350 per month
(C) Rs. 328 per month (D) Rs. 375 per month
Q.6 What is the poverty line for the urban areas in India at present?
(A) Rs 454 per month (B) Rs. 300 per month
(C) Rs. 600 per month (D) Rs. 550 per month
Q.7 Swarna Jayanti Gram Swarojgar Yojana was launched in?
(A) 1997 (B) 1998
(C) 1996 (D) 1999
Q.8 Prime Minister's Rozgar Yojana was started in?
(A) 1990 (B) 1991
(C) 1992 (D) 1993
Q.9 Which is the poorest state in India?
(A) Bihar (B) Orissa
(C) Rajasthan (D) Gujarat
Q.10 The population of India in 2000-01 was?
(A) 100 crore (B) 98 crore
(C) 102 crore (D) 105 crore
Q.11 Contribution of agriculture in Indian economy is?
(A) 25 % (B) 30 %
(C) 35 % (D) 50 %
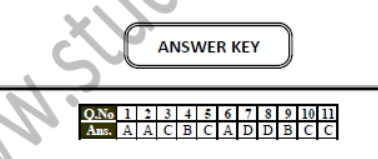
ANSWER KEY
Q.No: 1 2 3 4 5 6 7 8 9 10 11
Ans.: A A C B C A D D B C C
Free study material for Social Science
Social Science Class 9 Exam Resources: Chapter 03 Poverty as a Challenge
Quick Revision Material for Chapter 03 Poverty as a Challenge
Review targeted study resources for Chapter 03 Poverty as a Challenge tailored for Class 9 learners. Utilizing these structured notes and quick-revision tools ensures complete alignment with current CBSE evaluation standards.
Expert Notes and Solved Exam Questions
Designed around the official curriculum, these study guides guarantee standard compliance. Reviewing step-by-step solutions clarifies complex sub-topics within Chapter 03 Poverty as a Challenge and demystifies standard marking schemes for Social Science evaluations.
Additional Study Resources for Class 9
For peak performance in upcoming evaluations, integrate official Social Science sample papers directly into your study schedule. Follow up your revision by attempting online MCQ tests for Chapter 03 Poverty as a Challenge to refine calculation speed and precision.
FAQs
Our advanced study package for Chapter 03 Poverty as a Challenge includes detailed concepts, diagrams, Mind Maps, and explanation of complex topics to ensure Class 9 students learn as per syllabus for 2026 exams.
The Mind Maps provided for Chapter 03 Poverty as a Challenge act as visual anchors which will help faster recall during high-pressure exams.
Yes, teachers use our Class 9 Social Science resources for lesson planning as they are in simple language and have lot of solved examples.
Yes, You can download the complete, mobile-friendly PDF of the Social Science Chapter 03 Poverty as a Challenge advanced resources for free.
Yes, our subject matter experts have updated the Chapter 03 Poverty as a Challenge material to align with the rationalized NCERT textbooks and have removed deleted topics and added new competency-based questions.