Exercise 23.1
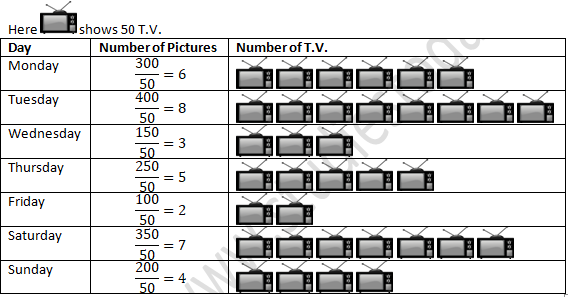
Question 1: The following table shows the daily production of T.V. sets in an industry for 7 days of a week.
Represent the above information by a pictograph.
Solution:
The following pictograph can be used to display the given information:
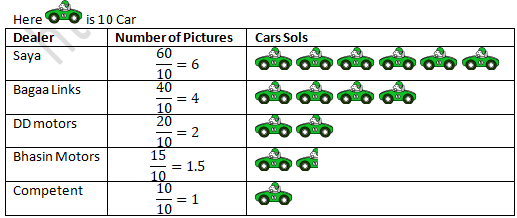
Question 2: The following table shows the number of Maruti cars sold by five dealers in a particular month:

Represent the above information by a pictograph.
Solution:
The following pictograph can be used to display the given information:
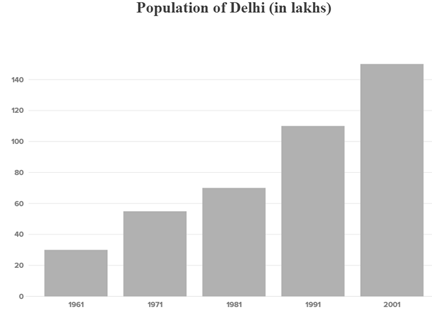
Question 3: The population of Delhi State in different census years is as given below:
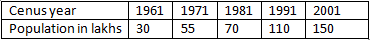
Represent the above information with the help of a bar graph.
Solution:
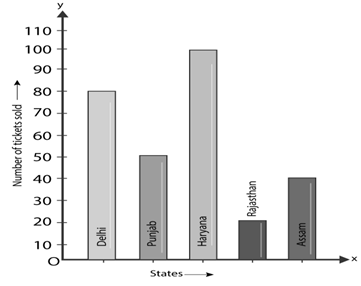
Question 4: Read the bar graph shown below and answer the following questions:
(i) What is the information given by the bar graph?
(ii) How many tickets of Assam State Lottery were sold by the agent?
(iii) Of which state, were the maximum number of tickets sold?
(iv) State whether true or false.
The maximum number of tickets sold is three times the minimum number of tickets sold.
(v) Of which state were the minimum numbers of tickets sold?
Solution:
(i) The Bar graph shows the number lottery tickets sold by an agent on a day of different state.
(ii) 40 Lottery tickets were sold by the agent in Assam state.
(iii) In Haryana maximum numbers of tickets were sold are 100.
(iv) The given statement is false.
Reason:- Maximum tickets were sold is 100 in Haryana.
Minimum tickets were sold is 20 in Rajasthan.
The number 100 is equivalent to 5 times the number 20.
(v) In Rajasthan minimum numbers of tickets were sold are 20.
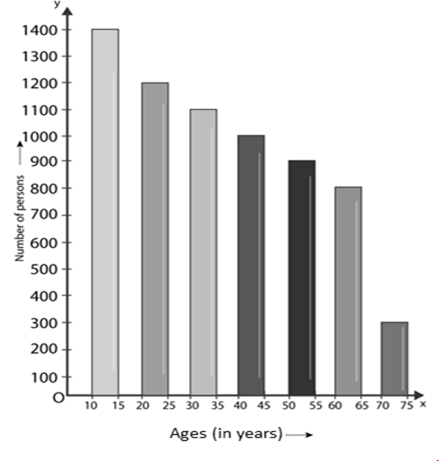
Question 5: Study the bar graph representing the number of persons in various age groups in a town shown in figure. Observe the bar graph and answer the following questions:
(i) What is the percentage of the youngest age-group persons over those in the oldest age group?
(ii) What is the total population of the town?
(iii) What is the number of persons in the age-group 60-65?
(iv) How many persons are more in the age-group 10-15 than in the age group 30-35?
(v) What is the age-group of exactly 1200 persons living in the town?
(vi) What is the total number of persons living in the town in the age-group 50-55?
(vii) What is the total number of persons living in the town in the age-groups 10-15 and 60-65?
(vii) Whether the population in general increases, decreases or remains constant with the increase in the age-group.
Solution:
(i) 10-15 years are youngest age-group. The number of persons of this group is 1400.
70 – 75 years are oldest age-group. The number of persons of this group is 300
1400/300 × 100 = 1400/3 = 466.67
(ii) Total Population of the town is :-
300 + 800 + 900 + 1000 + 1100 + 1200 + 1400 = 6700
(iii) 800 persons are belonging to group 60 – 65.
(iv) 1400 persons are belonging to group 10 – 15.
1100 persons are belonging to group 30-35.
Difference 1400 -1100 = 300
Hence, the 300 more persons in the age group 10 – 15 than the group 30-35.
(v) 1200 persons living in the town belonging to age group 20 – 25.
(vi) 900 persons living in the town belonging to age-group 50 – 55.
(vii) 1400 persons are belonging to group 10 – 15.
800 persons are belonging to group 60-65.
1400 + 800 = 2200.
Hence, the total number of persons living in the town belonging to age-groups 10 -15 and 60 – 65 is 2200.
(viii) We've seen that as the age group becomes older, the height of the bars declines. As a result, as the age demographic becomes older, the population shrinks.
Exercise 23.2
Question 1: Explain the reading and interpretation of bar graphs.
Solution:
A bar graph is made up of a series of horizontal or vertical bar lines or rectangles. Horizontal or vertical bar lines are possible. The understanding of a bar graph refers to how quickly we can gather information and draw different conclusions from a given bar graph.
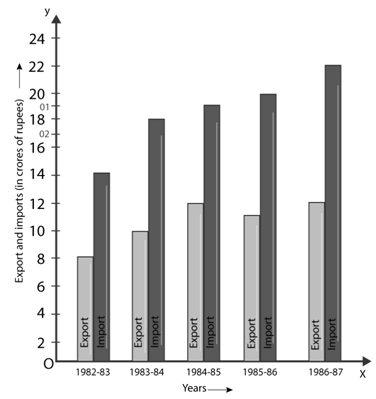
Question 2: Read the following bar graph and answer the following questions:
(i) What information is given by the bar graph?
(ii) In which year the export is minimum?
(iii) In which year the import is maximum?
(iv) In which year the difference of the values of export and import is maximum?
Solution:
(i) From 1982-83 to 1986-87, the bar graph depicts the import and export (in 100 crores of rupees).
(ii) The export is minimum in 1982-83.
(iii) The import is maximum in 1986-87.
(iv) The difference of the values of export and import is maximum in 1986-87.
Question 3: The following bar graph shows the results of an annual examination in a secondary school. Read the bar graph given below, and choose the correct alternative in each of the following:
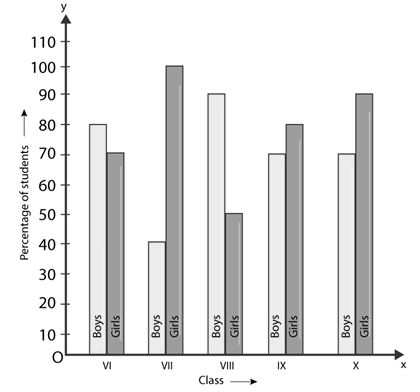
(i)The pair of classes in which the results of boys and girls are inversely proportional are:
(a) VI, VIII (b) VI, IX (c) VII, IX (d) VIII, X
(ii) The class having the lowest failure rate of girls is:
(a) VI (b) X (c) IX (d) VIII
(iii) The class having the lowest pass rate of students is:
(a) VI (b) VII (c) VIII (d) IX
Solution:
(i) (b)
(ii) (a)
(iii) (b)
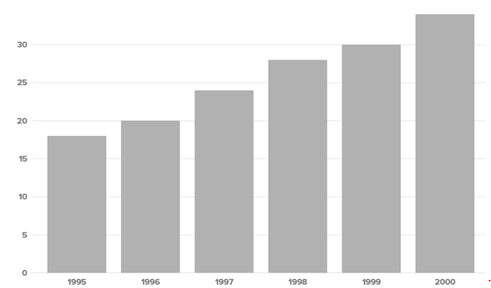
Question 4: The following data gives the number (in thousands) of applicants registered with an Employment Exchange during 1995-2000:
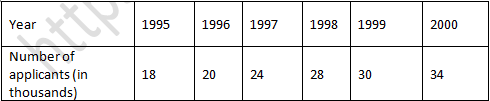
Construct a bar graph to represent the above data.
Solution:
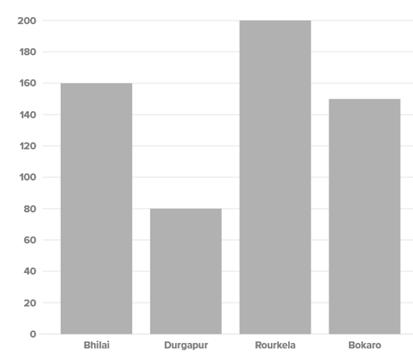
Question 5: The production of saleable steel in some of the steel plants of our country during 1999 is given below:

Construct a bar graph to represent the above data on a graph paper by using the scale 1 big divisions = 20 thousand tonnes.
Solution:
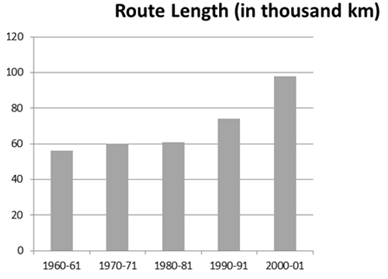
Question 6: The following table gives the route length (in thousand kilometres) of the Indian Railways in some of the years:
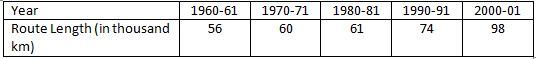
Represent the above data with the help of a bar graph.
Solution:
Exercise 23.3
Question 1: Construct a histogram for the following data:

Solution:
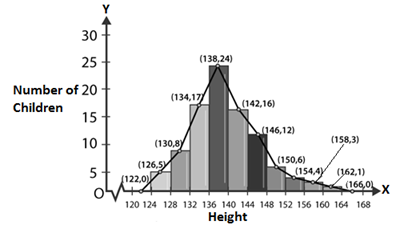
Question 2: The distribution of heights (in cm) of 96 children is given below. Construct a histogram and a frequency polygon on the same axes.
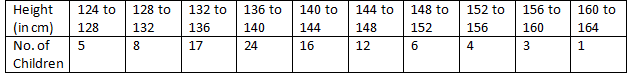
Solution:
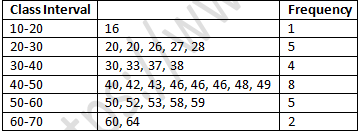
Question 3: The time taken, in seconds, to solve a problem by each of 25 pupils is as follows:
16, 20, 26, 27, 28, 30, 33, 37, 38, 40, 42, 43, 46, 46, 46, 48, 49, 50, 53, 58, 59, 60, 64, 52, 20
(a) Construct a frequency distribution for these data, using a class interval of 10 seconds.
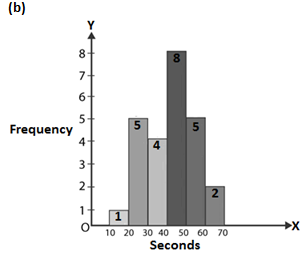
(b) Draw a histogram to represent the frequency distribution.
Solution:
(a) Frequency distribution for the given data, using a class interval of 10 seconds.
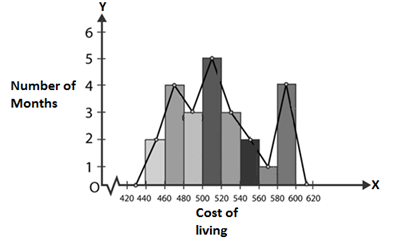
Question 4: Draw, in the same diagram, a histogram and a frequency polygon to represent the following data which shows the monthly cost of living index of a city in a period of 2 years:
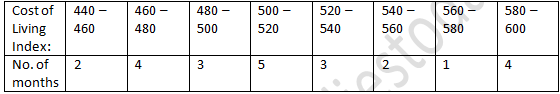
Solution: