Exercise 22.1
Question 1: What do you understand by the word “statistics” in:
(i) Singular form (ii) plural form?
Solution:
The term statistics is used in both its singular and plural forms.
(i) In singular sense, statistics can be characterised as science of processing, presentation, analysis and evaluation of numerical data.
(ii) Numbers in the plural refers to analytical data or measurements gathered for a specific purpose.
The word statistics is used in both its singular and plural senses.
Question 2: Describe some fundamental characteristics of statistics.
Solution:
The following are some of the most important characteristics:
(1) Statistics are gathered for a specific reason.
(2) Statistics are presented in quantitative terms rather than qualitative terms.
(3) Experiment statistics are similar and can be categorised into distinct categories.
Question 3: What are (i) primary data (ii) secondary data? Which of the two—the primary or the secondary data—is more reliable and why?
Solution:
(i) Primary data: Primary data is obtained when an investigator collects row data with a specific plan and without the use of existing sources.
(ii)Secondary data: Secondary data is information obtained from other published or unpublished sources.
Secondary data is information gathered by a person or an organisation for a specific purpose that is then used by someone else in a different way.
Primary data is accurate and valid since it is unique and is compiled by people or research organisations.
Question 4: Why do we group data?
Solution:
Raw data refers to information that has been collected in its natural state. It's impossible to extract information from raw data, and it can be perplexing at times. Data is clustered in order to make it more understandable and interpretable. Grouped data is useful for calculating specific values that will aid in the description and analysis of the data.
Question 5: Explain the meaning of the following terms:
(i) Variate
(ii) Class-interval
(iii) Class-size
(iv) Class-mark
(v) Frequency
(vi) Class limits
(vii) True class limits
Solution:
(i) Variate: Any character trait that differs from one individual to the next.
(ii) Class-interval: Class interval is the data of each group into which raw data is taken.
(iii) Class-size: The discrepancy between the higher and lower limits.
(iv) Class-mark: The chosen class's middle value. It can be calculated as:
Class-mark = ((Upper limit + Lower limit))/2
(v) Frequency: The total number of observations for each class.
(vi) Class limits: The class limits are two figures that define each class. The figures on the right side of the class are referred to as upper limits, while those on the left are referred to as lower limits.
(vii) True class limits:
In Inclusive class. For example: 10-19, 20-29, 30-39
True lower limit of class is – 0.5
True upper limit of class is + 0.5
True limits of the class 10 – 19 are 9.5 – 19.5,
True limits of the class 20 – 29 are 19.5 – 29.5
If exclusive class 20-30, 30-40, 40-50, then class limits and true class limits are the same.
Question 6: The ages of ten students of a group are given below. The ages have been recorded in years and months:
8 – 6, 9 – 0, 8 – 4, 9 – 3, 7 – 8, 8 – 11, 8 – 7, 9 – 2, 7 – 10, 8 – 8
(i) What is the lowest age?
(ii) What is the highest age?
(iii) Determine the range?
Solution:
The ages of ten students of a group are:
8 – 6, 9 – 0, 8 – 4, 9 – 3, 7 – 8, 8 – 11, 8 – 7, 9 – 2, 7 – 10, 8 – 8.
(i) 7 years 8 months is lowest age.
(ii) 9 years 3 months is highest age.
(iii) Range = Highest – Lowest
Range = (9 years 3 months) – (7 years 8 months)
Range = 1 year 7 months
Question 7: The monthly pocket money of six friends is given below:
Rs. 45, Rs. 30, Rs. 40, Rs. 50, Rs. 25, Rs. 45.
(i) What is the highest pocket money?
(ii) What is the lowest pocket money?
(iii) What is the range?
(iv) Arrange the amounts of pocket money in ascending order.
Solution:
The monthly pocket money of six friends is given below:
Rs. 45, Rs. 30, Rs. 40, Rs. 50, Rs. 25, Rs. 45
(i) Highest pocket money = Rs. 50
(ii) Lowest pocket money = Rs. 25
(iii) Range = Highest – Lowest
Range = Rs. 50 – Rs. 25
Range = Rs. 25
(iv) Arrangement in Ascending order is: Rs. 25, Rs. 30, Rs. 40, Rs. 45, Rs. 45, Rs. 50.
Question 8: Write the class -size in each of the following:
(i) 0-4, 5-9, 10-14
(ii) 10-19, 20-29, 30-39
(iii) 100-120, 120-140, 160-180
(iv) 0-0.25, 0.25-00.50, 0.50-0.75
(v) 5-5.01, 5.01-5.02, 5.02-5.03.
Solution:
(i) 0 - 4, 5 - 9, 10 - 14
Inclusive Series = 0 - 4, 5 - 9, 10 – 14
Lower limit of class = – 0.5
Upper limit of class = + 0.5
Exclusive Series = - 0.5 - 4.5, 4.5 - 9.5, 9.5 - 14.5
Class size = 4.5 – (-0.5) = 5
Class size = 4.5 + 0.5
Class size = 5
(ii) 10-19, 20-29, 30-39
Inclusive Series = 10-19, 20-29, 30-39
Lower limit of class = – 0.5
Upper limit of class = + 0.5
Exclusive Series = 9.5 - 19.5, 19.5 - 29.5, 29.5 - 29.5
Class size = 19.5 - 9.5
Class size = 10
(iii) 100 - 120, 120 - 140, 160 - 180
Exclusive Series = 100 - 120, 120 - 140, 160 - 180
Class size = 120 – 100 = 20
(iv) 0 - 0.25, 0.25 - 00.50, 0.50 - 0.75
Exclusive Series = 0 - 0.25, 0.25 - 00.50, 0.50 - 0.75
Class size = 0.25 – 0
Class size = 0.25
(v) 5 - 5.01, 5.01 - 5.02, 5.02 - 5.03
Exclusive Series = 5 - 5.01, 5.01 - 5.02, 5.02 - 5.03
Class size = 5.01 – 5.0
Class size = 0.01.
Question 9: The final marks in mathematics of 30 students are as follows:
53, 61, 48, 60, 78, 68, 55, 100, 67, 90, 75, 88, 77, 37, 84, 58, 60, 48, 62, 56, 44, 58, 52, 64, 98, 59, 70, 39, 50, 60.
(i) Arrange these marks in ascending order, 30 to 39 one group,40 to 49 second group etc.
Now answer the following:
(ii) What is the highest score?
(iii) What is the lowest score?
(iv) What is the range?
(v) If 40 is the pass mark how many have failed?
(vi) How many have scored 75 or more?
(vii) Which observations between 50 and 60 have not actually appeared?
(viii) How many have scored less than 50?
Solution:
(ii) Highest marks is 100
(iii) Lowest marks is 37
(iv) Range = Highest Marks – Lowest Marks
Range = 100 – 37
Range = 63
(v) 2 students are fail as they are getting less than 40 marks.
(vi) 8 student scored more than 75 marks.
(vii) 51, 54, 57 observations between 50 and 60 have not actually appeared
(viii) 5 observations have scored less than 50.
Question 10: The weights of new born babies (in kg.) in a hospital on a particular day are as follows:
2.3, 2.2, 2.1, 2.7, 2.6, 3.0, 2.5, 2.9, 2.8, 3.1, 2.5, 2.8, 2.7, 2.9, 2.4
(i) Rearrange the highest weight.
(ii) Determine the highest weight.
(iii) Determine the lowest weight.
(iv) Determine the range.
(v) How many babies were born on that day?
(vi) How many babies weight below 2.5 kg?
(vii) How many babies weight more than 2.8 kg?
(viii) How many babies weigh 2.8 kg?
Solution:
(i) Arrange weights in descending order:
3.1, 3.0, 2.9, 2.9, 2.8, 2.8, 2.7, 2.7, 2.6, 2.5, 2.5, 2.4, 2.3, 2.2, 2.1.
(ii) Highest weight is 3.1 Kg
(iii) Lowest weight is 2.1 Kg
(iv) Range = Highest weight – Lowest weight
Range = 3.1 kg – 2.1 kg
Range = 1.0 Kg
(v) Number of babies were born on that particular day are 15.
(vi) Number of babies weigh below 2.5 kg are 4.
(vii) Babies more than 2.8 Kg weight are 4.
(viii) Babies weigh 2.8 Kg are 2.
Question 11: The number of runs scored by a cricket player in 25 innings is as follows:
26, 35, 94, 48, 82, 105, 53, 0, 39, 42, 71, 0, 64, 15, 34, 15, 34, 6, 71, 0, 64, 15, 34, 15, 34, 67, 0, 42, 124, 84, 54, 48, 139, 64, 47
(i) Rearrange these runs in ascending order.
(ii) Determine the player, is highest score.
(iii) How many times did the player not score a run?
(iv) How many centuries did he score?
(v) How many times did he score more than 50 runs?
Solution:
(i) Ascending order:
0, 0, 0, 0, 6, 15, 15, 15, 15, 26, 34, 34, 34, 34, 35, 39, 42, 42, 47, 48, 48, 53, 54, 64, 64, 64, 67, 71, 71, 82, 84, 90, 94, 105, 124, 139.
(ii) Highest Run = 139
(iii) 4 times, he did not score any run.
(iv) 3 centuries he scored.
(v) He scored more than 50 runs 12 times.
Question 12: The class size of distribution is 25 and the first class-interval is 200 - 224. There are seven class-intervals.
(i) Write the class-intervals.
(ii) Write the class marks of each interval.
Solution:
It is given that, Class size is 25
First class interval = 200 - 224
(i) Seven class interval: 200 - 224, 225 - 249, 250 - 274, 275 - 299, 300 - 324, 325 - 349, 350 - 374.
(ii) Class mark = 200 – 224
Class mark =(200 + 224)/2
Class mark =424/2
Class mark =212
Class mark = 225 – 249
Class mark =(225 + 249)/2
Class mark =479/2
Class mark = 237
Class mark = 250 – 274
Class mark =(250 + 274)/2
Class mark = 524/2
Class mark = 287
Class mark = 300 – 324
Class mark =(300 + 324)/2
Class mark = 624/2
Class mark = 312
Class mark = 325 – 349
Class mark =(325 + 349)/2
Class mark = 674/2
Class mark = 337
Class mark = 350 – 374
Class mark =(350 + 374)/2
Class mark = 724/2
Class mark = 362
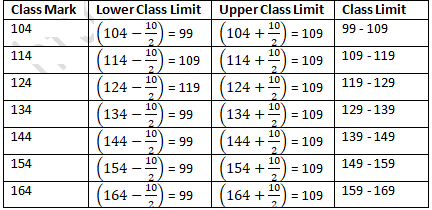
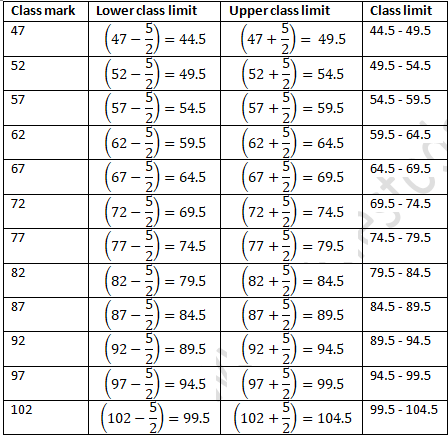
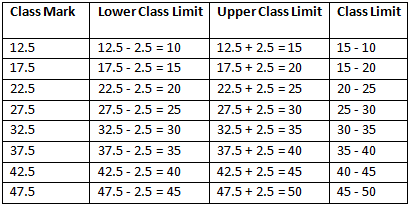
Question 13: Write the class size and class limits in each of the following:
(i) 104, 114, 124, 134, 144, 154 and 164.
(ii) 47, 52, 57, 62, 67, 72, 78, 82, 87, 92, 97, 102.
(iii) 12.5, 17.5, 22.5, 27.5, 32.5, 37.5, 42.5, 47.5.
Solution:
(i) 104, 114, 124, 134, 144, 154 and 164.
Class size = 114 – 104 = 10
Lower Class Limit = Class mark – (Class Size)/2
Lower Class Limit = (104-10/2) = 99
Upper Class Limit = Class mark + (Class Size)/2
Upper Class Limit = (104+10/2) = 109
(ii) 47, 52, 57, 62, 67, 72, 78, 82, 87, 92, 97, 102.
Class size = 52 – 47 = 5
Lower Class Limit = Class mark – (Class Size)/2
Lower Class Limit = (47-5/2)
Lower Class Limit = 47 – 2.5
Lower Class Limit = 44.5
Upper Class Limit = Class mark + (Class Size)/2
Upper Class Limit = (47+5/2)
Upper Class Limit = 47 + 2.5
Upper Class Limit = 49.5
(iii) 12.5, 17.5, 22.5, 27.5, 32.5, 37.5, 42.5, 47.5.
Class size = 17.5 - 12.5 = 5
Lower Class Limit = Class mark – (Class Size)/2
Lower Class Limit = (12.5-5/2)
Lower Class Limit = 12.5 – 2.5
Lower Class Limit = 10
Upper Class Limit = Class mark + (Class Size)/2
Upper Class Limit = (12.5+5/2)
Upper Class Limit = 12.5 + 2.5
Upper Class Limit = 15
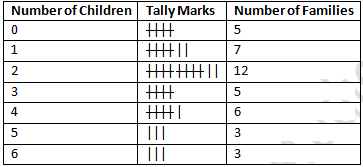
Question 14: Following data gives the number of children in 40 families:
1, 2, 6, 5, 1, 5, 1, 3, 2, 6, 2, 3, 4, 2, 0, 0, 4, 4, 3, 2, 2, 0, 0, 1, 2, 2, 4, 3, 2, 1, 0, 5, 1, 2, 4, 3, 4, 1, 6, 2, 2.
Represent it in the form of a frequency distribution.
Solution:
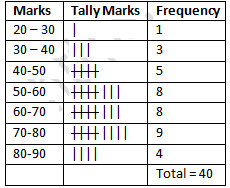
Question 15: Marks scored by 40 students of class IX in mathematics are given below:
81, 55, 68, 79, 85, 43, 29, 68, 54, 73, 47, 35, 72, 64, 95, 44, 50, 77, 64, 35, 79, 52, 45, 54, 70, 83, 62, 64, 72, 92, 84, 76, 63, 43, 54, 38, 73, 68, 52, 54.
Prepare a frequency distribution with class size of 10 marks.
Solution:
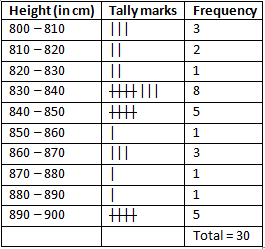
Question 16: Heights (in cm) of 30 students of class IX are given below:
155, 158, 154, 158, 160, 148, 149, 150, 153, 159, 161, 148, 157, 153, 157, 162, 159, 151, 154, 156 , 152 , 156 , 160, 152, 147, 155, 163, 155 , 157 , 153.
Prepare a frequency distribution table with 160 - 164 as one of the class intervals.
Solution:
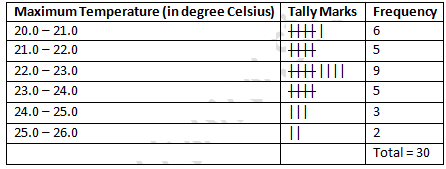
Question 17: The daily maximum temperatures (in degree Celsius) recorded in a certain city during the month of November are as follows:
25.8, 24.5, 25.6, 20.7, 21.8, 20.5, 20.6, 20.9, 22.3, 22.7, 23.1, 22.8, 22.9, 21.7, 21.3, 20.5, 20.9, 23.1, 22.4, 21.5, 22.7, 22.8, 22.0, 23.9, 24.7, 22.8, 23.8, 24.6, 23.9, 21.1.
Represent the data in the form of a frequency distribution table with class size 11°C.
Solution:
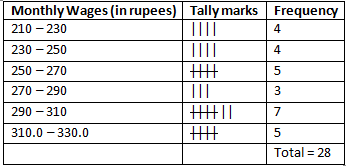
Question 18: Construct a frequency table with equal class intervals from the following data on the monthly wages (in rupees) of 28 laborers working in a factory, taking one of the class intervals as 210 – 230 (230 not included).
220, 268, 258, 242, 210, 268, 272, 242, 311, 290, 300, 320, 319, 304, 302, 218, 306, 292, 254, 278, 210, 240, 280, 316, 306, 215, 256, 236.
Solution:
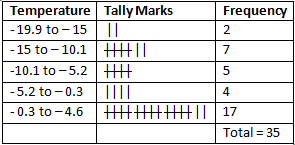
Question 19: The daily minimum temperatures in degree Celsius recorded in a certain arctic region are as follows:
-12.5, -10.8, -18.6, -8.4-10.8, -4.2, -4.8, -6.7, -13.2, -11.8, -2.3, -1.2, -2.6, 0, 2.4, 0, 3.2, 2.7, 3.4, 0, -2.4, -2.4, 0, 3.2, 2.7, 3.4, 0, -2.4, -5.8, -8.9, -14.6, -12.3, -11.5, -7.8, -2.9.
Represent them as frequency distribution table taking -19.9 to -15 as the first class interval.
Solution:
Since first class interval is -19.9 to -15, frequency distribution with lower limit included and upper limit excluded is:
Question 20: The blood groups of 30 students of class VIII are recorded as follows:
A, B, O, O, AB, O, A, O, B, A, O, B, A, O, O, A, AB, O, A, A, O, O, AB, B, A, O, B, A, B, O
Represent this data in the form of a frequency distribution table .Find out which is the most common and which is the rarest blood group among these students.
Solution:
Here 9 students have blood group A, 6 as B, 3 as AB and 12 as O
So the table representing the data is as follows:
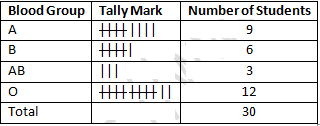
Blood group O is the most common as 12 students having it. AB is the rarest blood group as only 3 students having it.
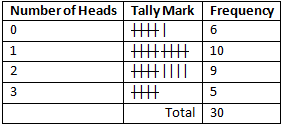
Question 21 : Three coins were tossed 30 times. Each time the number of heads occurring was noted down as follows:
0, 1, 2, 2, 1, 2, 3, 1, 3, 0
1, 3, 1, 1, 2, 2, 0, 1, 2, 1
3, 0, 1, 1, 2, 3, 2, 2, 0
Prepare a frequency distribution table for the data given above.
Solution:
By observing the data given above, the following frequency table can be constructed:
Question 22: Thirty children were asked about the number of hours they watched TV programes in the previous week. The results were found as follows:
1, 6, 2, 3, 5, 12, 5, 8, 4, 8
10, 3, 4, 12, 2, 8, 15, 1, 17, 6
3, 2, 8, 5, 9, 6, 8, 7, 14, 2.
(i) Make a frequency distribution table for this data, taking class width 5 and one of the class intervals as 5 - 10.
(ii) How many children watched television for 15 or more hours a week.
Solution:
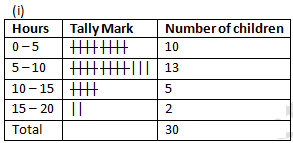
(ii) 2 children watched TV for 15 or more hours a week.
Exercise 22.2
Question 1: Define cumulative frequency distribution.
Solution:
A table that depicts the distribution of cumulative frequencies across different groups.
Question 2: Explain the difference between a frequency distribution and a cumulative frequency distribution.
Solution:
A cumulative frequency distribution is a table that plays the manner in which cumulative frequencies are spread over different groups, and it is a way to represent raw data in a context from which one can readily interpret the information found in raw data.
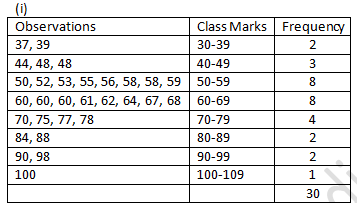
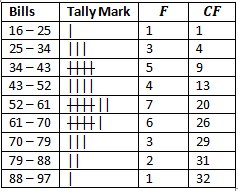
Question 3: The marks scored by 55 students in a test are given below:
Prepare a cumulative frequency table
Solution:
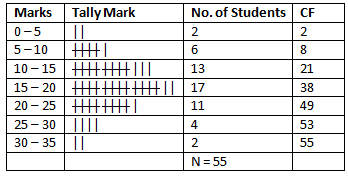
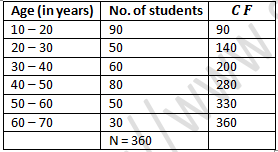
Question 4: Following are the ages of 360 patients getting medical treatment in a hospital on a day.
Construct a cumulative frequency table.
Solution:
Question 5: The water bills (in rupees) of 32 houses in a certain street for the period 1.198 to 31.398 are given below:
56, 43, 32, 38, 56, 24, 68, 85, 52, 47, 35, 58, 63, 74, 27, 84, 69, 35, 44, 75, 55, 30, 54, 65, 45, 67, 95, 72, 43, 65, 35, 69.
Tabulate the data and present the data as a cumulative frequency table using 70-79 as one of the class intervals.
Solution:
Range = Maximum bill - Minimum bill
Range = 95 - 24
Range = 71
Class size = 79 – 70 = 9
Number of classes = Range/(Class size)
Number of classes = 71/9
Number of classes = 7.80
Number of classes = 8
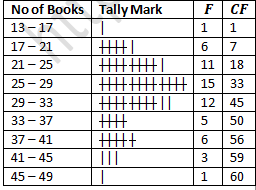
Question 6: The number of books in different shelves of a library is as follows:
30, 32, 28, 24, 20, 25, 38, 37, 40, 45, 16, 20
19, 24, 27, 30, 32, 34, 35, 42, 27, 28, 19, 34
38, 39, 42, 29, 24, 27, 22, 29, 31, 19, 27, 25
28, 23, 24, 32, 34, 18, 27, 25, 37, 31, 24, 23
43, 32, 28, 31, 24, 23, 26, 36, 32, 29, 28, 21.
Prepare a cumulative frequency distribution table using 45 – 49 as the last class-interval.
Solution:
Range = Maximum book shelves - Minimum book shelves
Range = 45 - 16
Range = 29
Class interval is 45 – 49.
Class size = 49 - 45
Class size = 4
Number of classes = Range/(Class size)
Number of classes = 29/4
Number of classes = 7.25
Number of classes = 8
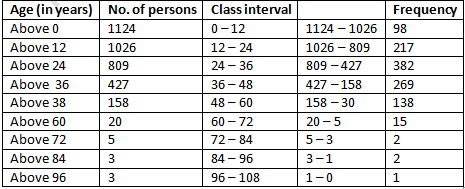
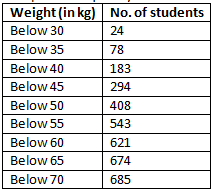
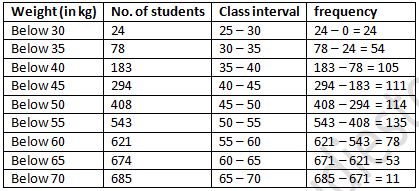
Question 7: Given below are the cumulative frequencies showing the weights of 685 students of a school. Prepare a frequency distribution table.
Solution:
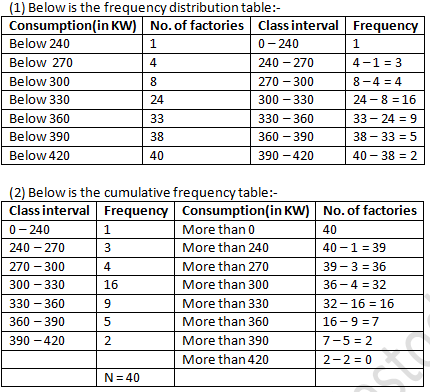
Question 8: The following cumulative frequency distribution table shows the daily electricity consumption (in KW) of 40 factories in an industrial state.
(1) Represent this as a frequency distribution table.
(2) Prepare a cumulative frequency table.
Solution:
Question 9: Given below is a cumulative frequency distribution table showing ages of the people living in a locality:
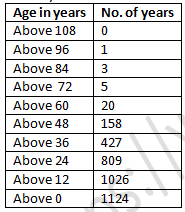
Prepare a frequency distribution table.
Solution:
Below is the frequency distribution table:-