
Read and download the CBSE Class 11 Economics Measures of Correlation Worksheet in PDF format. We have provided exhaustive and printable Class 11 Economics worksheets for Statistics for Economics Chapter 6 Measures of Correlation, designed by expert teachers. These resources align with the 2026-27 syllabus and examination patterns issued by NCERT, CBSE, and KVS, helping students master all important chapter topics.
Chapter-wise Worksheet for Class 11 Economics Statistics for Economics Chapter 6 Measures of Correlation
Students of Class 11 should use this Economics practice paper to check their understanding of Statistics for Economics Chapter 6 Measures of Correlation as it includes essential problems and detailed solutions. Regular self-testing with these will help you achieve higher marks in your school tests and final examinations.
Class 11 Economics Statistics for Economics Chapter 6 Measures of Correlation Worksheet with Answers
Question. If all the points lie on the same downward sloping line, the correlation is said to be
(a) perfect correlation
(b) perfect positive correlation
(c) perfect negative correlation
(d) negative correlation
Answer: C
Question. Correlation is an analysis of ...... between two or more variables.
(a) relationship
(b) covariation
(c) determination
(d) calculation
Answer: B
Question. Scatter diagram can be used to indicate which of the following degrees of correlation?
(a) Perfect positive correlation
(b) Perfect negative correlation
(c) No correlation
(d) All of the above
Answer: D
Question. Which of the following techniques deals with the association between two or more variables?
(a) Index number
(b) Correlation
(c) Dispersion
(d)None of these
Answer: B
Question. When the mean of series is a decimal number, then which method should be used for computing Karl Pearson’s coefficient of correlation?
(a) Direct Method
(b) Short-cut Method
(c) Step Deviation Method
(d)None of these
Answer: B
Question. When two variables move together in the same direction, it is said to be
(a) no correlation
(b) negative correlation
(c) positive correlation
(d) zero correlation
Answer: C
Question.The coefficient of correlation is independent of
(a) change of scale only
(b) change of origin only
(c) both change of scale and origin
(d) None of the above
Answer: C
Question. A modified version of Karl Pearson’s formula is
(a) r=∑xy/∑x2.∑y2
(b) r= ∑xy/√∑x2x∑y2
(c) r= ∑xy/n∑x2·∑y2
(d) r= ∑xy/nδx·δy
Answer: B
Question. Karl Pearson’s coefficient of correlation indicates the ...... and also the degree of relationship between the two variables.
(a) direction
(b) relation
(c) interpretation
(d)None of these
Answer: A
Question. Which of the following pair is correctly matched? 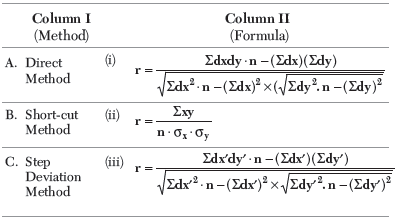
Codes
(a) A–(i)
(b) B–(ii)
(c) C–(iii)
(d) None of these
Answer: C
Question. Statement I Correlation is a multivariate analysis.
Statement II Partial correlation considers all other variables to be constant.
Alternatives
(a) Statement I is correct and Statement II is incorrect
(b) Statement II is correct and Statement I is incorrect
(c) Both the statements are correct
(d) Both the statements are incorrect
Answer: C
Question. The minimum limit of correlation under Karl Pearson’s method is
(a) −1
(b) 0
(c) 1
(d) None of these
Answer: A
Question. If the dots in a scatter diagram fall on a narrow band, it indicates a ..........degree of correlation.
(a) zero
(b) high
(c) low
(d) None of these
Answer: C
Question. Statement I Non-linear correlation is also called curvy linear correlation.
Statement II Numerical measure of correlation is called coefficient of determination.
Alternatives
(a) Statement I is correct and Statement II is incorrect
(b) Statement II is correct and Statement I is incorrect
(c) Both the statements are correct
(d) Both the statements are incorrect
Answer: A
Question. Coefficient of correlation lies between
(a) 0 and +1
(b) 0 and –1
(c) –1 and +1
(d) – 3 and +3
Answer: C
Assertion–Reasoning based MCQs
(a) Both Assertion (A) and Reason (R) are true and Reason (R) is the correct explanation of Assertion (A)
(b) Both Assertion (A) and Reason (R) are true, but Reason (R) is not the correct explanation of Assertion (A)
(c) Assertion (A) is false, but Reason (R) is true
(d) Both Assertion (A) and Reason (R) are false
Question. Assertion (A) Correlation analysis is a means for examining inter relationships systematically.
Reason (R) Causation explain the cause and effect relationship between variables.
Answer: B
Question. Assertion (A) Sale of ice-cream increases during summer, shows positive correlation.
Reason (R) When two variables move in same direction, it shows positive correlation.
Answer: B
Question. Assertion (A) Broadly, there only two types of correlation i.e., positive and negative.
Reason (R) The correlation is said to be positive when the variables move together in the same direction, the correlation is negative when they move in opposite directions.
Answer: B
Question. Assertion (A) Karl Pearson’s method is non-mathematical in nature.
Reason (R)Degree of correlation helps in identifying the nature of correlation between variables.
Answer: C
Case Study Questions Measures of Correlation Class 11 Economics
Coefficient of correlation is an important statistical tool which is used to measure the relationship between two variables. This is not only useful in the field of statistics but also used in other disciplines like Economics, Geography, Psychology.
In the present time due to the outbreak of Covid-19 corona virus, demand has gradually come down in almost all areas. As per the latest estimates, demand for car has decreased after the nationwide lockdown is lifted in phased manner.
Question: If one variable change exactly in the reverse direction of the other variable, ........... should be the degree of correlation.
(a) positive correlation
(b) negative correlation
(c) perfect positive correlation
(d) perfect negative correlation
Answer: D
Question: Which method of calculating correlation uses actual mean?
(a) Karl Pearson’s coefficient of correlation
(b) Scatter diagram method
(c) Spearman’s rank correlation method
(d) Both (a) and (c)
Answer: A
Question: In perfect positive correlation, the value of ‘r’ is …… .
(a) –1
(b) 0
(c) 1
(d) infinity
Answer: C
Question: Which of the following tools can be used to know the pattern of demand during lockdown?
(a) Correlation
(b) Causation
(c) Both (a) and (b)
(d) Neither (a) nor (b)
Answer: B
Question: What will be the coefficient of correlation between demand for car and varied level of income due to nationwide lockdown?
(a) Positive correlation
(b) Negative correlation
(c) Perfect positive correlation
(d) No correlation
Answer: A
Question: The correlation between using mask and being injected by the virus will be
(a) positive
(b) negative
(c) Not correlated
(d) Either (a) or (b)
Answer: B
Short Answer Type Questions :
Question. Give two examples of negative correlation.
Answer: (i) Sale of swollen garments and day temperature.
(ii) Yield of crops and price.
Question. Mention the principal short coming of Karl Pearson’s coefficient ofcorrelation.
Answer: The value of the coefficient is affected by extreme items.
Question. Mention the names of different methods for measuring correlation.
Answer: (i) Scatter diagram
(ii) Karl Pearson’s coefficient of correlation.
(iii) Spearman’s Rank correlation.
Question. What is meant by correlation?
Answer: Correlation is a statistical tool which studies the relationship between two variables.
Question. Give two examples of positive correlation?
Answer: (i) Age of husband and age of wife.
(ii) Increase in height and weight.
Question. What is the range of simple correlation coefficient?
Answer: 1 ≤ r ≤ 1
Question. What is negative correlation?
Answer: The correlation is said to be negative when the variables move in opposite direction.
Question. The unit of correlation coefficient between height in feet and weight in kilograms is
(i) kg / feet
(ii) percentage
(iii) non existent
Answer: Non existent
Question. Give two examples of negative correlation.
Answer: (i) Sale of swollen garments and day temperature.
(ii) Yield of crops and price.
Question: Why is ‘r’ preferred to covariance as a measure of association?
Answer: Both, correlation coefficient and covariance measure the degree of linear relationship between two variables but correlation coefficient is generally preferred to covariance.
It is due to the following reasons
(i) The correlation coefficient (r ) has no unit.
(ii) The correlation coefficient is independent of origin as well as scale.
Question: What do you understand by ‘spurious’ or ‘non-sense’ correlation?
Answer: If there is no evident or sensible connection between two variables, then the correlation between these variables is said to be spurious, non-sense or chance correlation. For example, correlation between rainfall recorded and production of steel.
These two variables are not connected by any way. So,the correlation between these variables is said to be spurious.
Question: Give the advantages of Karl Pearson’s coefficient of correlation.
Answer: The advantages of Karl Pearson’s coefficient of correlation are
(i) Karl Pearson’s coefficient of correlation indicates the relationship as positive or negative and thus direction of the relationship can be ascertained.
(ii) This measure gives summarised and precise quantitative figure of correlation which can be interpreted easily and can provide meaningful results.
(iii) This coefficient of correlation indicates the direction and also the degree of relationship between the two variables. It shows whether the relationship is high, moderate or low.
Question: List some variables where accurate measurement is difficult.
Answer: Accurate measurement is difficult in case of
(i) Qualitative variables such as beauty, intelligence,honesty, etc.
(ii) It is also difficult to measure subjective variables such as poverty, development, etc, which are
(iii) Where the cause and effect relationship is not known.
Question: Interpret the values of r as 1, –1 and 0.
Answer: (i) If r = 0, the two variables are uncorrelated. There is no linear relation between them. However, other types of relation may be there and hence thevariables may not be independent.
(ii) If r = 1, the correlation is perfectly positive. The relation between them is exact in the sense that if one increases,the other also increases in the same proportion and if one decreases, the other also decreases in the same proportion.
(iii) If r = –1, the correlation is perfectly negative. The relation between them is exact in the sense that if one increases, the other decreases in the same
proportion and if one decreases, the other increases in the same proportion.
Question: Can r lie outside the −1 and 1 range depending on the type of data?
Answer: No, the value of the correlation coefficient lies between minus one and plus one i.e., −1 £ r £ 1. If the value of r is outside this range in any type of data, it indicates error in calculation as in between two or more variables, there can be either a perfect or an imperfect relationship. A perfect relationship is indicated by –1 or 1 and imperfect relationships are indicated by a value between –1 and 1,excluding 0.
Question: Give the disadvantages of Karl Pearson’s coefficient of correlation.
Answer: The disadvantages of Karl Pearson’s coefficient of correlation are
(i) The value of coefficient is affected by extreme items.
(ii) The calculation process consumes a lot of time.
(iii) Correlation coefficient needs very careful interpretation, otherwise it may be misinterpreted.
Free study material for Economics
CBSE Economics Class 11 Statistics for Economics Chapter 6 Measures of Correlation Worksheet
Students can use the practice questions and answers provided above for Statistics for Economics Chapter 6 Measures of Correlation to prepare for their upcoming school tests. This resource is designed by expert teachers as per the latest 2026 syllabus released by CBSE for Class 11. We suggest that Class 11 students solve these questions daily for a strong foundation in Economics.
Statistics for Economics Chapter 6 Measures of Correlation Solutions & NCERT Alignment
Our expert teachers have referred to the latest NCERT book for Class 11 Economics to create these exercises. After solving the questions you should compare your answers with our detailed solutions as they have been designed by expert teachers. You will understand the correct way to write answers for the CBSE exams. You can also see above MCQ questions for Economics to cover every important topic in the chapter.
Class 11 Exam Preparation Strategy
Regular practice of this Class 11 Economics study material helps you to be familiar with the most regularly asked exam topics. If you find any topic in Statistics for Economics Chapter 6 Measures of Correlation difficult then you can refer to our NCERT solutions for Class 11 Economics. All revision sheets and printable assignments on studiestoday.com are free and updated to help students get better scores in their school examinations.
FAQs
You can download the latest chapter-wise printable worksheets for Class 11 Economics Statistics for Economics Chapter 6 Measures of Correlation for free from StudiesToday.com. These have been made as per the latest CBSE curriculum for this academic year.
Yes, Class 11 Economics worksheets for Statistics for Economics Chapter 6 Measures of Correlation focus on activity-based learning and also competency-style questions. This helps students to apply theoretical knowledge to practical scenarios.
Yes, we have provided solved worksheets for Class 11 Economics Statistics for Economics Chapter 6 Measures of Correlation to help students verify their answers instantly.
Yes, our Class 11 Economics test sheets are mobile-friendly PDFs and can be printed by teachers for classroom.
For Statistics for Economics Chapter 6 Measures of Correlation, regular practice with our worksheets will improve question-handling speed and help students understand all technical terms and diagrams.