
Read and download the CBSE Class 11 Economics Presentation Of Data Worksheet in PDF format. We have provided exhaustive and printable Class 11 Economics worksheets for Statistics for Economics Chapter 4 Presentation of Data, designed by expert teachers. These resources align with the 2026-27 syllabus and examination patterns issued by NCERT, CBSE, and KVS, helping students master all important chapter topics.
Chapter-wise Worksheet for Class 11 Economics Statistics for Economics Chapter 4 Presentation of Data
Students of Class 11 should use this Economics practice paper to check their understanding of Statistics for Economics Chapter 4 Presentation of Data as it includes essential problems and detailed solutions. Regular self-testing with these will help you achieve higher marks in your school tests and final examinations.
Class 11 Economics Statistics for Economics Chapter 4 Presentation of Data Worksheet with Answers
CBSE Class 11 Economics Worksheet - Presentation Of Data - Practice worksheets for CBSE students. Prepared by teachers of the best CBSE schools in India.
CLASS –XI
Economics
Presentation Of Data
Question: Define or explain briefly.
(a) Statistical Table
(b) Tabulation
(c) Time series
(d) Pie Diagram
Question:. Name 4 types of presentation
Question: Give 2 object of Presentation
Question: Ogives are also know as
Question: Discuss the following :
(a) Objectives of Tabulation
(b) Parts of a Table (with diagram)
(c) Type of Tables
(d) Importance of graphs and diagrams
(e) Various types of one dimensional diagram
(f) Limitations of Diagrammatic Presentation
(g) Point to keep in mind while preparing a table.
Question: Differentiate between:
(a) Graphs/ Diagrams
(b) Stub /Caption
(c) Subdivided/ Percentage Bar diagram
(d) Deviation /Broken Bar Diagram
Question: How will a histogram be drawn if
(a) Class intervals are uneqnal
(b) Class intervals are inclusive
Question: Give alternative terms for
(a) Multiple Bar Diagram
(b) Angular Diagram
(c) Sub-Divided Bar Diagram
(d) Time Series
Multiple Choice Questions
Question. Which of the following method(s) of statistics is followed by collection of primary data in a statistical enquiry?
(a) Classification
(b) Organisation
(c) Presentation
(d) Both (a) and (b)
Answer : D
Question. Frequency polygon can be drawn
(a) with histogram only
(b) without histogram only
(c) Both (a) and (b)
(d) Neither (a) nor (b)
Answer : C
Question. The systematic presentation of raw data in row and column is called tabulation.
Choose from the options below.
(a) True
(b) False
(c) Partially true
(d) Incomplete statement
Answer : A
Question. Horizontal bar graphs are also known as
(a) Complex bar graph
(b) Simple bar graph
(c) Derived bar graph
(d) None of these
Answer : B
Question. General purpose table is also referred to as
(a) Repository table
(b) Original table
(c) Both (a) and (b)
(d) Neither (a) nor (b)
Answer : A
Question. Accuracy is not required while drawing the diagrams. Choose from the options below.
(a) True
(b) False
(c) Partially true
(d) Incomplete statement
Answer : B
Question. Which of the following is/are part(s) of a table?
(a) Stubs
(b) Captions
(c) Title
(d) All of these
Answer : D
Question. Which of the following are methods of presentation of data?
(i) Text presentation
(ii) Semi-tabular presentation
(iii) Tabular presentation
(iv) Pictorial presentation
Choose from the options below.
(a) (i), (ii), (iii)
(b) (ii), (iii), (iv)
(c) (i), (iii), (iv)
(d) (i), (ii), (iii), (iv)
Answer : D
Question. On the basis of construction, which of the following are types of table?
(a) Simple table
(b) Complex table
(c) Derived table
(d) Both (a) and (b)
Answer : D
Question. The main part of table is known as
(a) Body
(b) Heading
(c) Footnote
(d) None of these
Answer : A
Question. Histogram always starts from the origin.
Choose from the options below.
(a) True
(b) False
(c) Partially true
(d) Incomplete statement
Answer : C
Question. The most accurate mode of presentation for comparison and computation is the ........ .
(a) diagram
(b) table
(c) text
(d) All of these
Answer : B
Question. A simple bar graph can be drawn
(a) vertically
(b) horizontally
(c) Both (a) and (b)
(d) Neither (a) nor (b)
Answer : C
Question. Tabulation makes the data complex.
Choose from the options below.
(a) True
(b) False
(c) Partially true
(d) Incomplete statement
Answer : B
Question. Which of the following is/are essentials of a good classification?
(a) It should comprised of all the items of the population
(b) It should be simple and clear
(c) It should be comprised of all related instruction of understanding
(d) All of the above
Answer : D
Case Study Questions Presentation of data Class 11 Economics
50 students were asked to choose their Favourite sport these are the results.
![]()
The data is to be illustrated in a pie chart.
Question: In which form a data presented in a pie diagram?
(a) percentage
(b) Degrees
(c) Absolute values
(d) table
Answer: A
Question: What angle should be used for football.
(a) 36̊
(b) 72̊
(c) 90̊
(d) 10̊
Answer: A
Question: What angle should be used for tennis.
(a) 8̊
(b) 57.6̊
(c) 28.8̊
(d) 64̊
Answer: B
Question: In a pie diagram/circle 1% is equal to.......
(a) 1
(b) 3.6
(c) 36
(d) 10
Answer: B
Answer the following questions based on the histogram Given below.
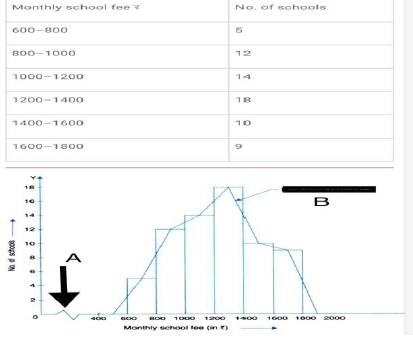
Question: Which group contains maximum monthly school fee?
(a) 1000-1200
(b) 1200-1400
(c) 1400-1600
(d) 800-1000
Answer: B
Question: What A denotes in the above diagram.
(a) Jagged line
(b) horizontal line
(c) Broken line
(d) Both A and C
Answer: C
Question: How many schools charge monthly school fee between 1200 to 1800?
(a) 44
(b) 37
(c) 42
(d)18
Answer: B
Question: A --------------------- becomes a ----------------- if we Draw a line joining mid points of the tops of all rectangular.
(a) Histogram, Frequency polygon
(b) Frequency polygon, Histogram
(c) Frequency ,Histogram
(d) Histogram, Frequency distribution
Answer: A
Question. Write the name of the curve which is formed by joining mid point of the top of all rectangles in a histogram.
Answer: Frequency polygon.
Question. State the meaning of sub divided bar diagrams
Answer : Sub divided bar diagrams are those diagrams in which more than one data are presented simultaneously, total values and parts there in a set of data.
Question. What is meant by tabulation?
Answer : The method of arranging data orderly in form of rows and columns is known as tabulation.
Question. What is meant by histogram?
Answer : Histogram is a graphical presentation of a frequency distribution of a continuous series.
Question. Define pie diagram.
Answer : Piediagram is a circle divided into various segment showing the percent value of a series.
Question. What is meant by false base line.
Answer : When there is a large gap between zero and minimum value of a variable than to minimise this gap we use false base line.
Question. What is meant by manifold table?
Answer : Manifold table shows more than three characteristics of the data.
Question. Define the give curve.
Answer : It is the curve which is constructed by plotting cumulative frequency data on the graph paper in a form of a smooth curve.
Question. Define caption as a part of table.
Answer : Caption is the title given to the columns of a table. It indicate information contained in the columns.
Question. State the meaning of frequency curve.
Answer : Frequency curve is obtained by joining the points of a frequency polygon through freehand smoothed curves not by straight lines.
Question. Define bar diagrams.
Answer : Bar diagrams are those diagrams in which data are presented in the form of bars and rectangles.
Free study material for Economics
CBSE Economics Class 11 Statistics for Economics Chapter 4 Presentation of Data Worksheet
Students can use the practice questions and answers provided above for Statistics for Economics Chapter 4 Presentation of Data to prepare for their upcoming school tests. This resource is designed by expert teachers as per the latest 2026 syllabus released by CBSE for Class 11. We suggest that Class 11 students solve these questions daily for a strong foundation in Economics.
Statistics for Economics Chapter 4 Presentation of Data Solutions & NCERT Alignment
Our expert teachers have referred to the latest NCERT book for Class 11 Economics to create these exercises. After solving the questions you should compare your answers with our detailed solutions as they have been designed by expert teachers. You will understand the correct way to write answers for the CBSE exams. You can also see above MCQ questions for Economics to cover every important topic in the chapter.
Class 11 Exam Preparation Strategy
Regular practice of this Class 11 Economics study material helps you to be familiar with the most regularly asked exam topics. If you find any topic in Statistics for Economics Chapter 4 Presentation of Data difficult then you can refer to our NCERT solutions for Class 11 Economics. All revision sheets and printable assignments on studiestoday.com are free and updated to help students get better scores in their school examinations.
FAQs
You can download the latest chapter-wise printable worksheets for Class 11 Economics Statistics for Economics Chapter 4 Presentation of Data for free from StudiesToday.com. These have been made as per the latest CBSE curriculum for this academic year.
Yes, Class 11 Economics worksheets for Statistics for Economics Chapter 4 Presentation of Data focus on activity-based learning and also competency-style questions. This helps students to apply theoretical knowledge to practical scenarios.
Yes, we have provided solved worksheets for Class 11 Economics Statistics for Economics Chapter 4 Presentation of Data to help students verify their answers instantly.
Yes, our Class 11 Economics test sheets are mobile-friendly PDFs and can be printed by teachers for classroom.
For Statistics for Economics Chapter 4 Presentation of Data, regular practice with our worksheets will improve question-handling speed and help students understand all technical terms and diagrams.