
Read and download the CBSE Class 11 Economics Measure Of Central Tendency And Positional Values Worksheet in PDF format. We have provided exhaustive and printable Class 11 Economics worksheets for Statistics for Economics Chapter 5 Measures of Central Tendency, designed by expert teachers. These resources align with the 2026-27 syllabus and examination patterns issued by NCERT, CBSE, and KVS, helping students master all important chapter topics.
Chapter-wise Worksheet for Class 11 Economics Statistics for Economics Chapter 5 Measures of Central Tendency
Students of Class 11 should use this Economics practice paper to check their understanding of Statistics for Economics Chapter 5 Measures of Central Tendency as it includes essential problems and detailed solutions. Regular self-testing with these will help you achieve higher marks in your school tests and final examinations.
Class 11 Economics Statistics for Economics Chapter 5 Measures of Central Tendency Worksheet with Answers
CLASS –XI
ECONOMICS
MEASURE OF CENTRAL TENDENCY AND POSITIONAL VALUES
Multiple Choice Questions
Question. Which of the following is/are objectives of averages?
(i) To facilitate comparison.
(ii) To help in decision-making.
(iii) To trace mathematical relation.
(iv) To understand the features of the problem.
Choose from the options below.
(a) (i), (ii), (iii)
(b) (ii), (iii), (iv)
(c) (i), (iii), (iv)
(d) All of these
Answer : D
Question. The average daily wage of a group of 100 workers was ₹ 250. Each worker is now given a raise of ₹ 50. What is the new average daily wage?
(a) 200
(b) 250
(c) 300
(d) 350
Answer : C
Question. Arithmetic mean of a group of 50 students in an exam is 48. If marks of every student are reduced by 3, the new average will be
(a) 45
(b) 48
(c) 51
(d) Can’t be calculated
Answer : A
Question. The most used method of central tendency is median. Choose from the options below.
(a) True
(b) False
(c) Partially true
(d) Incomplete statement
Answer : B
Question. Broadly, arithmetic mean is of ……… types.
(a) two
(b) three
(c) four
(d) five
Answer : A
Question. Choose the incorrect statement from given below.
(a) A good average is the one which is least affected by sampling fluctuations
(b) An average should be rigidly defined
(c) An average is based on the extreme observations of the statistical distribution
(d) An average should be capable of further algebraic treatment
Answer : C
Question. When arithmetic mean is calculated using assumed mean and the sum of deviation from assumed mean is zero, which of the below statement is correct in that situation?
(a) Assumed mean is equal to actual mean
(b) Assumed mean is less than actual mean
(c) Assumed mean is more than actual mean
(d) It’s an exception
Answer : A
Question. A distribution of three components with total number of terms being 200, 250 and 300 with means 25, 10 and 15 respectively. The combined mean will be equal to
(a) 200
(b) 240
(c) 300
(b) Can’t be determined
Answer : B
Question. Which of the following values of quartiles is equal to median?
(a) Q1
(b) Q2
(c) Q3
(d) None of these
Answer : B
Question. The sum of square of deviations from actual mean is
(a) minimum
(b) maximum
(c) zero
(d) not defined
Answer : A
Question. Arithmetic mean can be calculated under which of the following series?
(a) Cumulative series
(b) Open ended series
(c) Unequal frequency distribution
(d) All of the above
Answer : D
Question. Choose the correct option when equal weights are assigned to all the observations of the data.
(a) Weighted mean > Arithmetic mean
(b) Weighted mean < Arithmetic mean
(c) Weighted mean = Arithmetic mean
(d) They are not related
Answer : C
Question. Combined mean method can be used to combine arithmetic mean of ……… series.
(a) 2
(b) 3
(c) 5
(d) N-number
Answer : D
Question. Median of a given series is ‘k’. If all the item values of series are increased by ‘k’, then what will be the new median?
(a) 2k
(b) k2
(c) k +2
(d) Can’t be determined
Answer : D
Question. Calculation of mean in which of the following series is not accurate?
(a) Exclusive continuous series
(b) Inclusive continuous series
(c) Open-ended series
(d) Unequal class interval series
Answer : C
Question. Mode can be calculated only if the series is ……… .
(a) inclusive
(b) exclusive
(c) Both (a) and (b)
(d) Neither (a) nor (b)
Answer : B
Question. A frequency distribution with more than 2 modal values, is known as
(a) Bi-modal frequency distribution
(b) Tri-modal frequency distribution
(c) Multi-modal frequency distribution
(d) None of the above
Answer : C
Question. The lowest value of highest 25 percent items of the series is known as lower quartile. Choose from the options below.
(a) True
(b) False
(c) Partially true
(d) Incomplete statement
Answer : B
Question. What will be the median of the following series? 2, 5, 3, 4, 8, 10, 12
(a) 4
(b) 5
(c) 8
(d) 10
Answer : B
Question. Refer to the data given in question no. 55, what will be the value of Q3?
(a) 10
(b) 10.50
(c) 0.75
(d) 11
Answer : C
Question. Choose the correct statement about median.
(a) Highest value of lowest 25%of the items
(b) Lowest value of highest 25%of the items
(c) Highest value of lowest 50%of the items
(d) All of the above statements are false
Answer : C
Question. Refer to the data given in question no. 55, what will be the value of Q1?
(a) 0.25
(b) 4.25
(c) 5.75
(d) 8.25
Answer : A
Question. The mean of a given items 5, 6, 7, X, 11 and 13 is 44. Value of X will be
(a) 200
(b) 222
(c) 224
(d) 254
Answer : B
Question. Choose the incorrect statement.
(a) Mode cannot be calculated in open-ended distributions
(b) Median is affected by change in extreme values
(c) Median is not affected by fluctuations in sampling
(d) All of the above is incorrect
Answer : D
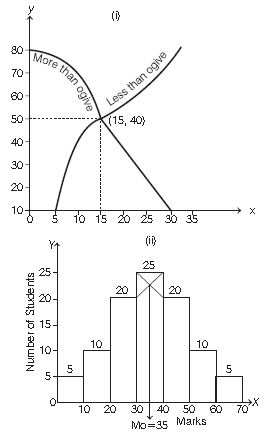
Direction Analyse the following case study graphs and answer questions 96 to 100 on the basis of the same.
Question. What will be the mean value in case 1?
(a) 10
(b) 15
(c) 25
(d) None of the above
Answer : D
Question. Which form of graphical presentation is used to locate mode?
(a) Histogram
(b) Bar graphs
(c) Cumulativecurves
(d) Arithmeticlinegraphs
Answer : A
Question. Median can be located graphically using which of the following?
(a) Less than ogive
(b) More than ogive
(c) Both less than ogive and more than ogive together
(d) All of the above
Answer : D
Question. According to figure two, the approximate value of mode is equal to ……… .
(a) 25
(b) 35
(c) 45
(d) Can’t be determined
Answer : B
Question. According to figure one, value of median is equal to ………… .
(a) 15
(b) 20
(c) 30
(d) 40
Answer : A
Question. Which diagram is used for finding the value of mode graphically?
Answer : Histogram.
Question. Give the meaning of arithmetic average.
Answer : When the sum of all items is divided by their number is known as arithmetic average.
Question. What are the types of mean?.
Answer : There are two types of mean simple and weighted.
Question. What is the sum of deviations taken from mean in a series.
Answer : Zero.
Question. Give the meaning of combined mean.
Answer : When the mean of two or more than two series is computed collectively, it is known as combined mean.
Question. What is the relation among the mean, median and mode?
Answer : Mode = 3 median 2 mean
Question. How is the value of median computed with the help of give curves?.
Answer : The point of intersection where ‘less than’ give curve and ‘more than’ give curve intersect each other gives us the value of median.
Question. If the values of mean and median are 40 and 48. Find out the most probable value of mod.
Answer : Mode = 3 median 2 mean
= (3x 48) (2 x 40) = 144 80
= 64
1 mark question to be answered in one word/one sentence
Q1. Define an average .
Q2. What is meant by ‘Central Tendency’?
Q3. State two function of an average.
Q4. Name three measures of central tendency.
Q5. Give for formula Weight Arithmetic Mean.
Q6. What is Arithmetic Mean.
Q7. Name two types of arithmetic mean.
Q8. What is median?
Q9. What are quartiles?
Q10. What are percentiles?
Q11. What are partition Values?
Q12. What is mode?
Q13. Give the formula for finding the median in case of continuous series..
Q14. Give the formula for finding mode of a continuous series.
Free study material for Economics
CBSE Economics Class 11 Statistics for Economics Chapter 5 Measures of Central Tendency Worksheet
Students can use the practice questions and answers provided above for Statistics for Economics Chapter 5 Measures of Central Tendency to prepare for their upcoming school tests. This resource is designed by expert teachers as per the latest 2026 syllabus released by CBSE for Class 11. We suggest that Class 11 students solve these questions daily for a strong foundation in Economics.
Statistics for Economics Chapter 5 Measures of Central Tendency Solutions & NCERT Alignment
Our expert teachers have referred to the latest NCERT book for Class 11 Economics to create these exercises. After solving the questions you should compare your answers with our detailed solutions as they have been designed by expert teachers. You will understand the correct way to write answers for the CBSE exams. You can also see above MCQ questions for Economics to cover every important topic in the chapter.
Class 11 Exam Preparation Strategy
Regular practice of this Class 11 Economics study material helps you to be familiar with the most regularly asked exam topics. If you find any topic in Statistics for Economics Chapter 5 Measures of Central Tendency difficult then you can refer to our NCERT solutions for Class 11 Economics. All revision sheets and printable assignments on studiestoday.com are free and updated to help students get better scores in their school examinations.
FAQs
You can download the latest chapter-wise printable worksheets for Class 11 Economics Statistics for Economics Chapter 5 Measures of Central Tendency for free from StudiesToday.com. These have been made as per the latest CBSE curriculum for this academic year.
Yes, Class 11 Economics worksheets for Statistics for Economics Chapter 5 Measures of Central Tendency focus on activity-based learning and also competency-style questions. This helps students to apply theoretical knowledge to practical scenarios.
Yes, we have provided solved worksheets for Class 11 Economics Statistics for Economics Chapter 5 Measures of Central Tendency to help students verify their answers instantly.
Yes, our Class 11 Economics test sheets are mobile-friendly PDFs and can be printed by teachers for classroom.
For Statistics for Economics Chapter 5 Measures of Central Tendency, regular practice with our worksheets will improve question-handling speed and help students understand all technical terms and diagrams.