
Refer to CBSE Class 10 Mathematics Statistics MCQs Set A provided below available for download in Pdf. The MCQ Questions for Class 10 Mathematics with answers are aligned as per the latest syllabus and exam pattern suggested by CBSE, NCERT and KVS. Chapter 13 Statistics Class 10 MCQ are an important part of exams for Class 10 Mathematics and if practiced properly can help you to improve your understanding and get higher marks. Refer to more Chapter-wise MCQs for CBSE Class 10 Mathematics and also download more latest study material for all subjects
MCQ for Class 10 Mathematics Chapter 13 Statistics
Class 10 Mathematics students should refer to the following multiple-choice questions with answers for Chapter 13 Statistics in Class 10.
Chapter 13 Statistics MCQ Questions Class 10 Mathematics with Answers
Question. If the value of mean and mode are respectively 30 and 15, then Median =
(a) 22.5
(b) 24.5
(c) 25
(d) 26
Answer : C
Question. If the arithmetic Mean of x, x + 3, x + 6, x + 9 and x + 12 is 10, then x =?
(A) 1
(B) 2
(C) 6
(D) 4
Answer : D
Question. In the formula x = a + h(fiui/fi), for finding the mean of grouped frequency distribution, ui =
(a) (xi+a)/h
(b) h (xi – a)
(c) (xi –a)/h
(d) (a – xi)/h
Answer : C
Question. If mean of the distribution is 7.5, then p=
X 3 5 7 9 11 13
F 6 8 15 P 8 4
(a) 2
(b) 4
(c) 3
(d) 6
Answer : C
Question. The median of the data 13, 15, 16, 17, 19, 20 is:
(a) 30/2
(b) 31/2
(c) 33/2
(d) 35/2
Answer : C
Question : The algebraic sum of the deviations of a frequency distribution from its mean is
a) 0
b) a non-zero number
c) always negative
d) always positive
Answer : 0
Question : The mode of a frequency distribution can be determined graphically from
a) Histogram
b) Frequency polygon
c) Frequency curve
d) Ogive
Answer : A
Question : The median of a given frequency distribution is found graphically with the help of
a) Ogive
b) Bar graph
c) Frequency polygon
d) Histogram
Answer : A
Question : If the mean of the following distribution is 2.6, then the value of k is

a) 4
b) 2
c) 5
d) 3
Answer : 4
Question :

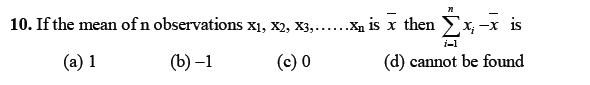
a) 0
b) 1
c) –1
d) 2
Answer : 0
Question :

a) mid-points of the classes
b) lower limits of the classes
c) upper limits of the classes
d) frequencies of the class marks
Answer : A
Question : While computing mean of a grouped data, we assume that the frequencies are
a) centered at the class marks of the classes
b) centered at the lower limits of the classes
c) centered at the upper limits of the classes
d) evenly distributed over all the classes
Answer : centered at the class marks of the classes
Question : The graphical representation of a cumulative frequency distribution is called
a) an Ogive
b) Frequency polygon
c) Histogram
d) Bar graph
Answer : an Ogive
Question : Construction of a cumulative frequency table is useful in determining the
a) median
b) mode
c) all of the above
d) mean
Answer : median
Question :

a) 0
b) –1
c) 1
d) 2
Answer : 0
Question :

a) frequency of the class succeeding the modal class
b) frequency of the class preceding the modal class
c) frequency of the second class
d) frequency of the modal class
Answer : frequency of the class succeeding the modal class
Question : The class marks of the class 18–22 is
a) 20
b) 22
c) 18
d) 4
Answer : 20
Question :

a) 0
b) –1
c) 1
d) 2
Answer : 0
Question : The abscissa of the point of intersection of the less than type and of the more than type cumulative frequency curves of a grouped data gives its
a) median
b) mean
c) mode
d) all of these
Answer : median
Question :

a) 6
b) 8
c) 4
d) 3
Answer : 6
Question : The runs scored by a batsman in 35 different matches are given below

The number of matches in which the batsman scored less than 60 runs are
a) 24
b) 8
c) 19
d) 16
Answer : 24
Question : Consider the following frequency distribution:

The difference of the upper limit of the median class and the lower limit of the modal class is
a) 15
b) 10
c) 5
d) 0
Answer : 15
Question : For the following distribution

The sum of upper limits of the median class and modal class is
a) 32
b) 16
c) 40
d) 24
Answer : 32
Question : For the following distribution

the sum of lower limits of the median class and modal class is
a) 25
b) 30
c) 15
d) 5
Answer : 25
Question : Consider the data

The difference of the upper limit of the median class and the lower limit of the modal class is
a) 20
b) 19
c) 21
d) 0
Answer : 20
Question : The heights (in cm) of 100 students of a class is given in the following distribution

The number of students having height less than 165 cm is
a) 75
b) 59
c) 16
d) 28
Answer : 75
Question : The mean of squares of first five natural numbers is-
a) 25
b) 11
c) 25
d) 11/5
Answer : 11
Question : If median = (mode + 2 mean) K, then K is equal to -
a) 3
b) 1/3
c) 2
d) none of these
Answer : 1/3
Question : In an arranged discrete series in which total numbers of observation 'n' is even, then its median is -
a) n/2 th term
b) n/2+ 1th term
c) the mean of n/2th and n/2+ 1th term
d) none of these
Answer : the mean of n/2th and n/2+ 1th term
Question : If α variable takes the discrete values : α + 4, α -7/2 ,α -5/2 , α–3, α– 2, α +1/2 , α -1/2 , α+ 5, (α> 0) then the median is -
a) α -5/4
b) α -1/2
c) α – 2
d) α +5/4
Answer : α -5/4
Question : For the given data mean and mode are 24, 21 then the median is -
a) 22
b) 23
c) 24
d) 21
Answer :23
Question : If the mode of the following data 4, 3, 2, 5, p, 4, 5, 1, 7, 3, 2, 1 is 3, then value of p is -
a) 4
b) 3
c) 2
d) 11
Answer : 3
Question : The curve drawn by taking upper limits along x-axis and cumulative frequency along y-axis is :
a) frequency polygon
b) more than ogive
c) less than ogive
d) none of these
Question : For ‘more than ogive’ the x-axis represents :
a) upper limits of class-intervals
b) mid-values of class-intervals
c) lower limits of class-intervals
d) frequency
Answer : lower limits of class-intervals
Question : Ogive is the graph of :
a) lower limits and frequency
b) upper limits and frequency
c) lower/upper limits and cumulative frequency
d) none of these
Answer : lower/upper limits and cumulative frequency
Question : If mean of 4, 6, 8, 10, x, 14, 16 is 10 then, the value of x is:
(a) 11
(b) 12
(c) 13
(d) 9
Answer : B
(b) x+4
(c) 3
(d) x+3
Answer : D
(b) 10
(c) 20
(d) 9.5
Answer : A
(b) 1
(c) 3
(d) 2
(b) 0
(c) 2
(d) 1
(b) 3
(c) 2
(d) 5
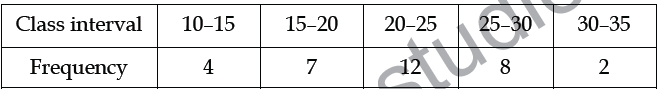
(a) 30–35
(b) 20–25
(c) 25–30
(d) 15–20
Answer : B
(b) Mode
(c) Median
(d) Sum
Answer : A
(b) 55
(c) 54
(d) None of these
Answer : A
(b) 6
(c) 10
(d) None of these
Answer : D
(b) 14
(c) 19
(d) 20
Answer : A
(b) Median – A.M. = Mode
(d) 3(Median) – 2(A.M.) = Mode
Answer : D
(b) 17
(c) 14
(d) 13
Answer : A
(b) 50
(c) 60
(d) 100
Answer : B
(b) 47.67kg
(c) 48.67kg
(d) 49.67kg
Answer : D
(b) Mode
(c) Median
(d) None of these
Answer : C
(b) 21
(c) 24
(d) None of these
Answer : A
(b) 24
(c) 25
(d) 26
Answer : D
(b) 5.6
(c) 5.7
(d) 5
Answer : B
(b) 1
(c) 2
(d) 3
Answer : A
(b) 11
(c) 12
(d) 13
Answer : D
(b) 57.5
(c) 58.7
(d) None of these
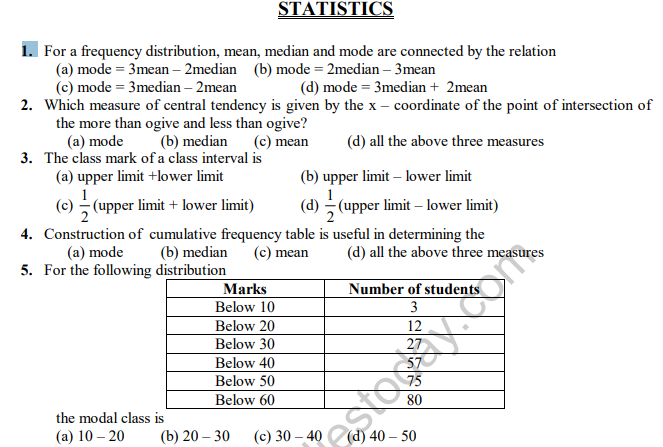
Question. The median class of the following distribution is 
(a) 10 – 20
(b) 20 – 30
(c) 30 – 40
(d) 40 – 50
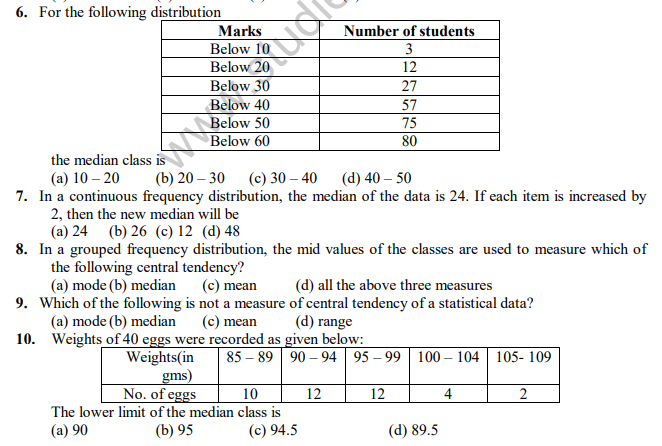
Question. Weights of 40 eggs were recorded as given below: ![]()
The lower limit of the modal class is
(a) 90
(b) 95
(c) 94.5
(d) 89.5
Question. The arithmetic mean of 12 observations is 7.5. If the arithmetic mean of 7 of these observations is 6.5, the mean of the remaining observations is
(a) 5.5
(b) 8.5
(c) 8.9
(d) 9.2
Question. In a continuous frequency distribution, the mean of the data is 25. If each item is increased by 5, then the new median will be
(a) 25
(b) 30
(c) 20
(d) none of these
Question. In a continuous frequency distribution with usual notations, if l = 32.5, f1 = 15, f0 = 12, f2 = 8 and h = 8, then the mode of the data is
(a) 32.5
(b) 33.5
(c) 33.9
(d) 34.9
Question. Construction of cumulative frequency table is useful in determining the
(a) mean
(b) median
(c) mode
(d) all three
Question. 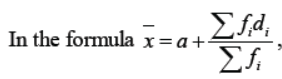
finding the mean of the grouped data, di’s are deviations from assumed mean ‘a’ of
(a) lower limits of classes
(b) upper limits of classes
(c) class marks
(d) frequencies of the classes.
Question. If xi’s are the midpoints of the class intervals of grouped data, fi’s are the corresponding frequencies and x is the mean, then ![]()
(a) 0
(b) –1
(c) 1
(d) 2
Question. 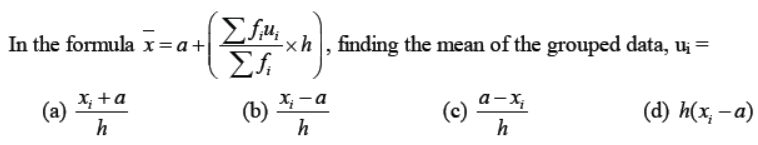
Question. For the following distribution: 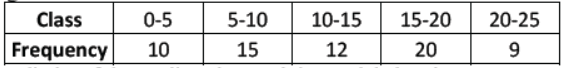
The sum of lower limits of the median class and the modal class is
(a) 15
(b) 25
(c) 30
(d) 35
Question. Consider the following frequency distribution: ![]()
The upper limit of the median class is
(a) 29
(b) 29.5
(c) 30
(d) 19.5
Question. The abscissa of the point of intersection of the less than type and of the more than type ogives gives its
(a) mean
(b) median
(c) mode
(d) all three
Question. For the following distribution: the modal class is 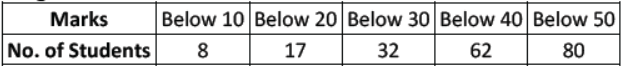
(a) 10 – 20
(b) 20 – 30
(c) 30 – 40
(d) 40 – 50
Question. From the following data of the marks obtained by students of class X 
How many students, secured less than 40 marks?
(a) 70
(b) 40
(c) 80
(d) 30
Question. The times in seconds taken by 150 athletics to run a 100m hurdle race are given as under: 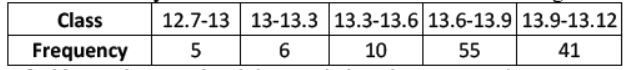
The number of athletes who completed the race in less than 13.9 sec is
(a) 21
(b) 55
(c) 41
(d) 76
Question. Consider the data: ![]()
The difference of the upper limit of the median class and the lower limit of the modal class is
(a) 0
(b) 19
(c) 20
(d) 38
Question. Consider the following distribution: 
The frequency of the class 30 – 40 is
(a) 3
(b) 4
(c) 48
(d) 41
Question : The range of the data 14, 27, 29, 61, 45, 15, 9, 18 is
(a) 61
(b) 52
(c) 47
(d) 53
Question : The class mark of the class 120 – 150 is
(a) 120
(b) 130
(c) 135
(d) 150
Question : The class mark of a class is 10 and its class width is 6. The lower limit of the class is
(a) 5
(b) 7
(c) 8
(d) 10
Question : In a frequency distribution, the class width is 4 and the lower limit of first class is 10. If there are six classes, the upper limit of last class is
(a) 22
(b) 26
(c) 30
(d) 34
Question : The class marks of a distribution are 15, 20, 25, ____ 45. The class corresponding to 45 is
(a) 12.5 – 17.5
(b) 22.5 – 27.5
(c) 42.5 – 47.5
(d) none of these
Question : The number of students in which two classes are equal.
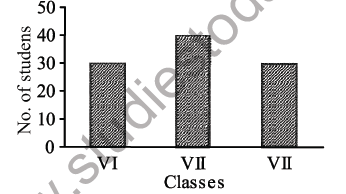
(a) VI and VIII
(b) VI and VII
(c) VII and VIII
(d) none of these
Question : The mean of first five prime numbers is
(a) 5.0
(b) 4.5
(c) 5.6
(d) 6.5
Question : The mean of first ten multiples of 7 is
(a) 35.0
(b) 36.5
(c) 38.5
(d) 39.2
Question : The mean of x + 3, x – 2, x + 5, x + 7 and x + 72 is
(a) x + 5
(b) x + 2
(c) x + 3
(d) x + 7
Question : The mean of 10 observations is 42. If each observation in the data is decreased by 12, the new mean of the data is
(a) 12
(b) 15
(c) 30
(d) 54
Question : The median of 10, 12, 14, 16, 18, 20 is
(a) 12
(b) 14
(c) 15
(d) 16
Question : If the median of 12, 13, 16, x + 2, x + 4, 28, 30, 32 is 23, when x + 2, x + 4 lie between 16 and 30, then the value of x is
(a) 18
(b) 19
(c) 20
(d) 22
Question : If the mode of 12, 16, 19, 16, x, 12, 16, 19, 12 is 16, then the value of x is
(a) 12
(b) 16
(c) 19
(d) 18
Question : The mean of the following data is
![]()
(a) 12
(b) 13
(c) 13.5
(d) 13.6
Question : The mean of 10 numbers is 15 and that of another 20 number is 24 then the mean of all 30 observations is
(a) 20
(b) 15
(c) 21
(d) 24
(b) 6
(c) 5.5
(d) 6.5
Question. The arithmetic mean of the following frequency distribution is 25, then the value of p is ![]()
(a) 12
(b) 16
(c) 18
(d) 20
Question. If the mean of the following frequency distribution is 54, then the value of p is ![]()
(a) 12
(b) 16
(c) 18
(d) 11
Question. The mean of the following frequency distribution is ![]()
(a) 12
(b) 16
(c) 22
(d) 20
Question. The mean of the following frequency distribution is ![]()
(a) 12.2
(b) 16.2
(c) 22.2
(d) 27.2
Question. The median of the following frequency distribution is ![]()
(a) 120
(b) 160
(c) 220
(d) 270
| CBSE Class 10 Mathematics Application of Trigonometry MCQs Set A |
| CBSE Class 10 Mathematics Application of Trigonometry MCQs Set B |
| CBSE Class 10 Mathematics Circles MCQs Set A |
| CBSE Class 10 Mathematics Circles MCQs Set B |
| CBSE Class 10 Mathematics Circles MCQs Set C |
| CBSE Class 10 Mathematics Circles MCQs Set D |
| CBSE Class 10 Mathematics Statistics MCQs Set A |
| CBSE Class 10 Mathematics Statistics MCQs Set B |
| CBSE Class 10 Mathematics Statistics MCQs Set C |
| CBSE Class 10 Mathematics MCQs |
| CBSE Class 10 Mathematics Mensuration MCQs |
MCQs for Chapter 13 Statistics Mathematics Class 10
Expert teachers of studiestoday have referred to NCERT book for Class 10 Mathematics to develop the Mathematics Class 10 MCQs. If you download MCQs with answers for the above chapter you will get higher and better marks in Class 10 test and exams in the current year as you will be able to have stronger understanding of all concepts. Daily Multiple Choice Questions practice of Mathematics will help students to have stronger understanding of all concepts and also make them expert on all critical topics. After solving the questions given in the MCQs which have been developed as per latest books also refer to the NCERT solutions for Class 10 Mathematics. We have also provided lot of MCQ questions for Class 10 Mathematics so that you can solve questions relating to all topics given in each chapter. After solving these you should also refer to Class 10 Mathematics MCQ Test for the same chapter.
You can download the CBSE MCQs for Class 10 Mathematics Chapter 13 Statistics for latest session from StudiesToday.com
Yes, the MCQs issued by CBSE for Class 10 Mathematics Chapter 13 Statistics have been made available here for latest academic session
You can find CBSE Class 10 Mathematics Chapter 13 Statistics MCQs on educational websites like studiestoday.com, online tutoring platforms, and in sample question papers provided on this website.
To prepare for Chapter 13 Statistics MCQs, refer to the concepts links provided by our teachers and download sample papers for free.
Yes, there are many online resources that we have provided on studiestoday.com available such as practice worksheets, question papers, and online tests for learning MCQs for Class 10 Mathematics Chapter 13 Statistics