CBSE Class 9 Social Science Poverty As a Challenge Notes

Download CBSE Class 9 Social Science Poverty As a Challenge Notes in PDF format. All Revision notes for Class 9 Social Science have been designed as per the latest syllabus and updated chapters given in your textbook for Social Science in Class 9. Our teachers have designed these concept notes for the benefit of Class 9 students. You should use these chapter wise notes for revision on daily basis. These study notes can also be used for learning each chapter and its important and difficult topics or revision just before your exams to help you get better scores in upcoming examinations, You can also use Printable notes for Class 9 Social Science for faster revision of difficult topics and get higher rank. After reading these notes also refer to MCQ questions for Class 9 Social Science given on studiestoday

Revision Notes for Class 9 Social Science Chapter 3 Poverty as a Challenge

Class 9 Social Science students should refer to the following concepts and notes for Chapter 3 Poverty as a Challenge in Class 9. These exam notes for Class 9 Social Science will be very useful for upcoming class tests and examinations and help you to score good marks

Chapter 3 Poverty as a Challenge Notes Class 9 Social Science

POVERTY AS A CHALLENGE
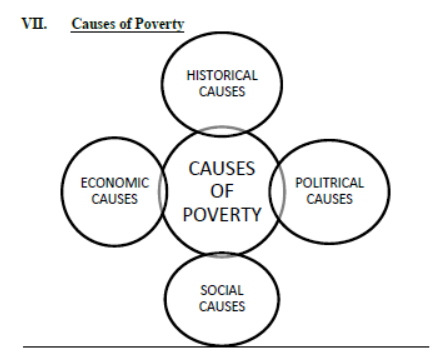
INTRODUCTION
In our daily life, we come across many people who we think are poor. They could be landless labourers in villages or people living in overcrowded jhuggis in cities. They could be daily wage workers at construction sites or child workers in dhabas. They could also be beggars with children in tatters. We see poverty all around us. In fact, every fourth person in India is poor. This means, roughly 260 million (or 26 crore) people in India live in poverty. This also means that India has the largest single concentration of the poor in the world.
 
The following issues related to poverty are:-
• Landlessness                   • Unemployment
• Size of families                • Illiteracy
• Poor health/malnutrition   • Child labour
• Helplessness
Poverty means hunger and lack of shelter. It also is a situation in which parents are not able to send their children to school or a situation where sick people cannot afford treatment. Poverty also means lack of clean water and sanitation facilities. It also means lack of a regular job at a minimum decent level. Above all it means living with a sense of helplessness. Poor people are in a situation in which they are ill-treated at almost every place, in farms, factories, government offices, hospitals, railway stations
etc. Obviously, nobody would like to live in poverty.
One of the biggest challenges of independent India has been to bring millions of its people out of abject poverty. Mahatama Gandhi always insisted that India would be truly independent only when the poorest of its people become free of human suffering.
India has the largest single concentration of the poor in the world. This illustrates the seriousness of the challenge. Poverty means hunger and lack of shelter. It is also a situation in which parents are not able to send their children to school or a situation where sick people cannot afford treatment. Poverty also means lack of clean water and sanitation facilities. It also means lack of a regular job at a minimum decent level. Above all it means living with a sense of helplessness. Poor are in a situation in which they are ill-treated at almost every place, in farm, factories, government offices, hospitals, railway stations etc. Obviously nobody would like to live in poverty.
 
POVERTY AS SEEN BY SOCIAL SCIENTISTS
Since poverty has many facets, social scientists look at it through a variety of indicators. Usually the indicators used relate to the levels of income and consumption. But now poverty is looked through other social indicators like illiteracy level, lack of general resistance due to malnutrition, lack of access to healthcare, lack of job opportunities, lack of access to safe drinking water, sanitation etc. Analysis of poverty based on social exclusion and vulnerability is now becoming very common.
 
1. Social Exclusion: According to this concept, poverty must be seen in terms of the poor having to live only in a poor surrounding with other poor people, excluded from enjoying social equality of better -off people in better surroundings. Social exclusion can be both a cause as well as a consequence of poverty in the usual sense. Broadly, it is a process through which individuals or groups are excluded from facilities, benefits and opportunities that others (their “betters”) enjoy. A typical example is the
working of the caste system in India in which people belonging to certain castes are excluded from equal opportunities. Social exclusion thus may lead to, but can cause more damage than, having a very low income.
 
2. Vulnerability: Vulnerability to poverty is a measure, which describes the greater probability of certain communities (say, members of a backward caste) or individuals (such as a widow or a physically handicapped person) of becoming, or remaining, poor in the coming years. Vulnerability is determined by the options available to different communities for finding an alternative living in terms of assets, education, health and job opportunities. Further, it is analysed on the basis of the greater risks these groups face at the time of natural disasters (earthquakes, tsunami), terrorism etc. Additional analysis is made of their social and economic ability to handle these risks. In fact, vulnerability describes the greater probability of being more adversely affected than other people when bad time comes for everybody, whether a flood or an earthquake or simply a fall in the availability of jobs!
Usually the indicators used to work out poverty, relate to the levelly of income and consumption. But now poverty is looked through other social
Indicators like illiteracy level, lack of general resistance due to malnutrition, lack to access to healthcare, lack of job opportunities, lack of access to safe drinking water, sanitation etc. Analysis of poverty based on social exclusion and vulnerability is now becoming very common.
(i) Social Exclusion: is a process through which individuals or groups are prevented from using facilities, benefits and opportunities that the better-off section of the society enjoy . Social exclusion can be both a cause and a consequence of poverty.
(ii) vulnerability : vulnerability describes the greater probability of being more adversely affected then other-people when bad time comes for everybody, whether a flood or an earthquake or simply a fall in the availability of jobs.
 
POVERTY LINE
A common method used to measure poverty is based on the income or consumption levels. A person is considered poor if his or her income or consumption level falls below a given “minimum level” necessary to fulfill basic needs.
Each country uses an imaginary line that is considered appropriate for its existing level of development and its accepted minimum social norms.
While determining the poverty line in India, a minimum level of food requirement, clothing, footwear, fuel and light, educational and medical requirement etc. are determined for subsistence. These physical quantities are multiplied by their prices in rupees. The present formula for food requirement while estimating the poverty line is based on the desired calorie requirement. Food items such as cereals, pulses, vegetable, milk, oil, sugar etc. together provide these needed calories. The calorie needs vary depending on age, sex and the type of work that a person does. The accepted average calorie requirement in India is 2400 calories per person per day in rural areas and 2100 calories per person per day in urban areas. Since people living in rural areas engage themselves in more physical work, calorie requirements in rural areas are considered to be higher than urban areas.
In this way in the year 2000, a family of five members living in rural areas and earning less than about Rs 1,640 per month will be below the poverty line. A similar family in the urban areas would need a minimum of Rs 2,270 per month to meet their basic requirements. The poverty line is estimated periodically (normally every five years) by conducting sample surveys. These surveys are carried out by the National Sample Survey Organisation (NSSO). However, for making comparisons between developing countries, many international organisations like the World Bank use a uniform standard for the poverty line: minimum availability of the equivalent of $1 per person per day.
A common method used to measure poverty is based on the income or consumption levels. A person is considered poor if his or her income or consumption level falls below a given “minimum level” necessary to fulfil basic needs. Poverty line may very with time and place. Each country uses an imaginary line that is considered appropriate for its existing level of development and its accepted minimum social norms. While determining the poverty line in India, a minimum level of food requirement, clothing, footwear, fuel and light, education and medical requirement to. Are determined for subsistence. there physical quantities are multiplied by their prices in rupees. The total equivalent is considered as poverty line. Daily minimum nutritional requirement for a person has been fixed at 2400 calories per person/ per day in rural areas and 2400 calories per person/per day in urban areas. The monetary expenditure per capital needed for buying these calorie requirements in terms of food grains etc. is revised periodically taking into consideration the rise in prices. On the basis of these calculations, for the year 2000, the poverty line for a person was fixed at Rs. 328 per month in rural areas and rs.454 per month in urban areas. In this way in the year 2000, a family of live members living in rural areas and reaming less then about Rs. 1640 per month will be below the poverty line. a similar family in the urban areas would need a minimum of rs.2270 per month to meet their basic requirements.
For making comparisons between developing countries, many international organizations like the World Bank use a uniform standard for the poverty line: minimum availability of the equivalent of $ 1 per person per day.
 
POVERTY ESTIMATES
There is substantial decline in poverty ratios in India from about 55 per cent in 1973 to 36 per cent in 1993. The proportion of people below poverty line further came down to about 26 per cent in 2000. If the trend continues people below poverty line may come down to less than 20 per cent in the next few years. The latest estimates indicate a significant reduction in the number of poor to about 260 million.
CBSE Class 9 Social Science Poverty As a Challenge Notes Set A

VULNERABLE GROUPS
The proportion of people below poverty line is also not same for all social groups and economic categories in India.
(i) Social groups which are most vulnerable to poverty are scheduled caste and scheduled tribe households.
(ii) Among the economic groups, the most vulnerable groups are the rural agricultural labour households and the urban casual labour households.
(iii) Although the average of people below poverty line for all groups in India is 26, 51 out of 100 people belonging to scheduled tribes are not able to meet their basic needs. Similarly, 50 percent of causal workers in urban areas are below poverty line. About 50 percent of landless agricultural workers and 43 percent of scheduled castes are also poor.
(iv)The double disadvantage, of being a landless casual wage labour household in the socially disadvantaged social groups of the scheduled caste or the scheduled tribe population highlights the seriousness of the problem.
(v) Some recent studies have shown that except for the scheduled tribe households, all the other three groups i.e., scheduled castes, rural agricultural labourers and the urban casual labour households have seen a decline in poverty in the 1990s.
(vi)Women, elderly people and female infants are systematically denied equal access to resources available to the family. Therefore women, children (especially the girl child) and old people are poorest of the poor.
CBSE Class 9 Social Science Poverty As a Challenge Notes Set A

INTER-STATE DISPARITIES
 
There has been significant decline in poverty since independence. In 1960-61 more than 34% population of the country was living below poverty line which has declined to 26% in 2000-01. Although there has been reduction in poverty, the success rate of reducing poverty varies from state to state.
(i) States with poverty ratio more then the nation average: Orissa, Bihar, Assam, Tripura and Uttar Pradesh are the most poverty ridden states of India. The poverty ration in these states is much higher then the national average .Orissa and Bihar are the poorest states with poverty ratio of 47 and 43 respectively. Most of these states are facing rural as well as urban poverty.
(ii) States with poverty ratio less then the national average: recent studies show that in 20 states and Union Territories, the poverty ratio is less then the national average. There has been a significant decline in poverty ratio in Kerala, Andhra Pradesh, Tamil Nadu, Gujarat and West Bengal.
(iii) States with poverty ratio: states like Panjab, Haryana, Goa, Himachal Pradesh and Jammu Kashmir have very low percentage of population living below poverty line. 
 
1. States with poverty ratio more than the national average: Orissa, Bihar, Assam, Tripura and Uttar Pradesh are the most poverty ridden states of India. The poverty ratio in these states is much higher than the national average. Orissa and Bihar are the poorest states with poverty ratio of 47 and 43 respectively. Most of these states are facing rural as well as urban poverty.
2. States with poverty ratio less than the national average: Recent studies show that in 20 states and Union Territories, the poverty ratio is less than the national average. There has been a significant decline in poverty ratio in Kerala, Andhra Pradesh, Tamil Nadu, Gujarat and West Bengal.
3. States with low poverty ratio: States like Punjab, Haryana, Goa, Himachal Pradesh and Jammu & Kashmir have very low percentage of population living below poverty line.
 
GLOBAL POVERTY SCHENARIO
1. The proportion of people in developing countries living in extreme economic poverty— defined by the World Bank as living on less than $1 per day—has fallen from 28 per cent in 1990 to 21 per cent in 2001. Although there has been a substantial reduction in global poverty, it is marked with great regional differences.
2. Poverty declined substantially in China and Southeast Asian countries as a result of rapid economic growth and massive investments in human resource development. Number of poors in China has come down from 606 million in 1981 to 212 million in 2001.
3. In the countries of South Asia (India, Pakistan, Sri Lanka, Nepal, Bangladesh, Bhutan) the decline has not been as rapid. Despite decline in the percentage of the poor, the number of poor has declined marginally from 475 million in 1981 to 428 million in 2001. Because of different poverty line definition, poverty in India is also shown higher than the national estimates.
4. In Sub-Saharan Africa, poverty in fact rose from 41 per cent in 1981 to 46 per cent in 2001.
5. In Latin America, the ratio of poverty remained the same.
6. The Millennium Development Goals of the United Nations calls for reducing the proportion of people living on less than $1 a day to half the 1990 level by 2015.
CBSE Class 9 Social Science Poverty As a Challenge Notes Set A

CAUSES OF POVERTY

There were a number of causes for the widespread poverty in India. One historical reason is the low level of economic development under the British colonial administration. The policies of the colonial government ruined traditional handicrafts and discouraged development of industries like textiles. The low rate of growth persisted until the 1980s. This resulted in less job opportunities and low growth rate of incomes. This was accompanied by a high growth rate of population. The two combined to make the growth rate of per capita income very low. The failure at both the fronts: promotion of economic growth and population control perpetuated the cycle of poverty.

The industries, both in the public and the private sector, did provide some jobs. But these were not enough to absorb all the job seekers. Unable to find proper jobs in cities, many people started working as rickshaw pullers, vendors, construction workers, domestic servants etc. With irregular small incomes, these people could not afford expensive housing. They started living in slums on the outskirts of the cities and the problems of poverty, largely a rural phenomenon also became the feature of the urban sector.

One of the major reasons for high Income inequalities is the unequal distribution of land and other resources. Despite many policies, we have not been able to tackle the issue in a meaningful manner. Major policy initiatives like land reforms which aimed at redistribution of assets in rural areas have not been implemented properly and effectively by most of the state governments. Since lack of land resources has been one of the major causes of poverty in India, proper implementation of policy could have improved the life of millions of rural poor.

Many other socio-cultural and economic factors also are responsible for poverty. In order to fulfil social obligations and observe religious ceremonies, people in India, including the very poor, spend a lot of money. Small farmers need money to buy agricultural inputs like seeds, fertilizer, pesticides etc. Since poor people hardly have any savings, they borrow. Unable to repay because of poverty, they become victims of indebtedness. So the high level of indebtedness is both the cause and effect of poverty.

(i) BRITISH Rule: Britishers ruled India for more then 100 years. Prior to the British rule, traditional Industries, for instance, textiles, were flourishing in India. During the British rule, they adopted policies to discourage such industries. This left millions of weavers poor.

(ii) Rural Economy: Indian economy is predominantly rural economy. As such, the major production is of primary goods. In India, 70% of the total population is engaged in agriculture but its contribution to the national income is only one-third. It means that despite India being predominantly an agricultural country, it is very much backward in agriculture.

(iii) Heavy Pressure of Population: population in India has increasing very rapidly. Main factors accounting for it is sharp tall in death rate but stable birth rate for the many decades. This pressure of population serves as a big stumbling block to economic development.

(iv) Chronic Unemployment and Under- employment: with constant increase in population there has developed a situation of chronic unemployment and underemployment. Due to increasing pressure on land, per hectare availability of land is decreasing. Due to division of land, production is decreasing. Agriculture sector is also facing problem of disguised unemployment.

(v) Lack of Proper Industrialisation: India is very backward from the industrial point of view. Hardly 3 percent of working population is engaged in large scale industries. Consumers’ goods industries like soap, cloth, sugar, leather, oil etc. have developed to a large extent but capital and producers’ goods industries have not yet developed properly.

(vi) Social factors: social factors like illiteracy, large size of family, law of inheritance, and caste system are also responsible for prevalence of poverty ridden people.

ANTI POVERTY MEASURES

The current anti-poverty strategy of the government is based broadly on two points: (1) Promotion of economic growth (2) Targeted anti-poverty programmes.

1. Promotion of Economic Growth:
(i) Since the eighties, India’s economic growth has been one of the fastest in the world. The growth rate jumped from the average of about 3.5 per cent a year in the 1970s to about 6 per cent during the 1980s and 1990s. The higher growth rates have helped significantly in the reduction of poverty. It is becoming clear that there is a strong link between economic growth and poverty reduction.
(ii) Economic growth widens opportunities and provides the resources needed to invest in human development. This also encourages people to send their children, including the girl child, to schools in the hope of getting better economic returns from investing in education.

2. Targeted Anti-Poverty Programmes:

National Rural Employment Guarantee Scheme (NREGA) 2005:
(i) It was passed in September 2005. This Act provides for 100 days assured employment every year to every rural household in 200 districts. Later the scheme will be extended to 600 districts.
(ii) One-third of the proposed jobs will be reserved for women.
(iii) The Central Government will establish National Employment Guarantee Funds.
(iv)State governments will establish State Employment Guarantee Funds for implementation of the scheme.
(v) Under the programme if an applicant is not provided employment within fifteen days, she/he will be entitled to a daily unemployment allowance.

National Food for Work Programme (NFWP):
(i) It was launched in 2004 in 150 most backward districts of the country.
(ii) The programme is open to all rural poor who are in need of wage employment and desire to do manual unskilled work.
(iii) It is implemented as a 100 percent centrally sponsored shceme and food grains are provided free of cost to the states.

Prime Minister Rozgar Yozana (PMRY):
(i) It is another scheme which was started in 1993.
(ii) The aim of the programme is to create self-employment opportunities for educated unemployment youth in rural areas and small towns.
(iii) They are helped in setting up small business and industries.

Rural Employment Generation Programme (REGP): It was launched in 1995. The aim of the programme is to create self-employment opportunities in rural areas and small towns. A target for creating 25 lakh new jobs has been set for the programme under the Tenth Five Year Plan.

Swarnjayanti Gram Swarojgar Yojana (SGSY): It was launched in 1999. The programme aims at bringing the assisted poor families above the poverty line by organizing them into self help groups through a mix of bank credit and government subsidy.

Pradhan Mantri Gramodaya Yozana (PMGY):
(i) It was launched in 2000.
(ii) Additional central assitance is given to states for basic services such as primary health, primary education, rural shelter, rural drinking water and rural electrification.

Antyodaya Anna Yozana (AAY):
This scheme was launched in December 2000.Under this scheme one crore of the poorest among. The BPL families covered under the targeted public distribution system were identified. Poor families were identified by the respective state rural development departments though a Below Poverty Line (BPL) survey. Twenty five kilograms of food grains were made available to each eligible family at a highly at a highly subsidized rate of Rs 2 per Kg for wheat and Rs 3 per for rice. This quantity has been enhanced from 25 to 35 kgs with effect from April 2002. The scheme has been further expanded twice by additional 50 lakh BPL families in June 2003 and in August 2004. With this increase, 2 crore families have been covered under the AAY.

(c) Assessment of poverty – alleviation programmes:
Poverty-alleviation programmes have been implemented in India since 1978. The results of these programmes have been mixed.
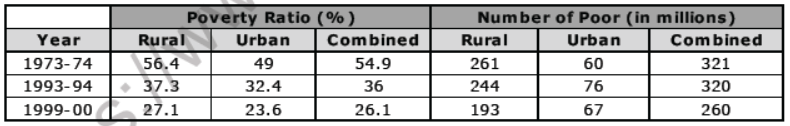
On the positive side, the incidence of poverty has declined in India . There has been a significant fall in poverty during the decades of 1980s and 1990s. Whereas in 1973, about 55 percent of India’s population lived below poverty. This ratio has currently come down to 26 percent.

On the negative side, poverty reduction remains India’s most compelling challenge. About one-fourth on India’s total population, i.e., about 260 million persons, live below the line of poverty. This shows that the poverty alleviation programmes have not lived up to the expectations. The major weaknesses of there programmes have been as follows:
(i) Lack of proper implementation.
(ii) Lack of right targeting
(iii) Overlapping of schemes.
(iv) Non-delivery of benefits to the targeted groups.

THE CHALLENGES AHEAD

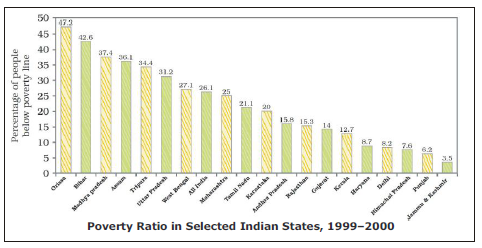
Poverty has certainly declined in India. But despite the progress, poverty reduction remains India’s most compelling challenge. Wide disparities in poverty are visible between rural and urban areas and among different states. Certain social and economic groups are more vulnerable to poverty. Poverty reduction is expected to make better progress in the next ten to fifteen years. This would be possible mainly due to higher economic growth, increasing stress on universal free elementary education, declining population growth, increasing empowerment of the women and the economically weaker sections of society.
The official defination of poverty captures only a limited part of what poverty really means to people.It is about a “minimum” subsistence level of living rather than a “reasonable” level of living. We must broaden the concept into human povety.
Worldwide experience shows that with development, the definition of what constitutes poverty also changes. Eradication of poverty is always a moving target. Hopefully we will be able to provide the minimum “necessary” in terms of only income to all people by the end of the next decade. But the target will move on for many of the bigger challenges that still remain: providing health care, education and job security for all, and achieving gender equality and dignity for the poor. These will be even bigger tasks.

I. Poverty social indicators of poverty
i. Illiteracy level
ii. Lack of general resistance
iii. Due to malnutrition
iv. Lack of access to healthcare
v. Lack of job opportunities
vi. Lack of access to safe drinking water, sanitation etc.
 
II. Methods to measure poverty:
a) Income
b) Consumption level
 
III. Poverty Line: It is an imaginary line that expresses the income that is required to purchase the minimum subsistence needs of a person. It is a line that demarcates the population into poor and non-poor.
 
IV. ESTIMATION OF POVERTY LINE IN INDIA
1. A minimum level of food requirement, clothing, footwear, fuel and light, educational and medical requirement etc. are determined for subsistence.
2. These physical quantities are multiplied by their prices in rupees.
3. The present formula for food requirement while estimating the poverty line is based on the desired calorie requirement.
4. Food items such as cereals, pulses, vegetable, milk, oil, sugar etc. together provide these needed calories.
5. The calorie needs vary depending on age, sex and the type of work that a person does.
6. The accepted average calorie requirement in India is 2400 calories per person per day in rural areas and 2100 calories per person per day in urban areas.
7. People living in rural areas engage themselves in more physical work, calorie requirements in rural areas are considered to be higher than urban areas.
 
V. Poverty Scenario from 1973:
1. There is substantial decline in poverty ratios inIndia.
2. There has been a decline from 55% in 1973 to about 45 per cent in 1993-94.
3. It further declined to 37.2 per cent in 2004-05.
4. The proportion of people below poverty line further came down to about 21.9 per cent in 2011-12.
5. If the trend continues, people below poverty line may come down to less than 20 per cent in the next few years.
6. Although the percentage of people living under poverty declined in the earlier two decades
7. (1973–1993), the number of poor declined from 407.1 million in 2004-05 to 269.3 million in 2011-12 with an average annual decline of 2.2 percentage points during
8. 2004-05 to 2011-12.
 
VI. Inter- state disparity:
1. State level poverty has witnessed a secular decline from the levels of early seventies;
2. The success rate of reducing poverty varies from state to state.
3. In 20 states and union territories, the poverty ratio is less than the national average.
4. High Poverty in Orissa, Bihar, Assam, Tripura and Uttar Pradesh.
5. Orissa and Bihar continue to be the two poorest states with poverty ratios of 47 and 43 per cent respectively.
6. significant decline in poverty in Kerala, Jammu and Kashmir, Andhra Pradesh, Tamil Nadu, Gujarat and West Bengal.
7. Punjab and Haryana have traditionally succeeded in reducing poverty with the help of high agricultural growth rates.
8. Kerala has focused more on human resource development.
9. In West Bengal, land reform measures have helped in reducing poverty.
10. Andhra Pradesh and Tamil Nadu public distribution of food grains could have been responsible for the improvement
 CBSE_Class_9_Social_Science_Poverty_as_Challege_Notes
There were a number of causes for the widespread poverty in India.
 
Historical
a) 200 years of colonial exploitation
b) British government did not encourage industry in India.
c) Handicraft and small cottage industries were crushed for e.g. textile industry.
d) Backwardness in agriculture.
 
Economic
a) Lack of technology and capital, there is slow rate of economic growth.
b) The industries, both public and private, did provide some jobs, but these were not enough to absorb all the job seekers.
c) Unequal distribution of wealth.
d) Indebtedness amongst farmers (due low incomes and low savings )
 
Political 
a. improper implementation of government policies on redistribution of assets in rural areas
b. limited spread of land reform measures and green revolution
 
Social causes 
a. wasteful expenditure on social obligations and ceremonies
b. lack of basic healthcare and illiteracy
c. overpopulation
 
VIII. Anti-Poverty Measures
The current anti-poverty strategy of the government is based broadly on:
 Promotion of economic growth
 Targeted anti-poverty programmes
 
IX. Anti-Poverty Programs:
Year: 2005
 
Major aims:
a) It provides 100 days of wageemployment to every household to ensurelivelihood security in rural areas.
b) It also aimed at sustainable development to address the cause of draught, deforestation and soil erosion.
c) One-third of the proposed jobs have been reserved for women.
d) The scheme provided employment to 220 crores person days of employment to 4.78 crore households.
e) One-third of the proposed jobs have been reserved for women. The scheme provided employment to 220 crores person days of employment to 4.78 crore households.
f) The share of SC, ST, Women person days in the scheme are 23 per cent, 17 per cent and 53 per cent respectively. The average wage has increased from 65 in 2006-07 to 132 in 2013-14.
 
Prime Minister RozgarYozana (PMRY)
 Year: 1993
 
Major aim:
 To create self-employment opportunities for educated unemployed youth in rural areas and small towns.
 They are helped in setting up small business and industries.
Rural Employment Generation Programme (REGP)
 Year: 1995
 
Major aim:
 To create self-employment opportunities in rural areas and small towns.
 A target for creating 25 lakh new jobs has been set for the programme under the Tenth Five Year plan.
Swarnajayanti Gram SwarozgarYojana (SGSY)
 Year: 1999
 
Major aim:
 To assistpoor families above the poverty line byorganising them into self -help groupsthrough a mix of bank credit and government subsidy.
 
Pradhan Mantri GramodayaYozana (PMGY)
 Year: 2000
Major Aim:
• An additional central assistance is given to states for basic services such as primary health, primary education, rural shelter, rural drinking water and rural electrification.
CBSE Class 9 Social Science Poverty as Challege Notes

XI. The countries use different poverty line because-

a) Poverty line varies from time and space.
b) Each country uses an imaginary line of its own appropriate for its existing level of development and minimum social norm
c) Eg: In USA who does not own a car is considered a poor while in India owning a car is a luxury.

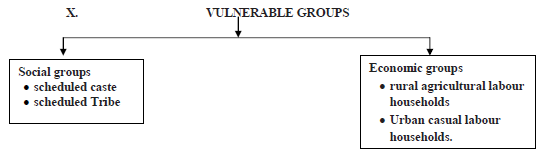
XII. Vulnerability of Poverty means:

1. Greater chances of certain people or group of people communities of becoming poor or remaining poor.
2. It also means that certain people like widow, physically disabled are more prone to poverty in uncertain situations like natural disaster or calamities.
3. It reflects lack of alternatives and social and economic inability to handle risk.
4. Vulnerable groups have higher probability of getting affected than others in bad times.
5. It is determined by the availability of options for finding an alternative living in terms of assets, education health.

XIII. Social Exclusion:

1. Social exclusion involves denial of fair rights and opportunities to certain groups like Schedule Castes and Schedule Tribes which are enjoyed by the majority group.
2. It means when an individual or group of people are distanced from the mainstream society.
3. It results in inability of the excluded group to participate in basic political, social and economic functions of the society.
4. Social exclusion is both a cause and consequence of poverty.
5. Eg: social exclusion in India is practiced on the basis of caste system and untouchability. Thus leading to lower castes to live in poverty.

Chapter 01 The Story of Village Palampur
CBSE Class 9 Social Science Story Of Village Palampur Notes
Contemporary India Chapter 01 India Size and Location
CBSE Class 9 Social Science India Size And Location Chapter Notes
Contemporary India Chapter 02 Physical Features of India
CBSE Class 9 Social Science Physical Features Of India Chapter Notes
Contemporary India Chapter 03 Drainage
CBSE Class 9 Social Science Drainage Notes
Contemporary India Chapter 04 Climate
CBSE Class 9 Social Science Climate Chapter Notes
Contemporary India Chapter 05 Natural Vegetation and Wildlife
CBSE Class 9 Social Science Natural Vegetation And Wildlife Chapter Notes
Contemporary India Chapter 06 Population
CBSE Class 9 Social Science Population Chapter Notes
Democratic Politics I Chapter 01 What is Democracy?
CBSE Class 9 Social Science What Is Democracy Why Democracy Chapter Notes
Democratic Politics I Chapter 02 Constitutional Design
CBSE Class 9 Social Science Constitutional Design Notes
Democratic Politics I Chapter 03 Electoral Politics
CBSE Class 9 Social Science Electoral Politics Chapter Notes
Democratic Politics I Chapter 04 Working of Institutions
CBSE Class 9 Social Science Working of Institutions Chapter Notes
Democratic Politics I Chapter 05 Democratic Rights
CBSE Class 9 Social Science Democratic Rights Notes
India and the Contemporary World-I Chapter 01 The French Revolution
CBSE Class 9 Social Science The French Revolution Notes
India and the Contemporary World-I Chapter 02 Socialism in Europe and the Russian Revolution
CBSE Class 9 Social Science Socialism in Europe and the Russian Revolution Chapter Notes
India and the Contemporary World-I Chapter 03 Nazism and the Rise of Hitler
CBSE Class 9 Social Science Nazism And The Rise Of Hitler Notes
India and the Contemporary World-I Chapter 04 Forest Society and Colonialism
CBSE Class 9 Social Science Forest Society And Colonialism Chapter Notes
India and the Contemporary World-I Chapter 05 Pastoralists in the Modern World
CBSE Class 9 Social Science Pastoralists In The Modern world Chapter Notes

More Study Material

CBSE Class 9 Social Science Chapter 3 Poverty as a Challenge Notes

We hope you liked the above notes for topic Chapter 3 Poverty as a Challenge which has been designed as per the latest syllabus for Class 9 Social Science released by CBSE. Students of Class 9 should download and practice the above notes for Class 9 Social Science regularly. All revision notes have been designed for Social Science by referring to the most important topics which the students should learn to get better marks in examinations. Studiestoday is the best website for Class 9 students to download all latest study material.

Notes for Social Science CBSE Class 9 Chapter 3 Poverty as a Challenge

Our team of expert teachers have referred to the NCERT book for Class 9 Social Science to design the Social Science Class 9 notes. If you read the concepts and revision notes for one chapter daily, students will get higher marks in Class 9 exams this year. Daily revision of Social Science course notes and related study material will help you to have a better understanding of all concepts and also clear all your doubts. You can download all Revision notes for Class 9 Social Science also from www.studiestoday.com absolutely free of cost in Pdf format. After reading the notes which have been developed as per the latest books also refer to the NCERT solutions for Class 9 Social Science provided by our teachers

Chapter 3 Poverty as a Challenge Notes for Social Science CBSE Class 9

All revision class notes given above for Class 9 Social Science have been developed as per the latest curriculum and books issued for the current academic year. The students of Class 9 can rest assured that the best teachers have designed the notes of Social Science so that you are able to revise the entire syllabus if you download and read them carefully. We have also provided a lot of MCQ questions for Class 9 Social Science in the notes so that you can learn the concepts and also solve questions relating to the topics. All study material for Class 9 Social Science students have been given on studiestoday.

Chapter 3 Poverty as a Challenge CBSE Class 9 Social Science Notes

Regular notes reading helps to build a more comprehensive understanding of Chapter 3 Poverty as a Challenge concepts. notes play a crucial role in understanding Chapter 3 Poverty as a Challenge in CBSE Class 9. Students can download all the notes, worksheets, assignments, and practice papers of the same chapter in Class 9 Social Science in Pdf format. You can print them or read them online on your computer or mobile.

Notes for CBSE Social Science Class 9 Chapter 3 Poverty as a Challenge

CBSE Class 9 Social Science latest books have been used for writing the above notes. If you have exams then you should revise all concepts relating to Chapter 3 Poverty as a Challenge by taking out a print and keeping them with you. We have also provided a lot of Worksheets for Class 9 Social Science which you can use to further make yourself stronger in Social Science

Where can I download latest CBSE Class 9 Social Science Chapter 3 Poverty as a Challenge notes

You can download notes for Class 9 Social Science Chapter 3 Poverty as a Challenge for latest academic session from StudiesToday.com

Can I download the Notes for Chapter 3 Poverty as a Challenge Class 9 Social Science in Pdf format

Yes, you can click on the link above and download notes PDFs for Class 9 Social Science Chapter 3 Poverty as a Challenge which you can use for daily revision

Are the revision notes available for Chapter 3 Poverty as a Challenge Class 9 Social Science for the latest CBSE academic session

Yes, the notes issued for Class 9 Social Science Chapter 3 Poverty as a Challenge have been made available here for latest CBSE session

How can I download the Chapter 3 Poverty as a Challenge Class 9 Social Science Notes pdf

You can easily access the link above and download the Class 9 Notes for Social Science Chapter 3 Poverty as a Challenge for each topic in Pdf

Is there any charge for the Class 9 Social Science Chapter 3 Poverty as a Challenge notes

There is no charge for the notes for CBSE Class 9 Social Science Chapter 3 Poverty as a Challenge, you can download everything free of charge

Which is the best online platform to find notes for Chapter 3 Poverty as a Challenge Class 9 Social Science

www.studiestoday.com is the best website from which you can download latest notes for Chapter 3 Poverty as a Challenge Social Science Class 9

Where can I find topic-wise notes for Class 9 Social Science Chapter 3 Poverty as a Challenge

Come to StudiesToday.com to get best quality topic wise notes for Class 9 Social Science Chapter 3 Poverty as a Challenge

Can I get latest Chapter 3 Poverty as a Challenge Class 9 Social Science revision notes as per CBSE syllabus

We have provided all notes for each topic of Class 9 Social Science Chapter 3 Poverty as a Challenge as per latest CBSE syllabus