
Access the latest CBSE Class 12 Economics Determination of Income And Employment Worksheet. We have provided free printable Class 12 Economics worksheets in PDF format, specifically designed for Part B Macroeconomics Chapter 4 Determination of Income and Employment. These practice sets are prepared by expert teachers following the 2025-26 syllabus and exam patterns issued by CBSE, NCERT, and KVS.
Part B Macroeconomics Chapter 4 Determination of Income and Employment Economics Practice Worksheet for Class 12
Students should use these Class 12 Economics chapter-wise worksheets for daily practice to improve their conceptual understanding. This detailed test papers include important questions and solutions for Part B Macroeconomics Chapter 4 Determination of Income and Employment, to help you prepare for school tests and final examination. Regular practice of these Class 12 Economics questions will help improve your problem-solving speed and exam accuracy for the 2026 session.
Download Class 12 Economics Part B Macroeconomics Chapter 4 Determination of Income and Employment Worksheet PDF
Question. Investment is an addition to …… .
a) supply
b) current stock
c) capital stock
d) None of these
Answer : C
Question. If C = Rs 500 crore, I = Rs 300 crore, find the AD in a two sector economy.
a) Rs 500 crore
b) Rs 800 crore
c) Rs 1,300 crore
d) Rs 200 crore
Answer : B
Question. Autonomous consumption is indicated by …… in the consumption function.
a) C
b) AC
c) S
d) C
Answer : D
Question. If the value of average propensity to consume is 1.5, what will be the value of average propensity to save?
a) 0.5
b) −0.5
c) 1
d) 0
Answer : B
Question. Calculate marginal propensity to consume from the following data about an economy which is in equilibrium National income = Rs 1,500 Autonomous consumption expenditure = Rs 300 Investment expenditure = 300
a) 0.4
b) 0.5
c) 0.6
d) 0.75
Answer : C
Question. What can be the maximum value of marginal propensity to save?
a) 0
b) 1
c) 2
d) 3
Answer : B
Question. Aggregate demand can be increased by
a) increasing bank rate
b) selling government securities by Reserve Bank of India
c) increasing cash reserve ratio
d) None of the above
Answer : D
Question. If the value of average propensity to save is − 0.6, what will be the value of average propensity to consume?
a) 0.6
b) −1
c) 1.6
d) 1
Answer : C
Question. In a two sector economy, AD is equal to
a) G + (X-M)
b) C + G
c) C + S
d) C + I
Answer : D
Question. If the investment multiplier is 1, what will be the value of marginal propensity to consume?
a) 2
b) 4
c) 1
d) 0
Answer : D
Question. If MPC = 1, the value of multiplier is …… .
a) 0
b) 1
c) Between 0 and 1
d) infinity
Answer : D
Question. In an economy, the marginal propensity to consume is 0.75. Investment expenditure in the economy increases by Rs 75 crore. Calculate the total increase in national income.
a) Rs 75 crore
b) Rs 100 crore
c) Rs 200 crore
d) Rs 300 crore
Answer : D
Question. If national income is Rs 50 crore and saving is Rs 5 crore, find out average propensity to consume.
a) 1
b) 0.5
c) 0.90
d) 1.11
Answer : C
Question. What is the value of MPC when MPS is zero?
a) 1
b) 0
c) ¥
d) 0.5
Answer : A
Question. In an economy, the consumption expenditure is Rs 8,750 crore and the ratio of average propensity to consume and average propensity to save is 7 : 1.
Calculate the level of income in the economy.
a) Rs 5,000 crore
b) Rs 10,000 crore
c) Rs 15,000 crore
d) None of these
Answer : B
Question. Aggregate Supply = Consumption + …… .
a) Supply
b) Investment
c) Saving
d) Expenditure
Answer : C
Question. Find consumption expenditure from the following: Autonomous consumption = Rs100 Marginal propensity to consume = 0.70 National income = Rs1,000
a) Rs 1,000
b) Rs 100
c) Rs 700
d) Rs 800
Answer : D
Question. What can be the minimum value of investment multiplier?
a) 0
b) 1
c) 2
d) 3
Answer : B
Question. There is …… relationship between MPS and investment multiplier.
a) positive
b) inverse
c) direct
d) None of these
Answer : B
Question. If the marginal propensity to consume is greater than marginal propensity to save, the value of the multiplier will be
a) greater than 2
b) less than 2
c) equal to 2
d) equal to 5
Answer : A
Question. Net export is zero when
a) export is zero
b) import is zero
c) exports = imports
d) All of these
Answer : C
Question. Equilibrium output, income and employment can be determined at economic equilibrium point when (Where, Y = National Income, C = Consumption, S = Savings, I = Investment)
a) Y = C
b) AS = AD
c) S = I
d) Both (b) and (c)
Answer : D
Question. …… is equal to the difference between ‘AD beyond full employment’ and ‘AD at full employment’.
a) Recession
b) Inflationary gap
c) deflationary gap
d) None of these
Answer : B
Question. Calculate investment expenditure from the following data about an economy which is in equilibrium ational income = Rs 1,000 Marginal propensity to save = 0.25 Autonomous consumption expenditure = Rs 200
a) 50
b) 100
c) 150
d) None of these
Answer : A
Question. Name the situatin where some people are not getting work, even when they are willing to work at the existing wage rate.
a) Full employment
b) Involuntary unemployment
c) Voluntary unemployment
d) None of the above
Answer : B
Question. …… refers to a situation where all those who are able to work and are willing to work, are getting work.
a) Under employment
b) Partial employment
c) Full employment
d) Voluntary employment
Answer : C
Question. If consumption function for an economy is given as, C = 500 + 0.8Y and investment expenditure is Rs 100 crore, then determine level of income when savings will be zero.
a) Rs 500
b) Rs 400
c) Rs 625
d) Rs 2,500
Answer : D
Question. In an economy, as a result of increase in investment by Rs 100 crore, national income rises by Rs 1,000 crore. Find marginal propensity to consume.
a) 1
b) 0
c) 0.9
d) 0.1
Answer : C
Question. Issue of new currency notes is a method of
a) revenue policy
b) deficit financing
c) expenditure policy
d) monetary policy
Answer : B
Question. In an economy, investment is increased by Rs 2,000 crore. Calculate the change in total income, if marginal propensity to save is 0.25.
a) Rs 2,000
b) Rs 8,000
c) Rs 4,000
d) Rs 6,000
Answer : B
Question. In case of excess demand, RBI …… the bank rate or interest rate which makes the credit dear.
a) increases
b) decreases
c) deposit
d) None of these
Answer : A
Question. What is the other name of fiscal policy?
a) Deficit financing
b) Monetary policy
c) Bank rate policy
d) Revenue policy
Answer : D
Question. When does a situation of deficient demand arise in an economy?
a) AD > AS
b) S > I
c) AD < AS
d) S < I
Answer : C
Question. The main cause(s) of deficit demand is/are
a) decrease in money supply
b) increase in public expenditure
c) decrease in investment demand
d) Both (a) and (c)
Answer : D
Question. …… refers to selling of government approved securities by RBI to general public and commercial banks in case of excess demand.
a) Bank rate
b) CRR
c) SLR
d) Open market operation
Answer : D
Question. The value of multiplier is …… .
(a) 1/ MPC
(b) 1/MPS
(c) 1/1− MPS
(d) 1/MPC− 1
Answer : B
Question. During excess demand, Central Bank will
a) increase margin requirement
b) decrease margin requirement
c) keep margin requirement constant
d) keep margin requirement zero
Answer : A
Question. Match the following.
Column I Column II
A. Inflationary gap (i) Boom, recession, depression, recovery
B. Deflationary gap (ii) Excess demand
C. Taxation (iii) Deficit demand
D. Business cycle (iv) Revenue policy
Codes
A B C D
a) (i) (ii) (iii) (iv)
b) (ii) (iii) (iv) (i)
c) (iii) (ii) (iv) (i)
d) (ii) (iii) (i) (iv)
Answer : B
Question. In an economy, S = −100 + 0.6 Y is the saving function, where S is saving and Y is national income. If investment expenditure is Rs 1,100, calculate equilibrium level of national income.
a) Rs 1,100
b) Rs 2,000
c) Rs 900
d) Rs 1,200
Answer : B
Question. Induced investment............ related to the level of income in an economy
a) positively
b) inversely
c) not
d) Can’t say
Answer : A
Short Answer Type Questions
Question. Why can the value of MPC be not greater than 1?
Answer. It is because change in consumption can never be greater than change in income.
Question. Does an excess of AD over AS always imply a situation of inflationary gap?
Answer. No. Inflationary gap occurs only when AD>AS corresponding to full employment level of employment.
Question. What happens if AD>AS prior to full employment level of employment?
Answer. It is a state of disequilibrium in economics. When AD>AS , producers have to cater to demand out of their existing stock of goods , implying that the desired level of stocks will decrease. It implies greater production & therefore there is increase in AS .This process continues till equilibrium is struck between AD and AS.
Question. In poor countries like India , people spend a high percentage of their income so that APC and MPC are high . Yet , value of multiplier is low . Why?
Answer. Working of the multiplier process is based on one fundamental assumption: that there exists, excess capacity in the economy , so that whenever consumption expenditure rises (implying increase in demand ) there is a corresponding increase in production (implying increase in income ) . But poor countries like India, lack in production capacity. Accordingly, whenever demand increases (in terms of increase in consumption expenditure), there is increasing pressure of demand on the existing output (implying inflation or rise in prices) rather than the increase in output or income.
Question. In what respect foreign trade will be useful in removing the adverse economic effects of deficient demand?
Answer. Export increases the demand for goods and services produced in the domestic territory and is helpful to reduce deficient demand.
Question.What happens in an economy, when credit availability is restricted and credit is made costlier?
Answer. Aggregate demands falls.
Question. Find out the level of ex-ante aggregate demand from the following information
Autonomous investment 25 crore
Autonomous consumption expenditure 25 crore, MPS 0.2 Level of income 5,000 crore
State whether the economy is in equilibrium or not .Give reason for your answer.
Answer. AD=4050. AD is less than AS so economy is not in equilibrium
Question. If MPC and MPS are equal what is the value of multiplier.
Or
"If MPC and MPS are equal, increase in income will be two times the increase in investment "explain.
Answer. MPS and MPC both will be 0.5
Question. In an economy 20% of increase in income is saved if 500 crores are invested find out increase in income and consumption.
Answer. Income 2500cr& consumption2000cr
Question. Name the situation under which equilibrium level of expenditure exceeds planned aggregate expenditure.
Answer. Deficient demand
Question.State the treatment of following measures by Central Bank during deficient demand
i) CRR
ii) Bank rate
iii) Open market operations
iv)Margin requirements.
Answer. i) CRR will decrease,
ii) bank rate will decrease,
iii) Central bank starts purchasing the securities in the open market.
IV) Margin requirement will be decreased
Question. State whether the following statements are true or false give reasons for your answer
i) Inflation is always harmful for economy
ii) Low and stable rate of inflation may be beneficial to an economy
iii) Inflation or deflation can be caused only by natural factors
iv) During deficient demand the central bank aims at increasing the cost of borrowing money.
Answer. i) False ii) True iii) False iv) False
Question. The consumption function of an economy is given as C=120+0.7Y. Derive saving function from consumption function and calculate saving at the income level of Rs.5000 crores
Answer. Saving function S= -120+0.3Y: Saving 1380 crores
Question. In an economy C=500+0.75Y and I=800. Calculate the following
i) Equilibrium level of Income
ii) Consumption Expenditure at equilibrium level of income
Answer. Y=C+I, C=500+0.75Y+800 , Y=5200 ,comp exp=4400
Question. In an economy expenditure is increased by 400 cr MPC is 0.8 . calculate total increase in income and saving.
Answer. K=5 ,change in investment=400,change in Y 2000, Increase in saving=400cr
Question. What are two alternative ways of determining equilibrium level of income ? How are these related ?
Answer: Two alternative ways of determining equilibrium level of income are :
(i) Aggregate Demand - Aggregate Supply Approach (AD-AS Approach) 1
(ii) Saving-Investment Approach (S-I Approach).
Interrelation between the two approaches : AD = AS (AD-AS Approach) C + I = C + S
I = S (S-I approach)
Question. An economy is in equilibrium. Calculate the Marginal Propensity to Save from the following : National Income = 1,000 Autonomous Consumption = 100 Investment= 120
Answer: Given, Y = 1,000
C = 100
I = 120
Calculate MPS = ?
We known, Y = C + b(Y) + I
or 1,000 = 100 + b(1,000) + 120
or 1,000 = 220 + 1,000b
or b = 1000 - 220/1000
b = 780/1000
or b = 0.78
∴ 1 – MPC = MPS
or 1 – 0.78 = MPS
or MPS = 0.22
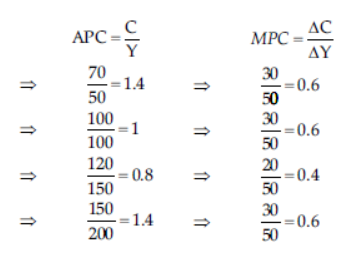
Question. Calculate Marginal Propensity to Consume from the following data about an economy which is in equilibrium:
National Income = 1,500
Autonomous Consumption Expenditure = 300 Investment Expenditure = 300
Answer: Y = C + I
and C = C +b(Y)
∴ Y = C + b(Y) + I
or 1,500 = 300 + (b)1,500 + 300
or 1,500 – b(1,500) = 300 + 300
or 1,500 (b) = 1,500 – 600 1½
or 1,500 (b) = 900
or (b) = 900/1500 = 0.6
∴ b or (MPC) = 0.6
Question. What is ex-Ante consumption? Distinguish between autonomous consumption and induced consumption
Answer: Ex-ante consumption refers to the consumption expenditure planned to be incurred during a period.
Autonomous Consumption refers to the consumption expenditure which does not depend upon the level of income, i.e. the consumption at zero level of income.
Whereas, Induced Consumption expenditure is directly determined by the level of income.
Question. Calculate equilibrium level of income : (i) Autonomous consumption = 200 (ii) Marginal propensity to consume = 0.9 (iii) Investment expenditure = 1,000A
Answer:
Y = C + I and C = 200 + 0.9
Y; I = 1,000 Y = 200 + 0.9Y + 1,000
⇒ 0.1Y = 1,200 Y = 12,000
Question. An economy is in equilibrium. From the following data calculate investment expenditure :
(i) Marginal propensity to consume = 0·9
(ii) Autonomous consumption = 200
(iii) Level of income = 10000
Answer: Y = C + I ½
= C + MPC(Y) + I 1½
10,000 = 200 + 9/10((10,000) + I
= 10,000 – 200 – 9,000 = 800
Question. Calculate Autonomous Consumption Expen- diture from the following data about an economy which is in equilibrium : National Income = 900
Marginal Propensity to Save = 0.10 Investment Expenditure = 80
Answer: Y = C + I
and C = C + b(Y)
or Y = C + b(Y) + I 1½
∴ MPC = (1 – MPS) \ (1 – 0.1) = 0.9
900 = C + 0.9 (900) + 80 1½
or 900 = C + 810 + 80
or C = 900 – 890
or C = 10
Question. Calculate “Investment Expenditure” from the following data about an economy which is in equilibrium :
National Income = 700
Marginal Propensity to Consume = 0.8 Autonomous Consumption Expenditure = 70
Answer: Y = C + I
We know, C = C + b(Y)
∴ Y = C + b(Y) + I 1½
MPC + MPS = 1 \ MPC = 1 – MPS
∴ MPC = 1 – 0.2
= 0.8
∴ 1,000 = 100 + (0.8) (1,000) + I 1½
or 1,000 = 100 + 800 + I
Question. An economy is in equilibrium. Find ‘autonomous consumption’ from the following : National Income= 1,000 Marginal Propensity to Consume = 0.8 Investment Expenditure= 100
Answer: Given, Y = 1,000, MPC = 0.8, I = 100
C = ?
We known,
Y = C + b(Y) + I
or 1,000 = C + 0.8(1,000) + 100
or 1,000 = C + 800 + 100
or C = 1,000 – 900
or C = 100
or I = 1,000 – 900
or I = 100
Question. S = – 100 + 0.2 Y is the saving function in an economy. Investment expenditure is 5,000. Calculate the equilibrium level of income.
Answer: S = –100 + 0.2y
At equilibrium S = I
I = 5,000
∴ 5,000 = –100 + 0.2y
0.2y = 5,100
y = 25,500
Question. An economy is in equilibrium. Find Marginal Propensity to Consume from the following : National Income= 2,000 Autonomous Consumption = 400 Investment Expenditure=200
Answer: Given, Y = 2,000, C = 400, I = 200
Find out MPC = ? We known, Y = C + b(Y) + I
or 2,000 = 400 + b(2,000) + 200
or 2,000 = 400 + 200 + b(2,000)
or 2,000 – 600 = b(2,000)
or b = 1400/2000 = 0.7
∴ b or MPC = 0.7
Question. An economy is in equilibrium. Calculate the Investment Expenditure from the following : National Income = 800 Marginal Propensity to Save = 0.3 Autonomous Consumption = 100
Answer: Given, Y = 800 MPS = 0.3
or MPC = 1 – MPS = 1 – 0.3 = 0.7 C = 100 We known, Y = C + b(Y) + I
or 800 = 100 + 0.7 (800) + I
or 800 = 100 + 560 + I or I = 800 – 660 or I = 140
Question. Calculate “Investment Expenditure” from the following data about an economy which is in equilibrium :
National Income = 700
Marginal Propensity to Consume = 0.8 Autonomous Consumption Expenditure = 70
Answer: Y = C + I
We know, C = C + b(Y)
or Y = C + b(Y) + I 1½
700 = 70 + 0.8 (700) + I 1½
or 700 = 70 + 560 + I
or I = 700 – 630
or I = 70
Question. Calculate Marginal Propensity to Consume from the following data about an economy which is in equilibrium :
National Income = 2,000
Autonomous Consumption Expenditure = 200 Investment Expenditure = 100
Answer: Y = C + I
We know, C = C + b(Y)
∴ Y = C + b(Y) + I 1½
or 2,000 = 200 + b(2,000) + 100 1½
or 2,000 – 300 = 2,000 b
or 2,000 b = 1,700
b = 1700/2000 = 0.85
b = 0.85
Question. Shouldn’t greater saving imply greater investment and greater flow of goods and services?
Answer: Greater Saving implies greater investment and greater flow of goods and services in poor economies where aggregate supply is lacking in relation to aggregate demand. But this relationship doesn’t hold good in case of affluent economies where aggregate demand lacks in relation to aggregate demand. In these economies, greater savings would mean lesser comsumption, resulting in lesser demand and lesser production even when capacity produce exists in the economy.
Long Answer Type Questions
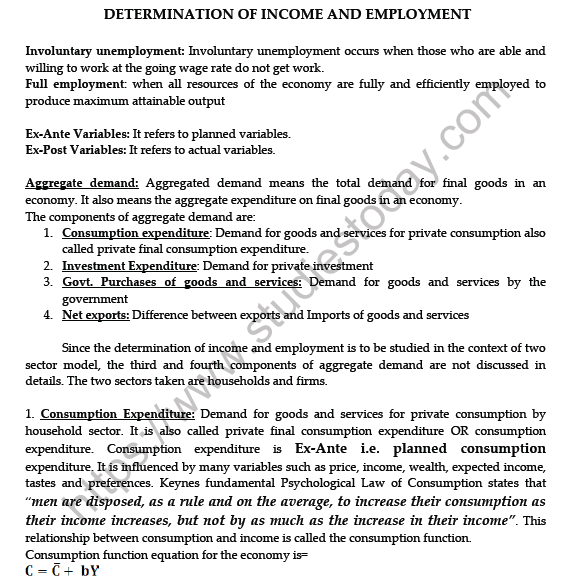
Question. Explain the Consumption Function and Saving Function.
Answer: Consumption Function—The relationship between the consumption expenditure and the income is known as Consumption Function.
C = f(Y)
Where C = Consumption Expenditure
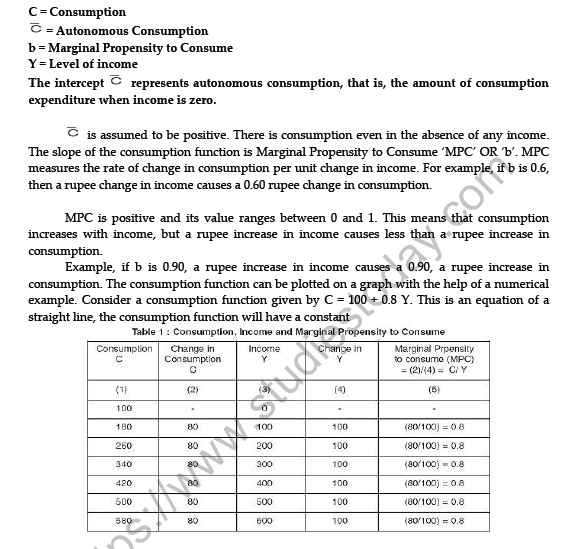
f = Function
Y = Income Algebraic Expression of Consumption Function—
The algebraic expression of Consumption Function
is given by :
C = C + b(Y)
Here, C = Consumption Expenditure
C = Minimum Level of
Consumption at zero income
b = Marginal Propensity to consume
Y = Income
It is of two types :
(i) Average Propensity to Consume (APC) : The ratio between the consumption expenditure and income is called Average Propensity to Consume.
APC = C/Y
(ii) Marginal Propensity to Consume (MPC) :The ratio between the change in consumption expenditure to change in income is called Marginal Propensity to Consume.
MPC = ΔC/ΔY
Saving Function :The relationship between saving and income is known as Saving Function.
S = f(Y)
Saving is the residual of income after consumption.
S = Y – C
Algebraic Expression of Saving Function : It is
given by
S = (–) S + b(Y)
Here, S = Saving
S– = Minimum level of Saving at zero income i.e. negative savings b = Marginal Propensity to save
Y = Income
It is of two types :
(i) Average Propensity to Save (APS) : The ratio between total saving and the total income in an economy at a given level of income is termed as Average Propensity to Save (APS).
APS = S/Y
(ii) Marginal Propensity to Save (MPS) : The ratio between the change in saving to the change in income is known as Marginal Propensity to Save.
MPS = ΔS/ΔY
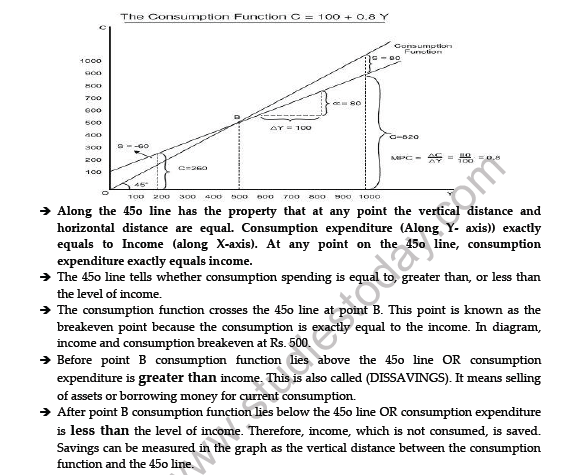
Question. Given Saving Curve, derive Consumption Curve and state the steps in doing so. Use diagram.
OR
Outline the steps required to be taken in deriving the consumption curve from given saving curve. Use diagram.
Answer: Given Saving Curve SS’
(i) Draw a 45º line from the origin.
(ii) Take OC equal to OS on the Y-axis.
(iii) Draw a perpendicular line from B to B’ on OX-axis which intersect 45º line at point B.
(iv) Join C and B and extend it to get consumption curve CC’.
Question. Given Consumption Curve, derive Saving Curve and state the steps taken in the process of derivation.
OR
Outline the steps required to be taken in deriving saving curve from the given consumption curve.
OR
Given a consumption curve, outline the steps required to be taken in deriving a saving curve from it. Use diagram.
Answer: Given Consumption Curve CC’ the steps in derivation of Saving Curve are :
(i) Take OS equal to OC.
(ii) Draw a 45º line on OX-axis from point O intersecting CC’ at point B.
(iii) Draw a perpendicular from B to intersect X-axis at B’.
(iv) Join S and B’ and extend it to derive Saving Curve SS’.
Question. Giving reason state whether the following statements are true or false:
(i) Average propensity to save cannot be negative.
(ii) Value of marginal propensity to consume can be greater than one.
(iii) Average propensity to consume can be greater than one.
Answer:
(i) False, average propensity to save can be negative at a level when consumption is greater than income.
(ii) False, value of marginal propensity to consume cannot be greater than one as change in consumption cannot be greater than change in income.
(iii) True, average propensity to consume can be greater than one, when consumption is greater than income.
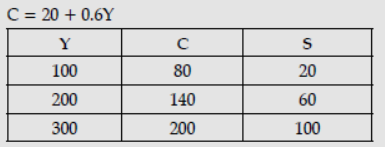
Question. Derive a straight line saving curve using the following consumption saving on function: C = 20 + 0.6Y. Presuming the income levels to be ₹ 100, ₹ 200 and ₹ 300 crore. Calculate that level of income where consumption is equal to income.
Answer:
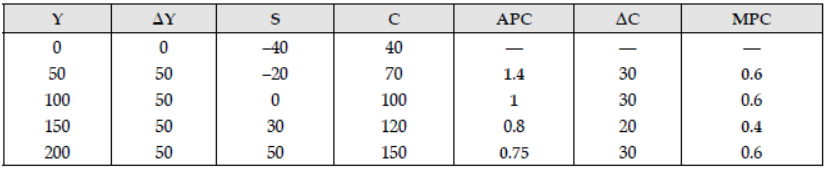
Question. Complete the following table :
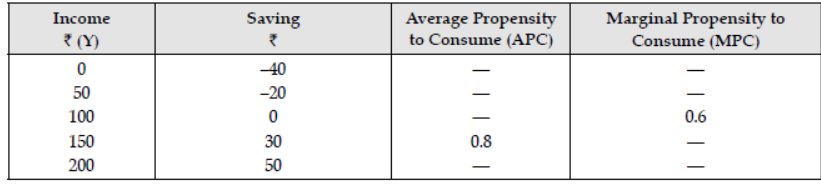
Answer:
Question. In an economy, investment increased by 1,100 and as a result of it income increased by 5,500. Had the marginal propensity to save been 25 percent, what would have been the increase in income ?
Answer: ΔY = ΔI 1/MPS
5,500 = 1100/MPS
MPS = 1100/5500 = 0.20
ΔY = 1100/0.25 = 4,400
Question. When is an Economy in Equilibrium ? Explain with the help of saving and investment functions.
Also explain the changes that take place in an economy when the economy is not in equilibrium.
OR
Explain the determination of equilibrium level of national income using ‘saving and investment’ approach. Use diagram. Also explain the effects if savings is greater than investment.
Answer: The economy is in equilibrium at that income level at which saving = investment. The equilibrium level of income is OM as at this level S = I. When the economy is not in equilibrium, saving is not equal to investment : Suppose S > I, it means AD < AS. This leads to piling up of inventories with the producers. In order to bring down inventories to the desired level, producers cut down production which brings down AS.
The trend continues till AD = AS again and S = I where the economy is in equilibrium. Similarly, if S < I, then AD > AS. There is decrease in inventories. Producers increase production, AS rises. This continues till AD = AS.
Question. Explain the changes that take place when Aggregate Demand and Aggregate Supply are not equal.
Answer:
(i) When AD > AS, it means that the buyers are planning to buy more goods and services than the producers are planning to produce (i.e., supply).
In this situation, inventories start falling and come below the desired level, the producers expand production. This raises the income level, which keeps on rising till AD and AS are equal again.
(ii) When AD < AS, it means that the buyers are planning to buy less than what he producers are planning to produce. As a result, inventories start rising and move above the desired level. So the producers cut back on production and lay off workers. This reduces the income level i.e., AS.
This downward trend continues till AD and AS once again become equal.
Question. In an economy planned spending is greater than planned output. Explain all the changes that will take place in the economy.
Answer: Planned spending refers to people planning to purchase final goods and services during the year. Planned output means the production units planning to produce final goods and services during the year. When planned spending is higher than planned output, the producers find the stocks falling below the desired level. They start raising production.
This raises income levels till inventories (stocks) reach the desired level and economy is in equilibrium.
Question. (i) Define Aggregate Demand. What are its component ?
(ii) From the following data about an economy,
calculate its equilibrium level of income.
(a) Marginal Propensity to Consume = 0.75 (b) Autonomous Consumption = 200
(c) Investment = 6,000
Answer: Y = C + I 1
Whereas, C = C + b(Y)
or Y = C + b(Y) + I 1
or Y = 200 + 0.75 (Y) + 6,000 1
or Y – 0.75Y = 6,200
or 0.25Y = 6,200
or Y = 6200/0.25
= 24,800
or Y = ₹ 24,800
Question. (i) Distinguish between Aggregate Demand and Aggregate Supply. (ii) From the following data about an economy calculate its equilibrium level of income.
(a) Marginal Propensity to Consume = 0.8 (b) Investment = 5,000
(c) Autonomous Consumption = 500
Answer: Y = C + I
Whereas, C = C + b(Y)
∴ Y = C + b(Y) + 500
or Y = 500 + 0.8(Y) + 5,000
or Y – 0.8Y = 5,500
or 0.2Y = 5,500
or Y = 5500/0.2
or Y = ₹ 27,500
Question. (i) Distinguish between Autonomous Invest-ment and Induced Investment.
(ii) On the basis of the following information about an economy, calculate its equilibrium level of income.
(a) Autonomous Consumption = 100 (b) Marginal Propensity to Consume = 0.75 (c) Investment = 5,000
Answer: (i) Autonomous Investment : It is the expenditure on capital formation, which is independent of the change in income, rate of interest and rate of profit.
Induced Investment : It is the investment which is undertaken as a result of a change in the level of income or consumption. It depends upon profit expectations.
(ii) Y = C + I
and C = C + b(Y)
Here Y = C + b(Y) + I
Since S = I = 5,000
or Y = 100 + 0.75 (Y) + 5,000
or Y – 0.75 Y = 5,100
or 0.25Y = 5,100
or Y = 5100/0.25 = 5 100/25 X 100
Y = ₹ 20,400
Question. (i) Distinguish between Autonomous Consumption and Induced Consumption.
(ii) From the following data about an economy, Calculate its equilibrium level of income.
(a) Marginal Propensity to Consume = 0.5 (b) Autonomous Consumption = 300 (c) Investment = 6,000
Answer: (i) Autonomous Consumption—The expendi- ture which is not influenced by income is called Autonomous Consumption. Or it refers to minimum level of consumption even when income is zero. It is indicated by C in consumption function : C = C + bY
Induced Consumption—The consumption expenditure which changes with change in income is called Induced Consumption.
(ii) Y = C + I
but C = C + b(Y) 2
∴ Y = 300 + 0.5 (Y) + 6,000 1½
or Y – 0.5 Y = 6,300
or 0.5Y = 6,300
or Y = 6300/0.5
or Y = ₹ 12,600
Question. Explain the working of the Investment Multiplier with the help of a Numerical example.
Answer: Investment Multiplier refers to increase in national income as a multiple of a given increase in Investment. Its value is determined by MPC. The value equals :
Multiplier = 1/1-MPC or 1/MPS
Suppose increase in investment is ₹ 1000 and MPC = 0.8. The increase in National Income is in the following sequence.
(i) Increase in investment raises income of those who supply investment goods by ₹ 1000. This is the first round increase.
(ii) Since MPC = 0.8, the income earners spend ₹ 800 on consumption. This raises the income of the suppliers of consumption goods by ₹ 800. This is second round increase.
(iii) In the similar way, the third round increase in ₹ 640 = 800 × 0.8. In this way national income goes on increasing round after round.
(iv) The total increase in income is ₹ 5,000 which equals.
ΔY = ΔI × 1/1-MPC
ΔY = 1,000 × 1/1-0.08 = ₹ 5,000
Question. What is the range of values of investment multiplier ? Clarify the relation of investment multiplier with marginal propensity to consume (MPC) and with marginal propensity to save (MPS).
Answer: Value of Investment Multiplier : (a) Minimum value of multiplier is 1 because minimum value of MPC can be zero. (b) Maximum value of multiplier may be–(infinite) because maximum value of MPC can be 1. Relationship of K (investment multiplier) with MPC and MPS (i) There is direct relationship between k and MPC. If MPC is high, k will also be high but if MPC is low, k will also be low. Thus, k varies directly with value of MPC. In short, higher the value of MPC, higher will be the value of multiplier and vice versa. (ii) There is inverse relationship between k and MPS. If MPS is high, k will be low but if MPS is low, k will be high.
Question. Assuming that increase in investment is ₹ 1000 crore and marginal propensity to consume is 0.9, explain the working of multiplier.
Answer: Given that ΔI = 1000 and MPC = 0.9, increase in income is in the following sequence:
(i) Increase in I raises income of those who supply investment goods by ₹ 1000. This is first round increase. (ii) Since MPC = 0.9, income earners spend ₹ 900 on consumption leading to second round increase of ₹ 900 = 1000 × 0.9
(iii) The third round increase in the similar way is ₹ 900 × 0.9 = ₹ 810.
(iv) In this way income goes on increasing round by round, with each round increase in income equal to 90 percent of the previous round.
(v) The total increase in income is :
ΔY = ΔI 1/1-MPC = 1000 X 1/1-0.6
= ₹ 10,000 crore.
Please click on below link to download CBSE Class 12 Economics Determination of Income And Employment Worksheet
Free study material for Economics
Part B Macroeconomics Chapter 4 Determination of Income and Employment CBSE Class 12 Economics Worksheet
Students can use the Part B Macroeconomics Chapter 4 Determination of Income and Employment practice sheet provided above to prepare for their upcoming school tests. This solved questions and answers follow the latest CBSE syllabus for Class 12 Economics. You can easily download the PDF format and solve these questions every day to improve your marks. Our expert teachers have made these from the most important topics that are always asked in your exams to help you get more marks in exams.
NCERT Based Questions and Solutions for Part B Macroeconomics Chapter 4 Determination of Income and Employment
Our expert team has used the official NCERT book for Class 12 Economics to create this practice material for students. After solving the questions our teachers have also suggested to study the NCERT solutions which will help you to understand the best way to solve problems in Economics. You can get all this study material for free on studiestoday.com.
Extra Practice for Economics
To get the best results in Class 12, students should try the Economics MCQ Test for this chapter. We have also provided printable assignments for Class 12 Economics on our website. Regular practice will help you feel more confident and get higher marks in CBSE examinations.
FAQs
You can download the teacher-verified PDF for CBSE Class 12 Economics Determination of Income And Employment Worksheet from StudiesToday.com. These practice sheets for Class 12 Economics are designed as per the latest CBSE academic session.
Yes, our CBSE Class 12 Economics Determination of Income And Employment Worksheet includes a variety of questions like Case-based studies, Assertion-Reasoning, and MCQs as per the 50% competency-based weightage in the latest curriculum for Class 12.
Yes, we have provided detailed solutions for CBSE Class 12 Economics Determination of Income And Employment Worksheet to help Class 12 and follow the official CBSE marking scheme.
Daily practice with these Economics worksheets helps in identifying understanding gaps. It also improves question solving speed and ensures that Class 12 students get more marks in CBSE exams.
All our Class 12 Economics practice test papers and worksheets are available for free download in mobile-friendly PDF format. You can access CBSE Class 12 Economics Determination of Income And Employment Worksheet without any registration.