
Get the most accurate NCERT Solutions for Class 7 Mathematics Chapter 3 Data Handling here. Updated for the 2026-27 academic session, these solutions are based on the latest NCERT textbooks for Class 7 Mathematics. Our expert-created answers for Class 7 Mathematics are available for free download in PDF format.
Detailed Chapter 3 Data Handling NCERT Solutions for Class 7 Mathematics
For Class 7 students, solving NCERT textbook questions is the most effective way to build a strong conceptual foundation. Our Class 7 Mathematics solutions follow a detailed, step-by-step approach to ensure you understand the logic behind every answer. Practicing these Chapter 3 Data Handling solutions will improve your exam performance.
Class 7 Mathematics Chapter 3 Data Handling NCERT Solutions PDF
Exercise 3.1
Q.1) Find the range of heights of any ten students of your class.
Sol.1) Let the heights (in cm) of 10 students of our class be
125, 127, 132, 133, 134, 136,138, 141, 144, 146
Highest value among these observations = 146
Lowest value among these observations = 125
Range = Highest value − Lowest value
= (146 − 125) cm = 21 cm
Q.2) Organise the following marks in a class assessment, in a tabular form.
![]()
(i) Which number is the greatest?
(ii) Which number is the lowest?
(iii) What is the range of the data?
(iv) Find the arithmetic mean.
Sol.2) (i)The highest number is 9.
(ii)The lowest number is 1.
(iii)The range of the data is 9 – 1 = 8
(iv)Arithmetic mean = 4+6+7+5+3+5+4+5+2+6+2+5+1+9+6+5+8+4+6+7 / 20 = 100/20 = 5
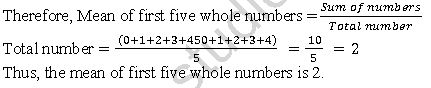
Q.3) Find the mean of the first five whole numbers.
Sol.3) The first five whole numbers are 0, 1, 2, 3 and 4
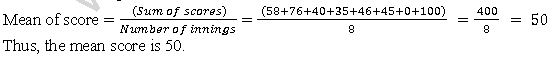
Q.4) A cricketer scores the following runs in eight innings :
58, 76, 40, 35, 46, 45, 0, 100.
Find the mean score.
Sol.4) Number of innings = 8
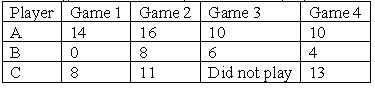
Q.5) Following table shows the points of each player scored in four game :
Now answer the following questions :
(i) Find the mean to determine A's average number of points scored per game.
(ii) To find mean number of points per game for C, would you divide the total points by 3 or by 4? Why?
(iii) B played in all four games. How would you find the mean?
(iv) Who is the best performer?
Sol.5) (i) Mean of player A = Sum of scores by A / No. of games played by A
= (14 + 16 + 10 + 10) / 4 = 50/4 = 12.5
(ii) We should divide the total points by 3 because player C played only three games.
(iii) Player B played in all the four games.
∴ Mean of player B = Sum of scores by B/No. of games played by B
= (0 + 8 + 6 + 4) / 4 = 18/4 = 4.5
(iv) To find the best performer, we should know the mean of all players.
Mean of player A = 12.5
Mean of player B = 4.5
Mean of player C = (8+11+13)/3 = 32/3 = 10.67
Therefore, on comparing means of all players, player A is the best performer.
Q.6) The marks out of 100 obtained by a group of students in a science test are 85, 76,90, 85, 39, 48, 56, 95, 81 and 75. Find the :
i) Highest and the lowest marks obtained by the students.
ii) Range of the marks obtained.
iii) Mean marks obtained by the group
Sol.6) (i) Highest marks obtained by the student = 95
Lowest marks obtained by the student = 39
(ii) Range of marks = Highest marks – Lowest marks = 95 – 39 = 56
(iii) Mean of obtained marks = (𝑆𝑢𝑚 𝑜𝑓 𝑚𝑎𝑟𝑘𝑠)/𝑇𝑜𝑡𝑎𝑙 𝑛𝑢𝑚𝑏𝑒𝑟 𝑜𝑓 𝑚𝑎𝑟𝑘𝑠
= (85+76+90+85+39+48+56+95+81+75) / 10 = 730/10 = 73
Thus, mean marks obtained by the group of students is 73.
Q.7) The enrolment in a school during six consecutive years was as follows :
1555, 1670, 1750, 2013, 2540, 2820
Find the mean enrolment of the school for this period.
Sol.7) Mean enrolment = Sum of numbers of enrolment / Total number of enrolment
= (1555 + 1670 + 1750 + 2013 + 2540 + 2820)/6 = 2058
Thus, the mean enrolment of the school is 2,058.
Q.8) The rainfall in mm in a city on 7 days of a certain week was recorded as follows :
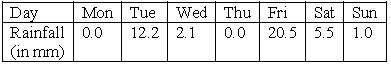
i) Find the range of the rainfall in the above data.
ii) Find the mean rainfall for the week.
iii) On how many days was the rainfall less than the mean rainfall.
Sol.8) (i) The range of the rainfall = Highest rainfall – Lowest rainfall
= 20.5 – 0.0 = 20.5 𝑚𝑚
(ii) Main rainfall = Sum of rainfall recorded / Total number of days
= (0.0 + 12.2 + 2.1 + 2.2 + 20.5 + 5.5 + 1.0) /7 = 41.3/7 = 5.9 𝑚𝑚
(iii) 5 days. i.e., Monday, Wednesday, Thursday, Saturday and Sunday rainfalls were less than the mean rainfall.
Q.9) The heights of 10 girls were measured in cm and the results are as follows :
135, 150, 139, 128, 151, 132, 146, 149, 143, 141
i) What is the height of the tallest girl?
ii) What is the height of the shortest girl?
iii) What is the range of the data?
iv) What is the mean height of the girls?
v) How many girls have heights more than the mean height.
Sol.9) Let us arrange the heights of 10 girls in an ascending order,
128, 132, 135, 139, 141, 143, 146, 149, 150, 151
(i) Height of the tallest girl = 151 cm
(ii) Height of the shortest girl = 128 cm
(iii) Range = (151 − 128) cm = 23 cm
(iv) Mean height == Sum of heights of the girls / Total number of girls
= (135+150+139+128+151+132+146+149+143+141) / 10 = 1414/10 = 141.4 𝑐𝑚
Exercise 3.2
Q.1) The scores in mathematics test (out of 25) of 15 students is as follows :
19, 25, 23, 20, 9, 20, 15, 10, 5, 16, 25, 20, 24, 12, 20
Find the mode and median of this data. Are they same?
Sol.1) Arranging the given data in ascending order,
5, 9, 10, 12, 15, 16, 19, 20, 20, 20, 20, 23, 24, 25, 25
Mode is the observation occurred the highest number of times.
Therefore, Mode = 20
Median is the middle observation = 20
Yes, Mode and Median are same of given observation.
Q.2) The runs scored in a cricket match by 11 players is as follows :
6, 15, 120, 50, 100, 80, 10, 15, 8, 10, 15
Find the mean, mode and median of this data. Are the three same?
Sol.2) The runs scored by 11 players are
6, 15, 120, 50, 100, 80, 10, 15, 8, 10, 15
Arranging these scores in an ascending order,
6, 8, 10, 10, 15, 15, 15, 50, 80, 100, 120
Mean = 6+8+ 10+ 10+ 15+ 15+ 15+ 50+ 80+ 100+ 120/11 = 429/11 = 39
Mode of a given data is that value of observation which occurs for the most number of
times and the median of the given data is the middle observation when the data is arranged in an ascending or descending order
As there are 11 terms in the given data, therefore, the median of this data will be the 6th observation.
Median = 15
Also, it can be observed that 15 occurs 3 times (i.e., maximum number of times).
Therefore, mode of this data = 15
No, these three are not same
Q.3) The weights in kg. of 15 students of a class are :
38, 42, 35, 37, 45, 50, 32, 43, 43, 40, 36, 38, 43, 38, 47
(i) Find the mode and median of this data.
(ii) Is there more than one mode?
Sol.3) The weights of 15 students are
38, 42, 35, 37, 45, 50, 32, 43, 43, 40, 36, 38, 43, 38, 47
Arranging these weights in ascending order,
32, 35, 36, 37, 38, 38, 38, 40, 42, 43, 43, 43, 45, 47, 50
(i) Mode of a given data is that value of observation which occurs for the most number of times and the median of the given data is the middle observation when the data is arranged
in an ascending or descending order.
As there are 15 terms in the given data, therefore, the median of this data will be the 8th observation.
Hence, median = 40
Also, it can be observed that 38 and 43 both occur 3 times (i.e., maximum number of times).
Therefore, mode of this data = 38 and 43
(ii) Yes, there are 2 modes for the given data
Q.4) Find the mode and median of the data :
13, 16, 12, 14, 19, 12, 14, 13, 14
Sol.4) The given data is 13, 16, 12, 14, 19, 12, 14, 13, 14
Arranging the given data in an ascending order,
12, 12, 13, 13, 14, 14, 14, 16, 19
Mode of a given data is that value of observation which occurs for the most number of times and the median of the given data is the middle observation when the data is arranged in an ascending or descending order.
As there are 9 terms in the given data, therefore, the median of this data will be the 5th observation.
Hence, median = 14
Also, it can be observed that 14 occurs 3 times (i.e., maximum number of times).
Therefore, mode of this data = 14
Q.5) Tell whether the statement is true or false :
(i) The mode is always one of the numbers in a data.
(ii) The mean can be one of the numbers in a data.
(iii)The median is always one of the numbers in a data.
(iv) The data 6, 4, 3, 8, 9, 12, 13, 9 has mean 9.
Sol.5) (i) True
Mode of a given data is that value of observation which occurs for the most number of times. Therefore, it is one of the observations given in the data.
(ii) False
Mean may or may not be one of the numbers in the data.
(iii) True
The median of the given data is the middle observation when the data is arranged in an ascending or descending order.
(iv) False
The given data is 6, 4, 3, 8, 9, 12, 13, 9
Mean = 6+4+3+8+9+12+13+9/8 = 64/8 = 9
Exercise 3.3
Q.1) Use the bar graph Fig below to answer the following question :
(a) Which is the most popular pet?
(b) How many children have dog as a pet?
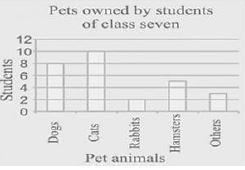
Sol.1) (a) Since the bar representing cats is the tallest, cat is the most popular pet.
(b) The number of children having dog as a pet are 8.
Q.2) Read the bar graph (Fig below) and answer the questions that follow :
Number of books sold by a bookstore during five consecutive years.
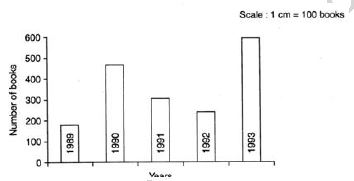
i) About how many books were sold in 1989? 1990? 1992?
ii) In which year were about 475 books sold? About 225 books sold?
iii) In which years were fewer than 250 books sold?
iv) Can you explain how you would estimate the number of books sold in 1989?
Sol.2) (i) Number of books sold in 1989 = 175 (approx.)
Number of books sold in 1990 = 475 (approx.)
Number of books sold in 1992 = 225 (approx.)
(ii) About 475 were sold in the year 1990.
About 225 books were sold in the year 1992.
(iii) Fewer than 250 books were sold in the years 1989 and 1992.
(iv) Length of the bar corresponding to 1989 is about 1.75 cm. The scale is 1 cm = 100 books.
So, the number of books estimated to be sold in 1989 = 1.75 × 100 = 175
Q.3) Number of children in six different classes are given below.
Represent the data on a bar graph.ng :
![]()
a) How would you choose a scale.
b) Answer the following questions :
i) Which class has the maximum number of children? And the minimum?
ii) Find the ratio of students of class sixth to the students of class eight.
Sol.3)
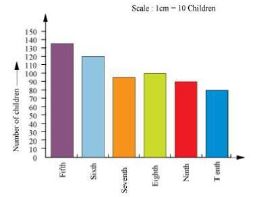
a) We will close a scale as 1 unit = 10 children because we can represent more clear difference between the number of students of class 7th and that of class 9th this scale.
b)
(i) Since the bar representing the number of children for class fifth is the tallest, there are maximum number of children in class fifth. Similarly, since the bar representing the number of children for class tenth is the smallest, there are minimum number of children in class tenth.
(ii) The number of students in class sixth 120 and the number of students in class eighth is 100.
Therefore, the ratio between the number of students of class sixth and the number of students of class eight = 120/100 = 6/5 = 6: 5
Q.4) The performance of students in 1st Term and 2nd Term is given.
Draw a double bar graph choosing appropriate scale and answer the followi
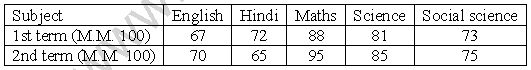
i) In which subject, has the child improved his performance the most?
ii) In which subject is the improvement the least?
iii) Has the performance gone down in any subject ?
Sol.4)
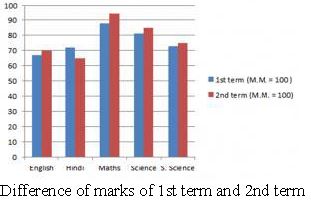
English = 70 – 67 = 3 Hindi = 65 – 72 = –7–7 Maths = 95 – 88 = 7
Science = 85 – 81 = 4 S. Science = 75 – 73 = 2
(i) He has most improved in Maths subject.
(ii) In S. Science subject, his improvement is less.
(iii) Yes, in Hindi subject, his performance has gone down.
Q.5) Consider this data collected from a survey of a colony.
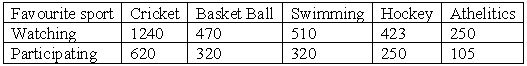
(i) Draw a double bar graph choosing an appropriate scale. What do you infer from the graph ?
(ii) Which sport is most popular ?
(iii) Which is more preferred watching or participating sport ?
Sol.5)
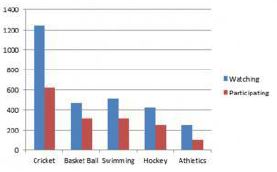
a) The bar graph represents the number of persons who are watching and participating in their favourite sports.
b) Cricket is more popular.
c) Watching sports is more preferred
Q.6) Take the data giving the minimum and the maximum temperature of various cities given in the beginning of this chapter.
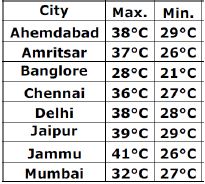
Plot a double bar graph using the data and answer the following :
i) Which city has the largest difference in the minimum and maximum temperature on the given date?
ii) Which is the hottest city and which is the coldest city?
iii) Name two cities where maximum temperature of one was less than the minimum temperature of the other.
iv) Name the city which has the least difference between its minimum and the maximum temperature.
Sol.6) The given data is represented in a bar graph
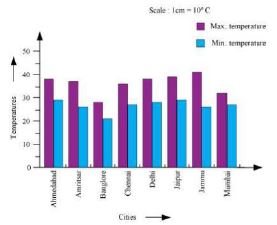
a) Jammu has the largest difference in temperature i.e.,
Maximum temperature = 41°𝐶 and
Minimum temperature = 26°𝐶.
Difference = 41°𝐶 – 26°𝐶 = 15°𝐶
b) Jammu is the hottest city due to maximum temperature is high and Bangalore is the coldest city due to maximum temperature is low.
c) Maximum temperature of Bangalore is 28°𝐶
Minimum temperature of two cities whose minimum temperature is higher than the maximum temperature of Bangalore are Ahmedabad and Jaipur where the minimum temperature is 29°𝐶
d) Mumbai has the least difference in temperature i.e.,
Maximum temperature = 32°𝐶 and
Minimum temperature = 27°𝐶
Difference = 32°𝐶 – 27°𝐶 = 5°𝐶
Exercise 3.4
Q.1) Tell whether the following is certain to happen, impossible, can happen but not certain.
i) You are older today than yesterday.
ii) A tossed coin will land heads up
iii) A die when tossed shall land up with 8 on top.
iv) The next traffic light seen will be green.
v) Tomorrow will be a cloudy day.
Sol.1) (i) Certain
(ii) Can happen but not certain
(iii) Impossible as there are only six faces on a dice marked as 1, 2, 3, 4, 5, 6, on it.
(iv) Can happen but not Certain
(v) Can happen but not Certain
Q.2) There are 6 marbles in a box with numbers from 1 to 6 marked on each of them.
i) What is the probability of drawing a marble with number 2?
ii) What is the probability of drawing a marble with number 5?
Sol.2) Total marbles from 1 to 6 marked in a box = 6
(i)The probability of drawing a marble with number 2.
⇒ P (drawing one marble) = 1/6
(ii)The probability of drawing a marble with number 5.
⇒ P (drawing one marble) = 1/6
Q.3) A coin is flipped to decide which team starts the game. What is the probability that your team will start?
Sol.3) A coin has two sides; head and tail.
Probability = 𝑛𝑜.𝑜𝑓 𝑓𝑎𝑣𝑜𝑢𝑟𝑎𝑏𝑙𝑒 𝑜𝑢𝑡𝑐𝑜𝑚𝑒𝑠/𝑛𝑜.𝑜𝑓 𝑝𝑜𝑠𝑠𝑖𝑏𝑙𝑒 𝑜𝑢𝑡𝑐𝑜𝑚𝑒𝑠
Thus, the probability of getting tails = ½
Q.4) A box contains pairs of socks of two colours (black and white). I have picked out a white sock. I pick out one more with my eyes closed. What is the probability that it will make a pair?
Sol.4) It can be observed that while closing the eyes, one can draw either a black sock or a white sock. Therefore, there are two possible cases.
Probability = 𝑛𝑜.𝑜𝑓 𝑓𝑎𝑣𝑜𝑢𝑟𝑎𝑏𝑙𝑒 𝑜𝑢𝑡𝑐𝑜𝑚𝑒𝑠/𝑛𝑜.𝑜𝑓 𝑝𝑜𝑠𝑠𝑖𝑏𝑙𝑒 𝑜𝑢𝑡𝑐𝑜𝑚𝑒𝑠
Probability ( a pair of white socks will be formed) = 1/2
Free study material for Mathematics
NCERT Solutions Class 7 Mathematics Chapter 3 Data Handling
Students can now access the NCERT Solutions for Chapter 3 Data Handling prepared by teachers on our website. These solutions cover all questions in exercise in your Class 7 Mathematics textbook. Each answer is updated based on the current academic session as per the latest NCERT syllabus.
Detailed Explanations for Chapter 3 Data Handling
Our expert teachers have provided step-by-step explanations for all the difficult questions in the Class 7 Mathematics chapter. Along with the final answers, we have also explained the concept behind it to help you build stronger understanding of each topic. This will be really helpful for Class 7 students who want to understand both theoretical and practical questions. By studying these NCERT Questions and Answers your basic concepts will improve a lot.
Benefits of using Mathematics Class 7 Solved Papers
Using our Mathematics solutions regularly students will be able to improve their logical thinking and problem-solving speed. These Class 7 solutions are a guide for self-study and homework assistance. Along with the chapter-wise solutions, you should also refer to our Revision Notes and Sample Papers for Chapter 3 Data Handling to get a complete preparation experience.
FAQs
The complete and updated is available for free on StudiesToday.com. These solutions for Class 7 Mathematics are as per latest NCERT curriculum.
Yes, our experts have revised the as per 2026 exam pattern. All textbook exercises have been solved and have added explanation about how the Mathematics concepts are applied in case-study and assertion-reasoning questions.
Toppers recommend using NCERT language because NCERT marking schemes are strictly based on textbook definitions. Our will help students to get full marks in the theory paper.
Yes, we provide bilingual support for Class 7 Mathematics. You can access in both English and Hindi medium.
Yes, you can download the entire in printable PDF format for offline study on any device.