
Download the latest CBSE Class 12 Economics Determination Of Income And Employment Notes Set 01 in PDF format. These Class 12 Economics revision notes are carefully designed by expert teachers to align with the 2026-27 syllabus. These notes are great daily learning and last minute exam preparation and they simplify complex topics and highlight important definitions for Class 12 students.
Revision Notes for Class 12 Economics Part B Macroeconomics Chapter 4 Determination of Income and Employment
To secure a higher rank, students should use these Class 12 Economics Part B Macroeconomics Chapter 4 Determination of Income and Employment notes for quick learning of important concepts. These exam-oriented summaries focus on difficult topics and high-weightage sections helpful in school tests and final examinations.
Part B Macroeconomics Chapter 4 Determination of Income and Employment Revision Notes for Class 12 Economics
Determination of Income and Employment
Key concepts
_ Aggregate demand and its components.
_ Propensity to consume and propensity to save
_ Short run fixed price in product market equilibrium output, investment or output multiplier and the multiplier mechanism.
_ Meaning of full employment and involuntary unemployment.
_ Problems of excess demand and deficient demand.
_ Measures to correct excess demand and deficient demand.
_ Change in government spending.
_ Availability of credit.
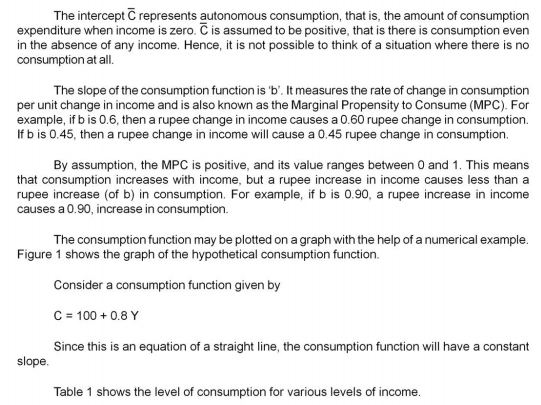
_ Autonomous consumption: The consumption which does not depend upon income.
(Or) The amount of consumption expenditure when income is zero. C > 0. Even if income is zero consumption cannot be zero. Consumption will take place from past savings for survival.
_ Autonomous Investments: It is Investment which is made irrespective of level of income. It is generally run by the government sector. It is income inelastic. The volume of autonomous investment is same at all level of income.
Key points
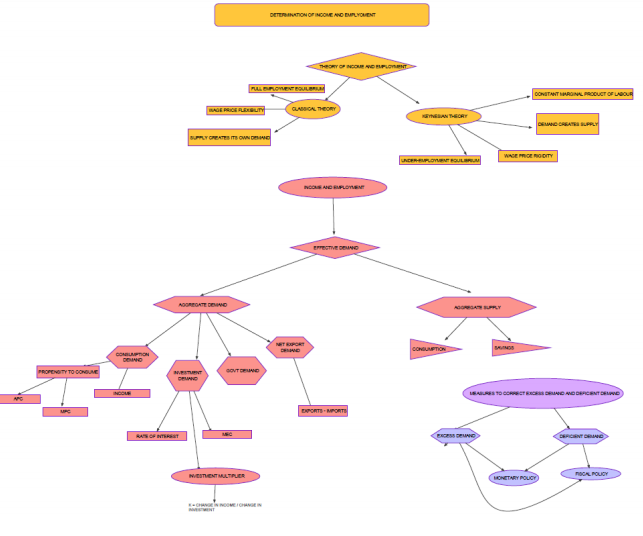
_ Determination of income, output and employment is the core of the subject matter of macroeconomics.
_ AD and AS together determine the level of income, output and employment.
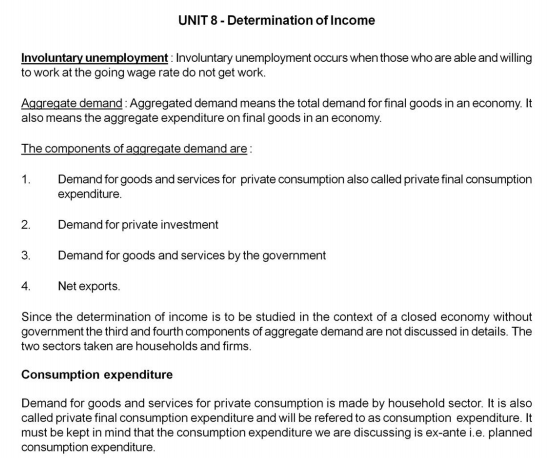
_ Aggregate demand is the total demand of goods and service in the economy.
_ The main components of AD are-
1. House hold consumption expenditure.
2. Investment expenditure.
3. Government consumption expenditure
4. Net export.
_ Household consumption expenditure is the expenditure incurred by the household on the purchase of goods and services to satisfy their wants.
_ Investment expenditure refers to the expenditure incurred by the private firms and government on the purchase of capital goods such as plant and equipment.
_ Government consumption expenditure refers to the expenditure incurred by the government on the purchase of goods and services.
_ Net export refers to the difference between export and import.
_ AD=C+I+G+(x-m).
_ In a two sector economy AD =C+I.
_ Aggregate supply is the sum total of consumption expenditure and saving.
AS=C+S
PROPENSITY TO CONSUME AND PROPENSITY TO SAVE.
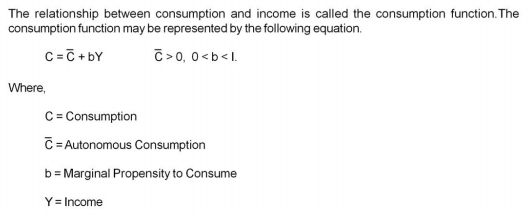
♦ The relationship between consumption and income is called propensity to consume or
1. C=f(Y).
♦ Consumption function may be represented by an equation.
C=a+b(Y)
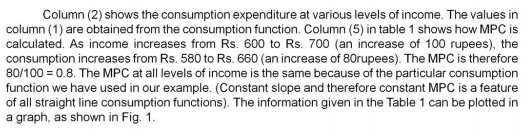
C=consumption, a =consumption at zero level of income b=MPC (slope of the consumption curve) Y=income.
The consumption equation shows the level of consumption for various level of income.
♦ Propensity to consume is of two types
A) Average propensity to consume (APC)
B) Marginal propensity to consume (MPC).
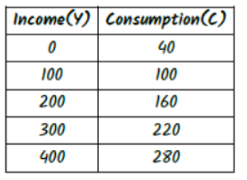
♦ APC= ratio of total consumption to total income.
APC=C/Y.
♦ MPC=ΔC/ΔY.
♦ Propensity to save indicates the tendency of the households to save at a given level ofincome. It shows the relation between saving and income.
♦ Propensity to save is also of two types.
A. Average propensity to save (APC)
B. Marginal propensity to save.(MPC)
♦ Average propensity to save is the ratio of saving to income APC=S/Y.
♦ Marginal propensity to save is the ratio of change in saving to change in income MPS=ΔS/ΔY.
♦ There is relationship between APC and APS.
APC+APS=1
APC=1-APS.
♦ There is relationship between MPC and MPS.
MPC+MPS=1
1-MPC=MPS.
Meaning of involuntary unemployment and full employment.
♦ Involuntary unemployment refers to a situation in which people are ready to work at prevailing wage rate, but do not find work.
♦ Full employment refers to a situation in which no one is unemployed i.e.…there is no involuntary unemployment.
♦ According to Keynes full employment signifies a level of employment where increase in aggregate demand does not lead to an increase in the level of output and employment.
Increase in demand beyond full employment causes prices to go up.
DETERMINATION OF INCOME AND EMPLOYMENT.
♦ The determination of income and employment in the Keynesian theory depends on the level of AD and AS.
♦ Equilibrium level of income and output is determined where,
1) AD=AS 2) Planned saving =planned investment.
♦ Equilibrium level of income and output is determined where,
1) AD=AS 2) Planned saving =planned investment.
♦ In a two sector economy Ad=C+I, AS=Y, Y=C+I.
♦ Suppose that C=40+0.75Y(CONSUMPTION FUNCTION) and I =Rs.60 (investment function)then the equilibrium level of income is obtained as
Y=C+I
Y=40+0.75Y=60
Y-0.75Y=100
0.25Y=100
Y=10000/25
Y=400crores.
♦ Investment multipliers and its working.
♦ Investment multiplier explains the relationship between increase in investment and the resultant increase in income.
♦ Investment multiplier is the ratio of change in income to change in investment. Multiplier (k) =Δy/ΔI.
♦ The value of multiplier depends on the value of marginal propensity to consume (MPC).
♦ There is direct relationship between k and MPC.
♦ Multiplier also depends on the marginal propensity to save
♦ There is inverse relationship between multiplier and MPS.
IMPORTANT FORMULAE.
♦ AD=C+I (two sector economy).
♦ APC=C/Y.
♦ APS=S/Y.
♦ APC+APS=1
♦ MPC=ΔC/ΔY
♦ MPS=ΔS/ΔY
♦ MPS+MPC=1 AND 1-MPC=MPS
♦ K=ΔY/ΔC or K=1/MPS or K=I/I-MPC
♦ C= ¯c+b(Y)
♦ S= -a+(1-b)Y
¯c= autonomous consumption
-a= negative saving
(1-b)=MPS
SHORT RUN FIXED PRICE ANALYSIS
Basic Concept
Assumption
1) Fixed Price : In the short period price is fixed (constant) and elasticity of supply is infinite i.e., supply curve is perfectly elastic. It means the suppliers are willing to supply whatever amount of goods, consumer will demand at that price.
2) Fixed Interest Rate : Interest rate remains constant.
3) Aggregate supply is perfectly elastic at this price. Under these circumstances equilibrium output will be determined by aggregate demand at this price in the economy. At a fixed price the value of ex-ante aggregate demand for final goods is the sum of ex-ante consumption expenditure C and ex-ante investment expenditure I on final goods.
AD=C+I
Consumption function C =¯c + b(Y)
¯c = Autonomous consumption
b= marginal propensity to consume due to unit increase in income In the short period, price and rate of interest remaining constant i.e., ex-ante Investment expenditure is uniform i.e. same amount every year.
Hence, I = I
I = Autonomous Expenditure
we also assume that Aggregate Supply at this cost price is determined by aggregate demand which is known as Effective demand principle. The level of AD required to achieve full employment equilibrium is called effective demand. (or) AD at the point of equilibrium is called Effective demand.
AD = C+I (By substituting the value of consumption function)
AD = C + I + bY
When final good market is in equilibrium, quantity demanded = quantity supplied
AD = AS
― ―
Y = C + I + by
― ― ― ―
Y = A + bY (A = C + I showing total autonomous expenditure
―
Y – bY = A
―
Y(l – b) = A
‾
Y = A /l - b
Y depends upon A (C (or) I) or MPC.
Effects of an autonomous change on equilibrium in the product market.

The line AD1 and AD2 correspond to the values of A, via A1 and A2 respectively AS is the 45° line is equal to one.
The 45° line represents point at which AD and output are equal.
The AD1 line intersects the 45° line at point E1.
At equilibrium point the equilibrium values of output and aggregate demand are OY1 and AD1.
When autonomous investment increases the AD1 line shifts upwards and assumes the position AD2.
The value of aggregate demand at output OY1 is Y1F which is greater than the value of output OY1 = Y1E1 by an amount E1F
♦ E1F measures the amount of excess demand that emerges in the economy as a result of the increase in autonomous expenditure: The new AD2 intersects the 45° line at point E2 at the new equilibrium output and AD2 have increased by an amount E2G which is greater than the initial increment in autonomous expenditure E1F.
")
")
")
")
1 MARK QUESTIONS
Question. What is the relation between APC and APS?
Answer : APC+APS=1
Question. What is the relation between MPC and MPS?
Answer : MPS+MPC=1.
Question. If APC is 0.7 then how much will be APS?
Answer : 1-0.7=0.3
Question. If MPC =0.75, what will be MPS?
Answer : MPC+MPS=1
1-0.75=0.25
Question. State the important factor influencing the propensity to consume in an economy?
Answer : The level of income (Y) Influences the propensity to consume (c) of an economy.
Question. What is meant by investment?
Answer : Investment means addition to the stock of capital good, in the nature of structures, equipment or inventory.
Question. What is the investment demand function?
Answer : The relationship between investment demand and the rate of interest is called investment demand function.
Question. What is equilibrium income?
Answer : The equilibrium income is the level of income where AD=AS i.e.…AD=AS and planned saving equals planned investment.
Question. Give the formula of investment multiplier in terms of MPC.
Answer : K=1/1-MPC
Question. What can be the minimum value of investment multiplier?
Answer : One.
Question. What is the maximum value of investment multiplier?
Answer : Infinity.
Question. Give the equation of propensity to consume.
Answer : C=‾‾a+by.
Question. Write down the equation of saving function?
Answer : S= -a+ (1-b) y.
3 AND 4 MARKS QUESTIONS.
Question. Explain the components of equation c= ‾a + by.
Answer : ‘a’ is called intercept and it represents the amount of consumption when there is a zero level of income i.e. autonomous consumption. The consumption is positive at zero level of income. The coefficient ‘b’ measures the slope of consumption. The slope gives the increase in consumption per unit increase in income. This is called as MPC. Consumption changes by ‘b’ for every one rupee change in income. Consumption changes in the same direction as income.
Question. Derive the saving function from the consumption function c=‾a+by.
Answer : Saving is equal to income minus consumption (y=c+s).The saving function relates to the level of savings to the level of income. It is derived from the consumption which is as follows:
Y=C+S
S=Y-C
since C=‾a+bY.
therefore,
S=Y-(a+bY)
S= -a+(1-b)Y (SAVING FUNCTION).
Question. Explain the components of S= -a+ (1-b) Y.
Answer : The saving function is S= -a+ (1-b) Y.-a represents the intercept term and it represents the amount of savings done when there is zero level of income. The saving is negative at zero level of income because at zero level of income consumption (a) is positive. Negative saving is nothing but dissaving, this means that at zero level of income there is dissaving of amount –a.
The coefficient (1-b) measures the slope of the saving function. The slope of the saving function gives the increase in savings per unit increase in the income. This is known as MPS. Since ‘b’, that is MPC is less than one, it follows that (1-b) i.e. MPS is positive.
Saving is an increasing function of income.
Question. Can the value of APS be negative? If yes then when?
Answer : The value of APS can be negative when the value of consumption exceeds the value of income. At low level of income saving is negative.
e.g.: if income is Rs 1000 and consumption expenditure is Rs 1200
Y=C+S S=Y-C
1000-12000=-200
APS=-200/1000=0.2 APS=S/Y.
APS=-0.2.
Question. Can the average propensity to consume be greater than one? Give the reason for your answer.
Answer : APC can be greater than one when the consumption exceeds the income. At that level APS will be negative .when the APS is negative APC will be greater than one.
e.g.: if the income is 1000 and the consumption is 1200, APC =1200/1000=1.20.
Question. When can the APC be equal to one? Give reason for your answer.
Answer : APC can be equal to one when APS =0, i.e when consumption = income.
E.g: y=1000, c=1000.
APC=C/Y 1000/1000=1
APC=1
APC+APS=1
1-APC=APS
1-1=0
Question. Explain the meaning of investment multiplier? What can be its minimum value and why?
Answer : Defined as the ratio of change in the income to the change in the investment.
K=ΔY/ΔI.
The value of the multiplier is determined by the MPC. It is directly related to MPC.
K=1/1-mpc = 1/1-0 =1
K=1
Minimum value of K is when minimum value of MPC=0, the minimum value of K will be unit one.
Question. Explain the working of a multiplier with an example.
Answer : Multiplier tells us what will be the final change in the income, as a result of change in investment. Change in investment results in the change in income. Symbolically:
ΔI→ΔY→ΔC→ΔY
The working of a multiplier can be explained with the help of the following table which is based on the consumption that is, ΔI=1000 and MPC=4/5.
PROCESS OF INCOME GENERATION.
As per the table the initial increase in the investment of Rs 1000 there is a total increase in the income by Rs 5000 given MPC=4/5 . Out of this total increase in the income Rs 4000 will be consumed and Rs 5000 be saved.
The sum of total increase in income is also derived as:
Δy=1000+800=640+512+…………….infinity.
1000+4/5×1000(4/5)2×1000+(4/5)3×1ooo+………..infinity
=1000[1+4/5+ (4/5)2+(4/5)3+………infinity]
=1000[1/1-4/5] = 1000×5/1=Rs. 5000 cores.
Question. Differentiate between ex ante and ex post investment.
Answer : Ex ante is the planned investment which the planner intends to invest at different level of income and employment in the economy.
Ex post investment may differ from ex ante investment when the actual sales differ from the planned sales and the firms thus face unplanned addition or reduction of inventories.
6 MARKS QUESTIONS WITH ANSWERS
Question. Draw a hypothetical propensity to consume curve from it draw the propensity curve to save curve
Answer : APC=C/Y APS=S/Y
Propensity to save curve
Is drawn from propensity to consume curve
When Y=C APC=1
Till that point APS is negative at point‘s’
When y>c there is a positive saving (Image 9)
Question. Explain the determination of income and employment with AD and AS. (Give schedule)
Answer :
AD= C+I
AS=C+S AS=Y (refers to countries national income)
The equilibrium level of income is determined at a point when AD=AS.
Equilibrium can be achieved at full employment and even at under employment situation.
It may not be always at full employment condition in an economy. (Image 10)
The above schedule shows equilibrium level of income is 300 where AD=AS 300=300.
Question. Explain the equilibrium level of income, employment and output with saving and investment approach. What happens when savings exceeds investment?
Answer : Equilibrium is achieved when planned saving is equal to planned investment that is S=I.
This can be seen with the help of schedule and a diagram.
The equilibrium level of income is s 300 core and at this point S (100) =i (100) the equilibrium may necessarily not be at the full employment level.
When saving exceeds planned investment means people are consuming less and spending more as a result AD is less than AS.
This will lead to accumulation of more goods with producer .this will make the businessmen to reduce production consequently, output, income & employment will be reduced till the equilibrium level of income.
Question. Draw a straight line consumption curve. From it derive a saving curve explaining the process. Show on the diagram.
Answer :
a) The level of income at which average propensity to consume equal to one.
b) A level of income at which average propensity to save is negative. (Image 11)
Ac is the consumption curve and OA is the consumption expenditure at zero level of income.
Income minus consumption is saving.
When income is 0, the economy’s consumption level is OA. The corresponding level of saving is -0A.
So –a is the starting point of saving curve. At OB level of income consumption is equal to income, so saving are zero. so B is another point on saving curve .
Join A and B and extend this line to S, AS is the saving curve.
a) The level of income at which APC is equal to one is OB.
b) A level of income at which APS is negative OY.
NUMERICALS.
1. If in an economy investment increases by Rs 1000 cores to Rs 1200 cores and as a result total income increases by 800 cores calculate capital MPS.
Answer : Δ I=1200-1000=200
ΔY=800
ΔK=ΔY/ΔI=800/200=4
MPS=1/4=0.25
MPS=0.25
2. IF in an economy the actual level of income is Rs 500crores whereas the full employment the level of income is RS 800 cores. The MPC=0.75 calculate the increase in investment required to achieve full employment income.
Answer : Actual income=Rs500 cores
Full empl Income = Rs 800 cores
Δ y = 800 -500 = 300 cores
3. Suppose the consumption equals c= 40 + 0.75 y, Investment equals I = Rs 60 and Y= C + I. Find i) Equilibrium level of income ii) The level of consumption at equilibrium iii) level of saving at equilibrium
Answer : i) Y= C + I AS = AD
Substituting the value of c and I we get
Y = 40 + 0.75y + 60 Y= C+ I I=60
(Y-0.75y)= 100
(1-0.75)Y=100
0.25Y =100
Y=100/0.25
Y=10000/25
Y=400
Equilibrium level of income = Rs. 400 cr.
ii)AS =AD
C= 40 + 0.75y
Y = 400
C= 40 + 0.75(400) = 340
C=340
iii) Y= C + S So S= Y-C
S= 400 - 340 = 60
S= 60 crores
6. In a two sector economy, the saving and investment functions are:
S= -10 + 0.2Y I = -3 + 0.1Y
What will be the equilibrium level of income?
Answer : Equilibrium level of income S= I
-10 + 0.2y = -3 + 0.1y
0.2y – 0.1y = -3 + 10
0.1y =7
y = 70
4. Explain the components of the equation C= 20 + 0.90 y and construct a schedule for consumption where income is Rs 200 , Rs 300 , Rs 350 and Rs 400.
Components of equation c=20 + 0.90y explained in ¾ mark question number 1
The schedule for consumption is as follows
Y (Income) c=20 + 0.90y
200 200 c= 20 + 0.9 × 200
250 245 =20 + 180 = 200
300 290 c= 20 + 0.9 ×250
350 335 = 20 + 225 = 245
400 380 c= 20 + 0.9 × 300 = 290
C= 20 + 0.9 × 350 + 335
C= 20 + 0.9 × 400 = 380
5. The consumption function is C= 20 + 0.9y. The value of Income is given as 100,200, 300, 400 and 500. Find out the consumption schedule and draw the consumption curve.
The consumption schedule
Y (Income) C = 20 + 0.9 Y
0 C=20
100 C=20 + 0.9 (100) = 110
200 C=20 + 0.9 (200) = 200
300 C=20 + 0.9 (300) = 290
400 C=20 + 0.9 (400) = 380
500 C=20 + 0.9 (500) = 470
6. How is equilibrium output of final goods determined under short run fixed price?
Under short run fixed price, equilibrium output and equilibrium demand at fixed price and constant rate of interest can be found with the help of following formulas
Y= ‾A
---------
Y = Value of equilibrium output
__
A = Total Autonomous consumption
b = MPC
__ __ __
Thus, value of equilibrium output (y) depends on values of A (i.e, c + I) and b
i.e AD = AS
__ __
Y= C + I + by
__ __ __
Y = A + by (A = C + I showing total autonomous expenditure)
__
Y – by = A
Y (1-b) = ‾A
Y= ‾A
--------
1-b
Important Questions for Class 12 Economics Determination of Income and Employment
Question. Define consumption function/propensity to consume. What are its types? Also explain its properties.
Answer : The functional relationship between consumption and income is called consumption function. It explains how change in income leads to change in consumption. It is also called propensity to consume.
There are 2 parts of consumption.
1. Autonomous consumption (c̅)- It refers to that consumption which is independent of income level. In other words, it is the minimum consumption at zero income level.
2. Induced consumption (bY)- It refers to that consumption which is directly related to income level. It is obtained by multiplying value of MPC and income level.
Algebraically,
C = c̅ + bY c̅= Autonomous consumption
b= part of increased income spent on consumption
Y= Income
Let c̅ =40, b=60%=0.60
C=40+0.6(Y)
Types of propensity to consume
1. Average propensity to consume- It is the ratio of consumption and income level. It explains how much part of income is spent on consumption at a particular level of income.
APC = C/Y
2. Marginal propensity to consume- It is the ratio of change in consumption to the change in income level. It explains how much part of increased income is spent on consumption.
MPC = ΔC/ΔY
Properties/ Features of consumption function
1. At a very low-income level, consumption may exceed income which indicates dis-savings. So, value of APC will be more than one.2. Ac
cording to psychological law of consumption given by Keynes, increase in income leads to increase in consumption but increase in consumption is always less than increase in income.
Question. Define aggregate supply.
Answer : Aggregate supply is the money value of all the final goods and services to be produced by an economy in a year.
It has two components, i.e. consumption and savings. It is because aggregate supply is equal to national income as whatever value of output is produced, the same is distributed among factors of production in the form of rent, interest, wages and profit and the sum of such factor payment is called national income. This income can either be used for consumption or savings.
So, AS=C+S
AS curve is graphically shown by 45˚ line from origin. It means each point on AS curve is equidistant to x-axis and y-axis which shows equality of income and output.
Question. Define savings function/propensity to save. Explain its types and properties.
Answer : The functional relationship between savings and income level is called saving function. It explains how change in income leads to change in savings. It is also called propensity to save.
Algebraically,
S=Y-C
S=Y-[c̅+bY]
S=-c̅+Y-By
S=-c̅+Y(1-b)
Types of savings function/ Propensity to save
1. Average propensity to save- It is the ratio of savings and income level. It explains how much part of income is saved at a particular level of income.
APS = S/Y
2. Marginal propensity to save- It is the ratio of change in savings to the change in income level. It explains how much part of increased income is saved.
MPS = ΔS/ΔY
Question. Define Aggregate Demand.
Answer :Aggregate Demand refers to total demand of all the final goods and services in an economy in a year. In other words, it refers to that amount which all the buyers in an economy plans to spend on the purchase of goods and services during an accounting year.
Question. What is the relationship between
a) APC and APS
b) MPC and MPS
Answer : A) The sum of APC and APS is always equal to 1
C+S=Y
Dividing both sides by ‘Y’
C/Y+SY/=1
APC+APS=1
B) The sum of MPC and MPS is always equal to 1
C+S=Y
ΔC+ΔS=ΔY
Divide both sides by ‘ΔY’
ΔC/ΔY+ΔS/ΔY=1
MPC+MPS=1
Break-even level/point → Y=C, S=0, APC=1
Question. If consumption function is given as
C=100+0.5(Y)
Show that value of APC decreases as income increases.
Answer :
Can,
APC>1 Yes/No
APC=1 Yes/No
APC<1 Yes/No
APC=0 Yes/No
APC<0 Yes/No
Can,
APS>1 Yes/No
APS=1 Yes/No
APS<1 Yes/No
APS=0 Yes/No
APS<0 Yes/No
Question. What are the components of aggregate demand?
Answer : 1. Household consumption demand- It refers to that amount which all the households plan to spend on the consumption of goods and services in an year to satisfy their individual needs and to increase their living standard.
2. Private investment demand- It refers to that amount which all the producers plan to spend on the purchase of capital assets like machines, building, furniture, tools, etc. for the production of goods and services in an accounting year.
3. Government demand for goods and services- It is the demand by government sector of goods and services for the production of public goods and services for the production of public goods like roads, parks, schools, etc. to satisfy common needs of society of the objective of social welfare.
4. Net exports- It is the difference of exports and imports of a nation during a year. In the other words, it is the excess of demand of domestic goods and services by foreigners over the demand of over the demand of foreign goods and services by domestic nation during a year.
Please click the link below to download pdf file for CBSE Class 12 Ecomonics - Determination of Income and Employment.
Free study material for Economics
CBSE Class 12 Economics Part B Macroeconomics Chapter 4 Determination of Income and Employment Notes
Students can use these Revision Notes for Part B Macroeconomics Chapter 4 Determination of Income and Employment to quickly understand all the main concepts. This study material has been prepared as per the latest CBSE syllabus for Class 12. Our teachers always suggest that Class 12 students read these notes regularly as they are focused on the most important topics that usually appear in school tests and final exams.
NCERT Based Part B Macroeconomics Chapter 4 Determination of Income and Employment Summary
Our expert team has used the official NCERT book for Class 12 Economics to design these notes. These are the notes that definitely you for your current academic year. After reading the chapter summary, you should also refer to our NCERT solutions for Class 12. Always compare your understanding with our teacher prepared answers as they will help you build a very strong base in Economics.
Part B Macroeconomics Chapter 4 Determination of Income and Employment Complete Revision and Practice
To prepare very well for y our exams, students should also solve the MCQ questions and practice worksheets provided on this page. These extra solved questions will help you to check if you have understood all the concepts of Part B Macroeconomics Chapter 4 Determination of Income and Employment. All study material on studiestoday.com is free and updated according to the latest Economics exam patterns. Using these revision notes daily will help you feel more confident and get better marks in your exams.
FAQs
You can download the teacher prepared revision notes for CBSE Class 12 Economics Determination Of Income And Employment Notes Set 01 from StudiesToday.com. These notes are designed as per 2026-27 academic session to help Class 12 students get the best study material for Economics.
Yes, our CBSE Class 12 Economics Determination Of Income And Employment Notes Set 01 include 50% competency-based questions with focus on core logic, keyword definitions, and the practical application of Economics principles which is important for getting more marks in 2026 CBSE exams.
Yes, our CBSE Class 12 Economics Determination Of Income And Employment Notes Set 01 provide a detailed, topic wise breakdown of the chapter. Fundamental definitions, complex numerical formulas and all topics of CBSE syllabus in Class 12 is covered.
These notes for Economics are organized into bullet points and easy-to-read charts. By using CBSE Class 12 Economics Determination Of Income And Employment Notes Set 01, Class 12 students fast revise formulas, key definitions before the exams.
No, all study resources on StudiesToday, including CBSE Class 12 Economics Determination Of Income And Employment Notes Set 01, are available for immediate free download. Class 12 Economics study material is available in PDF and can be downloaded on mobile.