RD Sharma Solutions Class 7 Chapter 22 Data Handling Collection and Organisation of Data

Read RD Sharma Solutions Class 7 Chapter 22 Data Handling Collection and Organisation of Data below, students should study RD Sharma class 7 Mathematics available on Studiestoday.com with solved questions and answers. These chapter wise answers for class 7 Mathematics have been prepared by teacher of Grade 7. These RD Sharma class 7 Solutions have been designed as per the latest NCERT syllabus for class 7 and if practiced thoroughly can help you to score good marks in standard 7 Mathematics class tests and examinations

Exercise 22.1


Question :1. Define the following terms:

(i) Observations

(ii) Data

(iii) Frequency of an observation

(iv) Frequency distribution 

Solution 1:

(i) Observations: The act of paying close attention to someone or something in order to obtain numerical data is known as observation. 

(ii) Data: Data is a term that refers to a series of observations. 

(iii) Frequency of an observation: The frequency of an observation is the number of times it occurs in a given set of data. 

(iv) Frequency distribution: It's a way of viewing raw data in a way that's simple to comprehend.


Question :2. The final marks in Mathematics of 30 students are as follows:

53, 61, 48, 60, 78, 68, 55, 100, 67, 90

75, 88, 77, 37, 84, 58, 60, 48, 62, 56

44, 58, 52, 64, 98, 59, 70, 39, 50, 60

(i) Arrange these marks in the ascending order. 30 to 39 one group, 40 to 49 second group, etc.

(ii) What is the highest score?

(iii) What is the lowest score?

(iv) What is the range?

(v) If 40 is the pass mark how many have failed?

(vi) How many have scored 75 or more?

(vii) Which observations between 50 and 60 have not actually appealed?

(viii) How many have scored less than 50? 

Solution 2:

(i) Groups the number in ascending order:

Group one             30 – 39 -      37, 39
Group two             40 – 49 -      44, 48, 48
Group three           50 – 59 -     50, 52, 53, 55, 56, 58, 58, 59
Group four             60 – 69 -     60, 60, 60, 61, 62, 64, 67, 68
Group five             70 – 79 -     70, 75, 77, 78
Group six              80 – 89 -     84, 88
Group seven         90 – 99 -      90, 98
Group eight          100 – 109 -  100 

(ii) 100 is the highest score.

(iii) 37 is the lowest score.

(iv) Range is = Maximum observation – Minimum observation.

= 100 – 37

= 63.

(v) Just two students have failed if the pass mark is 40.

(vi) 8 students received a score of 75 or higher.

(vii) Between 50 and 60, there are no numbers 51, 54, or 57.

(viii) 5 students received a score of less than 50.


Question :3. The weights of new born babies (in kg) in a hospital on a particular day are as follows:

2.3, 2.2, 2.1, 2.7, 2.6, 3.0, 2.5, 2.9, 2.8, 3.1, 2.5, 2.8, 2.7, 2.9, 2.4

(i) Rearrange the weights in descending order.

(ii) Determine the highest weight.

(iii) Determine the lowest weight.

(iv) Determine the range.

(v) How many babies were born on that day?

(vi) How many babies weigh below 2.5 kg?

(vii) How many babies weigh more than 2.8?

(viii) How many babies weigh 2.8 kg? 

Solution 3:

(i) Descending order of weights:

3.1, 3.0, 2.9, 2.9, 2.8, 2.8, 2.7, 2.7, 2.6, 2.5, 2.5, 2.4, 2.3, 2.2, 2.1

(ii) Highest weight is 3.1 Kg.

(iii) Lowest weight is 2.1 Kg.

(iv) Range = Maximum observation – Minimum observation

= (3.1-2.1) kg

= 1.0 Kg.

(v) On that particular day, 15 babies were born.

(vi) 4 of the babies are under 2.5 kg.

(vii) There are 4 babies weighing more than 2.8 kg.

(viii) There are 2 babies, each weighing 2.8 kg.


Question :4. Following data gives the number of children in 40 families:

1, 2, 6, 5, 1, 5, 1, 3, 2, 6, 2, 3, 4, 2, 0, 0, 4, 4, 3, 2

2, 0, 0, 1, 2, 2, 4, 3, 2, 1, 0, 5, 1, 2, 4, 3, 4, 1, 6, 2

Represent it in the form of a frequency distribution. 

Solution 4:

Required frequency table for given data is:

Number of Children      Frequency
0                                     5
1                                     7
2                                    11
3                                     5
4                                     6
5                                     3
6                                     3


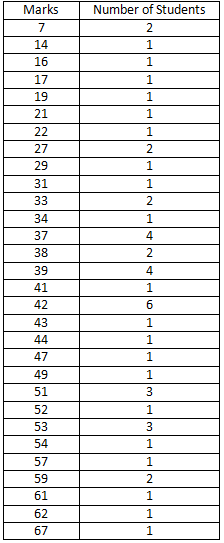
Question :5. Prepare a frequency table of the following scores obtained by 50 students in a test:

42        51       21       42       37       37       42       49       38       52

7          33       17       44       39      7         14        27        39        42

42        62       37       39       67       51       53        53        59        41

29        38       27       31       54        19       53        51        22        61

42        39       59       47       33        34       16        37        57        43   

Solution 5:

Frequency-distribution table for given data:
 RD Sharma Solutions Class 7 Chapter 22 Data Handling Collection and Organisation of Data
 

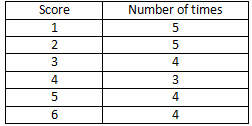
Question :6. A die was thrown 25 times and following scores were obtained:

1          5          2          4          3

6          1          4          2          5

1          6          2          6          3

5          4          1          3          2

3          6          1          5          2

Prepare a frequency table of the scores. 

Solution 6:

Frequency table:

RD Sharma Solutions Class 7 Chapter 22 Data Handling Collection and Organisation of Data


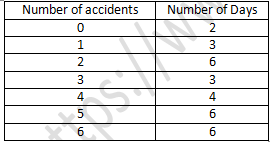
Question :7. In a study of number of accidents per day, the observations for 30 days were obtained as follows:

6          3          5          6          4          3          2          5          4          2

4          2          1          2          2          0          5          4          6          1

6          0          5          3          6          1          5          5          2          6

Prepare a frequency distribution table. 

Solution 7:

Frequency table for given data:

RD Sharma Solutions Class 7 Chapter 22 Data Handling Collection and Organisation of Data


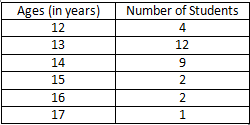
Question :8. Prepare a frequency table of the following ages (in years) of 30 students of class VIII in your school:

13, 14, 13, 12, 14, 13, 14, 15, 13, 14, 13, 14, 16, 12, 14

13, 14, 15, 16, 13, 14, 13, 12, 17, 13, 12, 13, 13, 13, 14 

Solution 8:

Frequency distribution table:

RD Sharma Solutions Class 7 Chapter 22 Data Handling Collection and Organisation of Data


Question :9. Following figures relate the weekly wages (in Rs) of 15 workers in a factory:

300, 250, 200, 250, 200, 150, 350, 200, 250, 200, 150, 300, 150, 200, 250

Prepare a frequency table.

(i) What is the range in wages (in Rs)?

(ii) How many Workers are getting Rs 350?

(iii) How many workers are getting the minimum wages? 

Solution 9:

Frequency distribution table is:

RD Sharma Solutions Class 7 Chapter 22 Data Handling Collection and Organisation of Data 

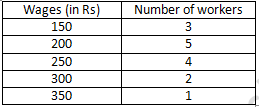
(i) The range in wages = Rs. 350 – Rs. 150 = Rs. 200.

(ii) Only 1 worker is getting Rs. 350.

(iii) 3 employees are paid the minimum wage, which is Rs. 150.


Question :10. Construct a frequency distribution table for the following marks obtained by 25 students in a history test in class VI of a school:

9, 17, 12, 20, 9, 18, 25, 17, 19, 9, 12, 9,12, 18, 17,19, 20,25, 9, 12, 17, 19, 19, 20, 9

(i) What is the range of marks?

(ii) What is the highest mark?

(iii) Which mark is occurring more frequently? 

Solution 10:

Required frequency distribution table is:

RD Sharma Solutions Class 7 Chapter 22 Data Handling Collection and Organisation of Data

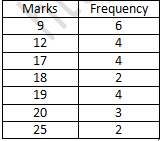
(i) Range of marks: 25 – 9 = 16.

(ii) 25 is the highest mark.

(iii) 9 is occurring more frequently.


Question :11. In a Mathematics test following marks were obtained by 40 students of class VI. Arrange these marks in a table using, tally marks.

8          1          3          7          6          5          5          4          4          2

4          9          5          3          7          1          6          5          2          7

7          3          8          4          2          6          9          5          8          6

7          4          5          6          9          6          4          4          6          6

(i) Find how many students obtained marks equal to or more than 7?

(ii) How many students obtained marks below 4? 

Solution 11:

 RD Sharma Solutions Class 7 Chapter 22 Data Handling Collection and Organisation of Data

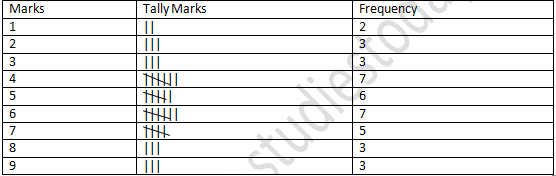
(i) 10 students received a grade of 7 or higher. 

(ii) Only 11 students received a grade of less than four. 


Question :12. Following is the choice of sweets of 30 students of class VI: Ladoo, Barfi, Ladoo, Jalebi, Ladoo, Rasgulla, Jalebi, Ladoo, Barfi, Rasgulla, Ladoo, Jalebi, Jalebi, Rasgulla, Ladoo, Rasgulla, Jalebi, Ladoo, Rasgulla, Ladoo, Rasgulla, Jalebi, Ladoo, Rasgulla, Ladoo, Ladoo, Barfi, Rasgulla. Rasgulla, Ladoo. 

(i) Arrange the names of sweets in a table using tally marks. 

(ii) Which sweet is preferred by most of the students? 

Solution 12:

RD Sharma Solutions Class 7 Chapter 22 Data Handling Collection and Organisation of Data


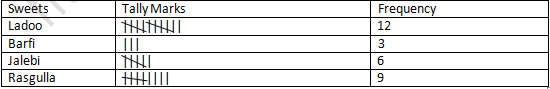
(ii) The majority of the 12 students prefer ladoo.


NCERT Exemplar Solutions Class 7 Maths Algebraic Expressions
NCERT Exemplar Solutions Class 7 Maths Comparing Quantities
NCERT Exemplar Solutions Class 7 Maths Data Handling
NCERT Exemplar Solutions Class 7 Maths Exponents and Powers
NCERT Exemplar Solutions Class 7 Maths Fractions and Decimals
NCERT Exemplar Solutions Class 7 Maths Integers
NCERT Exemplar Solutions Class 7 Maths Lines and Angles
NCERT Exemplar Solutions Class 7 Maths Perimeter and Area
NCERT Exemplar Solutions Class 7 Maths Practical Geometry
NCERT Exemplar Solutions Class 7 Maths Rational Numbers
NCERT Exemplar Solutions Class 7 Maths Simple Equation
NCERT Exemplar Solutions Class 7 Maths Triangles and Its Properties
RS Aggarwal Class 7 Mathematics Solutions Chapter 1 Integers
RS Aggarwal Class 7 Mathematics Solutions Chapter 2 Fractions
RS Aggarwal Class 7 Mathematics Solutions Chapter 3 Decimals
RS Aggarwal Class 7 Mathematics Solutions Chapter 4 Rational Numbers
RS Aggarwal Class 7 Mathematics Solutions Chapter 5 Exponents
RS Aggarwal Class 7 Mathematics Solutions Chapter 6 Algebraic Expressions
RS Aggarwal Class 7 Mathematics Solutions Chapter 7 Linear Equations in One Variable
RS Aggarwal Class 7 Mathematics Solutions Chapter 8 Ratio and Proportion
RS Aggarwal Class 7 Mathematics Solutions Chapter 9 Unitary Method
RS Aggarwal Class 7 Mathematics Solutions Chapter 10 Percentage
RS Aggarwal Class 7 Mathematics Solutions Chapter 11 Profit and Loss
RS Aggarwal Class 7 Mathematics Solutions Chapter 12 Simple Interest
RS Aggarwal Class 7 Mathematics Solutions Chapter 13 Lines and Angles
RS Aggarwal Class 7 Mathematics Solutions Chapter 14 Properties of Parallel Lines
RS Aggarwal Class 7 Mathematics Solutions Chapter 15 Properties of Triangles
RS Aggarwal Class 7 Mathematics Solutions Chapter 16 Congruence
RS Aggarwal Class 7 Mathematics Solutions Chapter 17 Constructions
RS Aggarwal Class 7 Mathematics Solutions Chapter 18 Reflection and Rotational Symmetry
RS Aggarwal Class 7 Mathematics Solutions Chapter 19 Three-Dimensional Shapes
RS Aggarwal Class 7 Mathematics Solutions Chapter 20 Mensuration
RS Aggarwal Class 7 Mathematics Solutions Chapter 21 Collection and Organisation of Data
RS Aggarwal Class 7 Mathematics Solutions Chapter 22 Bar Graph
RS Aggarwal Class 7 Mathematics Solutions Chapter 23 Probability
RD Sharma Solutions Class 7 Maths
RD Sharma Solutions Class 7 Chapter 1 Integers
RD Sharma Solutions Class 7 Chapter 2 Fraction
RD Sharma Solutions Class 7 Chapter 3 Decimals
RD Sharma Solutions Class 7 Chapter 4 Rational Numbers
RD Sharma Solutions Class 7 Chapter 5 Operation on Decimal Numbers
RD Sharma Solutions Class 7 Chapter 6 Exponents
RD Sharma Solutions Class 7 Chapter 7 Algebraic Expressions
RD Sharma Solutions Class 7 Chapter 8 Linear Equations in One Variable
RD Sharma Solutions Class 7 Chapter 9 Ratio and Proportion
RD Sharma Solutions Class 7 Chapter 10 Unitary Method
RD Sharma Solutions Class 7 Chapter 11 Percentage
RD Sharma Solutions Class 7 Chapter 12 Profit and Loss
RD Sharma Solutions Class 7 Chapter 13 Simple Interest
RD Sharma Solutions Class 7 Chapter 14 Line and Angles
RD Sharma Solutions Class 7 Chapter 15 Properties of Triangle
RD Sharma Solutions Class 7 Chapter 16 Congruence
RD Sharma Solutions Class 7 Chapter 17 Constructions
RD Sharma Solutions Class 7 Chapter 18 Symmetry
RD Sharma Solutions Class 7 Chapter 19 Visualising Solid Shapes
RD Sharma Solutions Class 7 Chapter 20 Mensuration Perimeter and Area of Rectilinear Figures
RD Sharma Solutions Class 7 Chapter 21 Mensuration Area of Circle
RD Sharma Solutions Class 7 Chapter 22 Data Handling Collection and Organisation of Data
RD Sharma Solutions Class 7 Chapter 23 Data Handling Central Values
RD Sharma Solutions Class 7 Chapter 24 Data Handling Constructions of Bar Graph
RD Sharma Solutions Class 7 Chapter 25 Data Handling Probability
RS Aggarwal Class 7 Mathematics Solutions
RS Aggarwal Class 7 Mathematics Solutions Chapter 1 Integers
RS Aggarwal Class 7 Mathematics Solutions Chapter 2 Fractions
RS Aggarwal Class 7 Mathematics Solutions Chapter 3 Decimals
RS Aggarwal Class 7 Mathematics Solutions Chapter 4 Rational Numbers
RS Aggarwal Class 7 Mathematics Solutions Chapter 5 Exponents
RS Aggarwal Class 7 Mathematics Solutions Chapter 6 Algebraic Expressions
RS Aggarwal Class 7 Mathematics Solutions Chapter 7 Linear Equations in One Variable
RS Aggarwal Class 7 Mathematics Solutions Chapter 8 Ratio and Proportion
RS Aggarwal Class 7 Mathematics Solutions Chapter 9 Unitary Method
RS Aggarwal Class 7 Mathematics Solutions Chapter 10 Percentage
RS Aggarwal Class 7 Mathematics Solutions Chapter 11 Profit and Loss
RS Aggarwal Class 7 Mathematics Solutions Chapter 12 Simple Interest
RS Aggarwal Class 7 Mathematics Solutions Chapter 13 Lines and Angles
RS Aggarwal Class 7 Mathematics Solutions Chapter 14 Properties of Parallel Lines
RS Aggarwal Class 7 Mathematics Solutions Chapter 15 Properties of Triangles
RS Aggarwal Class 7 Mathematics Solutions Chapter 16 Congruence
RS Aggarwal Class 7 Mathematics Solutions Chapter 17 Constructions
RS Aggarwal Class 7 Mathematics Solutions Chapter 18 Reflection and Rotational Symmetry
RS Aggarwal Class 7 Mathematics Solutions Chapter 19 Three-Dimensional Shapes
RS Aggarwal Class 7 Mathematics Solutions Chapter 20 Mensuration
RS Aggarwal Class 7 Mathematics Solutions Chapter 21 Collection and Organisation of Data
RS Aggarwal Class 7 Mathematics Solutions Chapter 22 Bar Graph
RS Aggarwal Class 7 Mathematics Solutions Chapter 23 Probability