
Exercise 24.1
Question :1. Two hundred students of class VI and VII were asked to name their favorite colours so as to decide upon what should be the colour of their school house. The results are shown in the following table.
![]()
Represent the given data on a bar graph.
(i) Which is the most preferred colour and which is the least?
(ii) How many colours are there in all?
Solution 1:
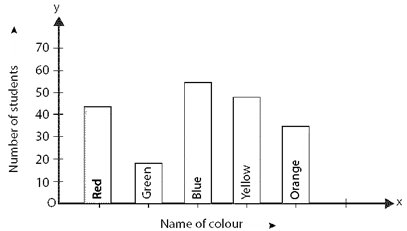
Construction of bar graph:
1. Name the colour on the horizontal axis OX, and the number of students on the vertical axis OY.
2. Choose bars of uniform (equal) width with a uniform distance between them along the horizontal axis OX.
3. Determine the heights of the bars using an appropriate scale based on the amount of space available for the graph. We've chosen one small division to serve 10 students in this case.
(i) Blue is the most preferred colour and green is the least preferred.
(ii) There are 5 colours.
Question :2. Following data gives total marks (out of 600) obtained by six children of a particular class.
![]()
Represent the data by a bar graph
Solution 2:
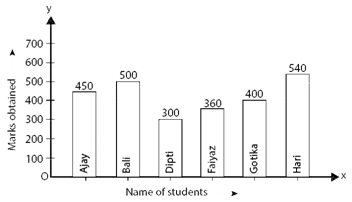
Construction of bar graph:
1. Label the horizontal axis OX with the students' names and the vertical axis OY with the marks earned.
2. Select bars of uniform (equal) width with a uniform distance between them along the horizontal axis OX.
3. Calculate the heights of the bars using a suitable scale based on the amount of space available for the graph. We've chosen one small division to represent 100 marks in this case.
Question :3. Number of children in six different classes are given below. Represent the data on a bar graph.
![]()
(i) How do you choose the scale.
(ii) Which class has the maximum number of children?
(iii) Which class has the minimum number of children?
Solution 3:
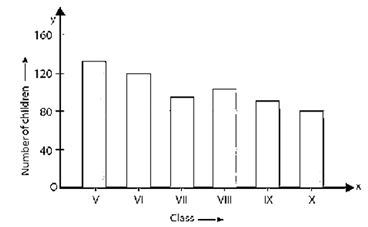
Construction of bar graph:
1. Label the horizontal axis OX as Class and the vertical axis OY as Number of Children.
2. Choose bars of uniform (equal) width with a uniform distance between them along the horizontal axis OX.
3. Determine the heights of the bars using an appropriate scale based on the amount of space available for the graph. Here, we choose 1 big division to represent 40 children.
(i) To represent 40 children, we chose one big.
(ii)Class V has the largest number of students.
(iii) Class X has the minimum of students.
Question :4. The performance of students in 1st term and 2nd term is as given below. Draw a double bar graph choosing appropriate scale and answer the following:

(i) In which subject, has the children improved their performance the most?
(ii) Has the performance gone down in any subject?
Solution 4:

Construction of bar graph:
1. Label the vertical axis OY as Marks and the horizontal axis OX as Subject.
2. Select uniform (equal) width bars with a uniform distance between them along the horizontal axis OX.
3. Determine the heights of the bars using an appropriate scale based on the graph's available space. We've chosen one large division to reflect 10 points.
(i) In Maths, the students showed their greatest improvement.
(ii) in Hindi, the students showed their worst performance.
Question :5. Consider the following data gathered from a survey of a colony:

Draw a double bar graph choosing an appropriate scale. What do you infer from the bar graph?
(i) Which sport is most popular?
(ii) What is more preferred watching or participating in sports?
Solution 5:

Construction of graph:
1. Mark the vertical axis OY as Number of People and the horizontal axis OX as Favorite Sports.
2. Select bars of uniform (equal) width with a uniform distance between them along the horizontal axis OX.
3. Calculate the heights of the bars using a suitable scale based on the amount of space available for the graph. We chose two large divisions to serve 400 people in this case.
(i) Most popular sport is the Cricket.
(ii) Participation is favored over watching.
Question :6. The production of saleable steel in some of the steel plants of our country during 1999 is given below:
![]()
Construct a bar graph to represent the above data on a graph paper by using the scale 1 big division = 20 thousand tonnes.
Solution 6:
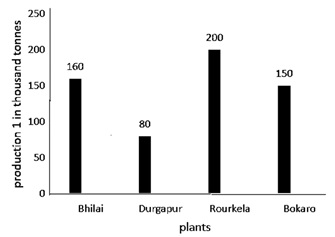
Construction of graph:
1. Mark the vertical axis OY as Output and the horizontal axis OX as Name of the Steel Plant (in thousand tonnes).
2. Select bars of uniform (equal) width with a uniform distance between them along the horizontal axis OX.
3. Calculate the heights of the bars using a suitable scale based on the amount of space available for the graph. We've chosen one large division to cover 20,000 tonnes.
Question :7. The following data gives the number (in thousands) of applicants registered with an Employment Exchange during, 1995-2000:
![]()
Construct a bar graph to represent the above data.
Solution 7:
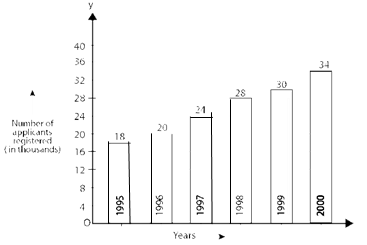
Steps of constructing graph:
1. Mark the vertical axis OY as Number of Applicants Registered and the horizontal axis OX as Years (in thousands).
2. Select bars of uniform (equal) width with a uniform distance between them along the horizontal axis OX.
3. Calculate the heights of the bars using a suitable scale based on the amount of space available for the graph. We've chosen one large division to represent the 4000 applicants.
Question :8. The following table gives the route length (in thousand kilometres) of the Indian Railways in some of the years:
![]()
Represent the above data with the help of a bar graph.
Solution 8:
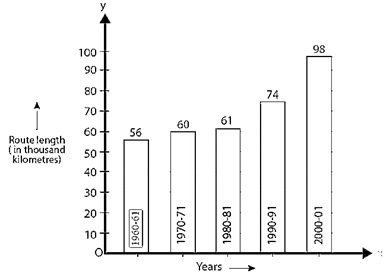
Construction of graph:
1. Mark the vertical axis OY as Route Length and the horizontal axis OX as Years (in thousand kilometres).
2. Select bars of uniform (equal) width with a uniform distance between them along the horizontal axis OX.
3. Calculate the heights of the bars using a suitable scale based on the amount of space available for the graph. We've chosen one large division to denote 10000 kilometres.
Question :9. The following data gives the amount of loans (in crores of rupees) disbursed by a bank during some years:
![]()
(i) Represent the above data with the help of a bar graph.
(ii) With the help of the bar graph, indicate the year in which amount of loan is not increased over that of the preceding year.
Solution 9:
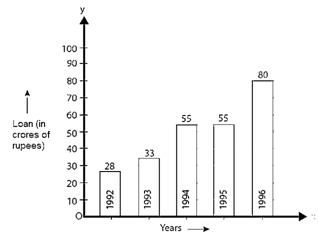
Construction of graph:
1. Mark the vertical axis OY as Loan and the horizontal axis OX as Years (in crores of rupees).
2. Select bars of uniform (equal) width with a uniform distance between them along the horizontal axis OX.
3. Calculate the heights of the bars using a suitable scale based on the amount of space available for the graph. We'll use one major division to reflect ten crores of rupees in this example.
(ii) The loan volume was not raised in 1995 compared to the previous year.
Question :10. The following table shows the interest paid by a company (in lakhs):
![]()
Draw the bar graph to represent the above information.
Solution 10:
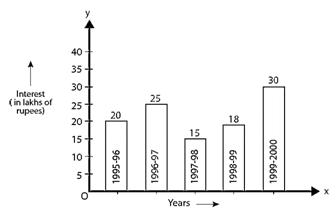
Construction of graph:
1. Mark the vertical axis OY as Interest and the horizontal axis OX as Years (in lakhs of rupees).
2. Select bars of uniform (equal) width with a uniform distance between them along the horizontal axis OX.
3. Calculate the heights of the bars using a suitable scale based on the amount of space available for the graph. To reflect 5 lakhs rupees, we chose one large division.
Question :11. The following data shows the average age of men in various countries in a certain year:
![]()
Represent the above information by a bar graph.
Solution 11:

Steps of constructing graph:
1. Mark the vertical axis OY as Average Age of Men and the horizontal axis OX as Countries (in years).
2. Select bars of uniform (equal) width with a uniform distance between them along the horizontal axis OX.
3. Calculate the heights of the bars using a suitable scale based on the amount of space available for the graph. We've chosen one large division to cover ten years.
Question :12. The following data gives the production of food grains (in thousand tonnes) for some years:
![]()
Represent the above data with the help of a bar graph.
Solution 12:

Construction of bar graph:
Make the horizontal axis OX represent years and the vertical axis OY represent food grain production (in thousand tonnes).
2. Select bars of uniform (equal) width with a uniform distance between them along the horizontal axis OX.
3. Calculate the heights of the bars using a suitable scale based on the amount of space available for the graph. We've chosen one large division to cover 20,000 tonnes.
Question :13. The following data gives the amount of manure (in thousand tonnes) manufactured by a company during some years:
![]()
(i) Represent the above data with the help of bar graph.
(ii) Indicate with the help of the bar graph the year in which the amount of manure manufactured by the company was maximum.
(iii) Choose the correct alternative:
The consecutive years during which there was maximum decrease in manure production are:
(a) 1994 and 1995 (b) 1992 and 1993
(c) 1996 and 1997 (d) 1995 and 1996
Solution 13:
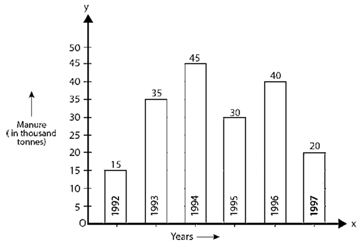
Construction of graph:
1. Mark the vertical axis OY as Manure and the horizontal axis OX as Years (in thousand tonnes).
2. Select bars of uniform (equal) width with a uniform distance between them along the horizontal axis OX.
3. Calculate the heights of the bars using a suitable scale based on the amount of space available for the graph. We've chosen one large division to cover 5,000 tonnes.
(ii) In 1994, the amount of manure produced by the company was at its peak.
(iii) The years 1996 and 1997.