

Official CBSE Study Materials for Class 9 Mathematics
Access comprehensive study materials and useful resources for Chapter 14 Statistics using the CBSE Class 9 Statistics Sure Shot Questions. Designed to align with the 2026-27 CBSE academic guidelines, these advanced resources help Class 9 Mathematics students reinforce core concepts beyond standard textbooks.
Advanced Resources for Mathematics
Access the complete useful resource PDF for Class 9 Mathematics below. Regular practice with these targeted academic notes builds familiarity with complex topics and helps secure higher marks in final school evaluations.
CBSE Class 9 Statistics Sure Shot Questions. There are many more useful educational material which the students can download in pdf format and use them for studies. Study material like concept maps, important and sure shot question banks, quick to learn flash cards, flow charts, mind maps, teacher notes, important formulas, past examinations question bank, important concepts taught by teachers. Students can download these useful educational material free and use them to get better marks in examinations. Also refer to other worksheets for the same chapter and other subjects too. Use them for better understanding of the subjects.

CBSE Class 9 Statistics Sure Shot Questions
PRACTICE QUESTIONS - CLASS IX: CHAPTER 14 - STATISTICS
- Find the true class limits of the first two classes of the distribution 1–9, 10–19, 20–29, ..........
- The following are the marks obtained by 20 students in a class-test:
40, 22, 36, 27, 30, 12, 15, 20, 25, 31, 34, 36, 39, 41, 43, 48, 46, 36, 37, 40
Arrange the above data in frequency distribution with equal classes, one of them being (0–10), 10 not included. - The electricity bills of twenty house holds in a locality are as follows:
370, 410, 520, 270, 810, 715, 1080, 712, 802, 775, 310, 375, 412, 420, 370, 218, 240, 250, 610, 570. Construct a frequency distribution table with class size 100. - The enrolment in classes VI to X of a school is given below:
Draw a bar chart to depict the data.Class VI VII VIII IX X Enrolment 70 65 60 45 35 - Draw a histogram and a frequency polygon for the following data:
Marks 10-20 20-30 30-40 40-50 50-60 No. of students 8 12 15 9 6 - Draw a histogram for the following data:
Classes 10-15 15-20 20-30 30-50 50-80 Frequency 6 10 10 8 18 - Find the mean of the following data:
153, 140, 148, 150, 154, 142, 146, 147 - The mean of the following data is 37. Find x
28, 35, 25, 32, x, 40, 45, 50 - If the mean of n observation 2x_1, 2x_2, ........, 2x_n is \(2\overline{x}\), show that \(\sum_{i=1}^{n}(x_i-2\overline{x})=0\)
- The mean of 20 observations is 25. If each observation is multiplied by 2, then find the mean of new observations.
- The means of two groups of 15 and 20 observations are 20 and 25 respectively. Find the mean of all the 35 observations.
- If the mode of the following data is 14, find the value of x
10, 12, 14, 15, 16, 14, 15, 14, 15, x, 16, 14, 16 - The median of the observations, arranged in increasing order is 26. Find the value of x.
10, 17, 22, x + 2, x + 4, 30, 36, 40 - Find the mode of 14, 25, 14, 28, 18, 17, 18, 14, 23, 22, 14, 18.
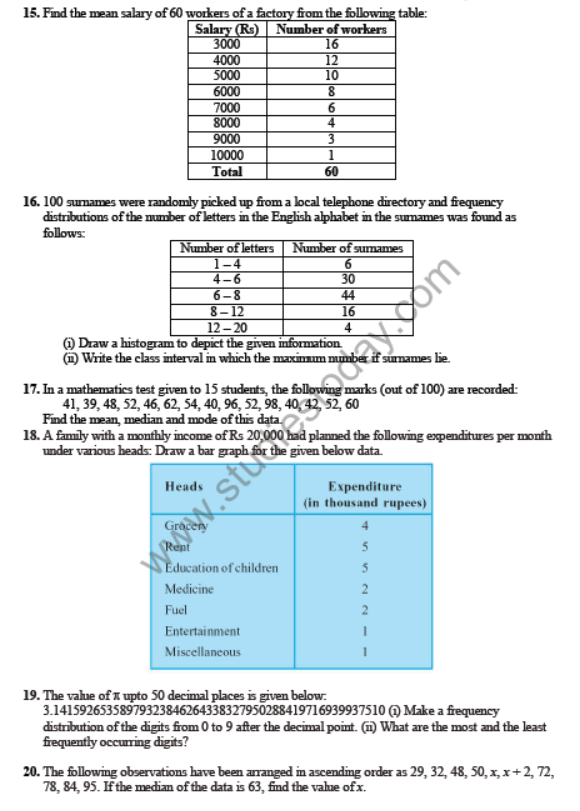
- Find the mean salary of 60 workers of a factory from the following table:
Salary (Rs) Number of workers 3000 16 4000 12 5000 10 6000 8 7000 6 8000 4 9000 3 10000 1 Total 60 - 100 surnames were randomly picked up from a local telephone directory and frequency distributions of the number of letters in the English alphabet in the surnames was found as follows:
(i) Draw a histogram to depict the given information.Number of letters Number of surnames 1 – 4 6 4 – 6 30 6 – 8 44 8 – 12 16 12 – 20 4
(ii) Write the class interval in which the maximum number if surnames lie. - In a mathematics test given to 15 students, the following marks (out of 100) are recorded:
41, 39, 48, 52, 46, 62, 54, 40, 96, 52, 98, 40, 42, 52, 60
Find the mean, median and mode of this data. - A family with a monthly income of Rs 20,000 had planned the following expenditures per month under various heads: Draw a bar graph for the given below data.
Heads Expenditure (in thousand rupees) Grocery 4 Rent 5 Education of children 5 Medicine 2 Fuel 2 Entertainment 1 Miscellaneous 1 - The value of \(\pi\) upto 50 decimal places is given below:
3.14159265358979323846264338327950288419716939937510
(i) Make a frequency distribution of the digits from 0 to 9 after the decimal point. (ii) What are the most and the least frequently occurring digits? - The following observations have been arranged in ascending order as 29, 32, 48, 50, x, x + 2, 72, 78, 84, 95. If the median of the data is 63, find the value of x.
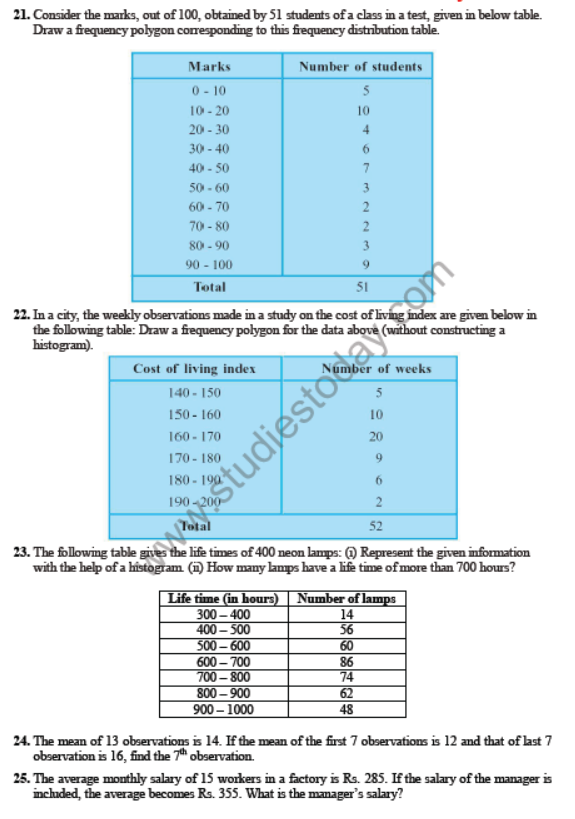
- Consider the marks, out of 100, obtained by 51 students of a class in a test, given in below table. Draw a frequency polygon corresponding to this frequency distribution table.
Marks Number of students 0 - 10 5 10 - 20 10 20 - 30 4 30 - 40 6 40 - 50 7 50 - 60 3 60 - 70 2 70 - 80 2 80 - 90 3 90 - 100 9 Total 51 - In a city, the weekly observations made in a study on the cost of living index are given below in the following table: Draw a frequency polygon for the data above (without constructing a histogram).
Cost of living index Number of weeks 140 - 150 5 150 - 160 10 160 - 170 20 170 - 180 9 180 - 190 6 190 - 200 2 Total 52 - The following table gives the life times of 400 neon lamps: (i) Represent the given information with the help of a histogram. (ii) How many lamps have a life time of more than 700 hours?
Life time (in hours) Number of lamps 300 – 400 14 400 – 500 56 500 – 600 60 600 – 700 86 700 – 800 74 800 – 900 62 900 – 1000 48 - The mean of 13 observations is 14. If the mean of the first 7 observations is 12 and that of last 7 observation is 16, find the 7th observation.
- The average monthly salary of 15 workers in a factory is Rs. 285. If the salary of the manager is included, the average becomes Rs. 355. What is the manager’s salary?
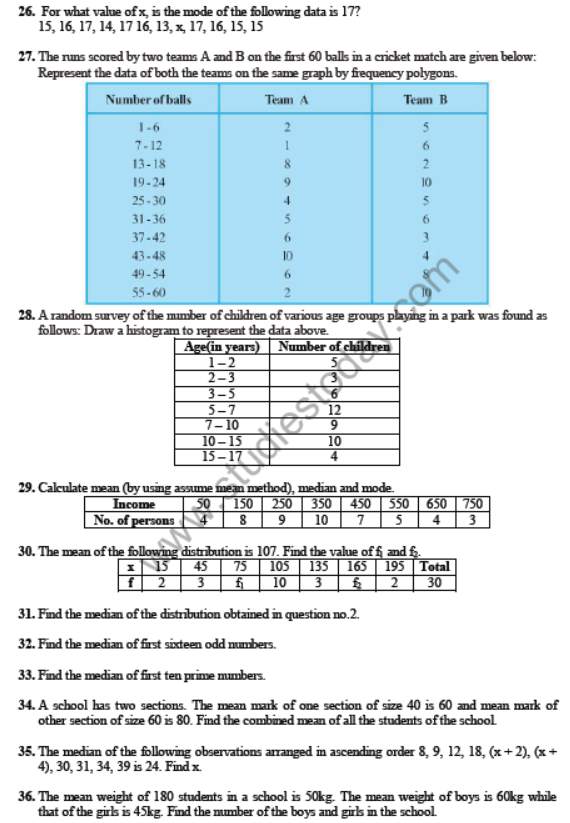
- For what value of x, is the mode of the following data is 17?
15, 16, 17, 14, 17 16, 13, x, 17, 16, 15, 15 - The runs scored by two teams A and B on the first 60 balls in a cricket match are given below: Represent the data of both the teams on the same graph by frequency polygons.
Number of balls Team A Team B 1 - 6 2 5 7 - 12 1 6 13 - 18 8 2 19 - 24 9 10 25 - 30 4 5 31 - 36 5 6 37 - 42 6 3 43 - 48 10 4 49 - 54 6 8 55 - 60 2 10 - A random survey of the number of children of various age groups playing in a park was found as follows: Draw a histogram to represent the data above.
Age(in years) Number of children 1 – 2 5 2 – 3 3 3 – 5 6 5 – 7 12 7 – 10 9 10 – 15 10 15 – 17 4 - Calculate mean (by using assume mean method), median and mode.
Income 50 150 250 350 450 550 650 750 No. of persons 4 8 9 10 7 5 4 3 - The mean of the following distribution is 107. Find the value of f1 and f2.
x 15 45 75 105 135 165 195 Total f 2 3 f1 10 3 f2 2 30 - Find the median of the distribution obtained in question no.2.
- Find the median of first sixteen odd numbers.
- Find the median of first ten prime numbers.
- A school has two sections. The mean mark of one section of size 40 is 60 and mean mark of other section of size 60 is 80. Find the combined mean of all the students of the school.
- The median of the following observations arranged in ascending order 8, 9, 12, 18, (x + 2), (x + 4), 30, 31, 34, 39 is 24. Find x.
- The mean weight of 180 students in a school is 50kg. The mean weight of boys is 60kg while that of the girls is 45kg. Find the number of the boys and girls in the school.
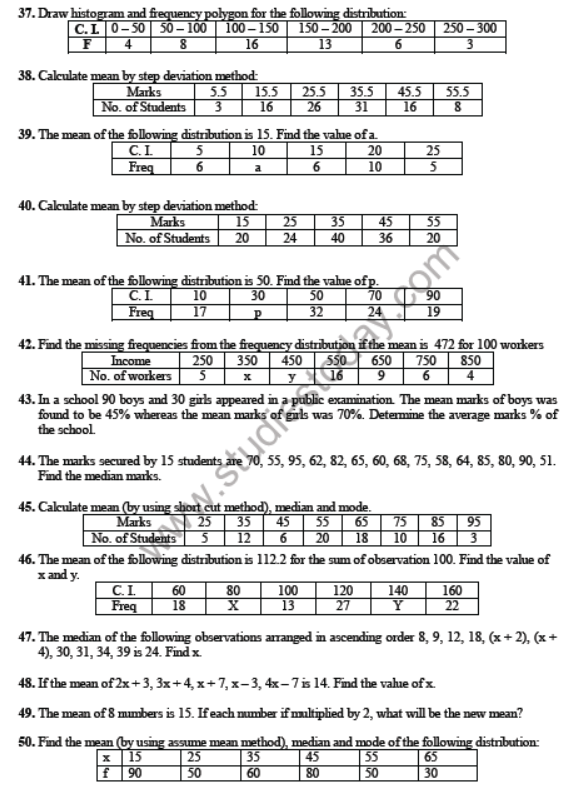
- Draw histogram and frequency polygon for the following distribution:
C. I. 0 – 50 50 – 100 100 – 150 150 – 200 200 – 250 250 – 300 F 4 8 16 13 6 3 - Calculate mean by step deviation method:
Marks 5.5 15.5 25.5 35.5 45.5 55.5 No. of Students 3 16 26 31 16 8 - The mean of the following distribution is 15. Find the value of a.
C. I. 5 10 15 20 25 Freq 6 a 6 10 5 - Calculate mean by step deviation method:
Marks 15 25 35 45 55 No. of Students 20 24 40 36 20 - The mean of the following distribution is 50. Find the value of p.
C. I. 10 30 50 70 90 Freq 17 p 32 24 19 - Find the missing frequencies from the frequency distribution if the mean is 472 for 100 workers
Income 250 350 450 550 650 750 850 No. of workers 5 x y 16 9 6 4 - In a school 90 boys and 30 girls appeared in a public examination. The mean marks of boys was found to be 45% whereas the mean marks of girls was 70%. Determine the average marks % of the school.
- The marks secured by 15 students are 70, 55, 95, 62, 82, 65, 60, 68, 75, 58, 64, 85, 80, 90, 51. Find the median marks.
- Calculate mean (by using short cut method), median and mode.
Marks 25 35 45 55 65 75 85 95 No. of Students 5 12 6 20 18 10 16 3 - The mean of the following distribution is 112.2 for the sum of observation 100. Find the value of x and y.
C. I. 60 80 100 120 140 160 Freq 18 X 13 27 Y 22 - The median of the following observations arranged in ascending order 8, 9, 12, 18, (x + 2), (x + 4), 30, 31, 34, 39 is 24. Find x.
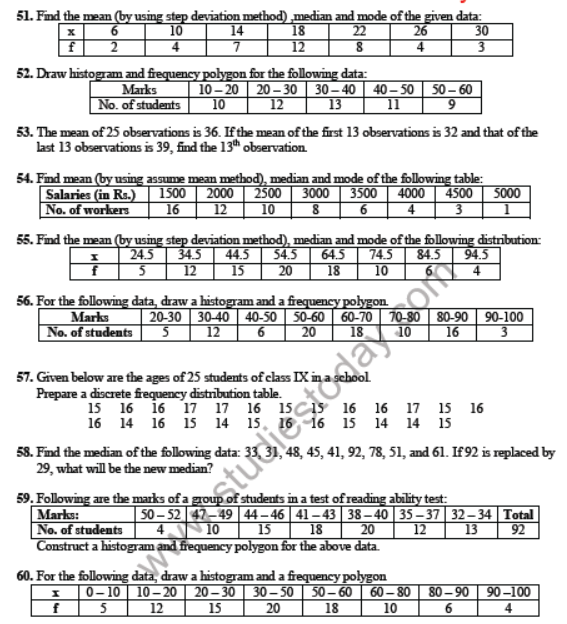
- If the mean of 2x + 3, 3x + 4, x + 7, x – 3, 4x – 7 is 14. Find the value of x.
- The mean of 8 numbers is 15. If each number if multiplied by 2, what will be the new mean?
- Find the mean (by using assume mean method), median and mode of the following distribution:
x 15 25 35 45 55 65 f 90 50 60 80 50 30 - Find the mean (by using step deviation method) ,median and mode of the given data:
x 6 10 14 18 22 26 30 f 2 4 7 12 8 4 3 - Draw histogram and frequency polygon for the following data:
Marks 10 – 20 20 – 30 30 – 40 40 – 50 50 – 60 No. of students 10 12 13 11 9 - The mean of 25 observations is 36. If the mean of the first 13 observations is 32 and that of the last 13 observations is 39, find the 13th observation.
- Find mean (by using assume mean method), median and mode of the following table:
Salaries (in Rs.) 1500 2000 2500 3000 3500 4000 4500 5000 No. of workers 16 12 10 8 6 4 3 1 - Find the mean (by using step deviation method), median and mode of the following distribution:
x 24.5 34.5 44.5 54.5 64.5 74.5 84.5 94.5 f 5 12 15 20 18 10 6 4 - For the following data, draw a histogram and a frequency polygon.
Marks 20-30 30-40 40-50 50-60 60-70 70-80 80-90 90-100 No. of students 5 12 6 20 18 10 16 3 - Given below are the ages of 25 students of class IX in a school. Prepare a discrete frequency distribution table.
15 16 16 17 17 16 15 15 16 16 17 15 16
16 14 16 15 14 15 16 16 15 14 14 15 - Find the median of the following data: 33, 31, 48, 45, 41, 92, 78, 51, and 61. If 92 is replaced by 29, what will be the new median?
- Following are the marks of a group of students in a test of reading ability test:
Construct a histogram and frequency polygon for the above data.Marks: 50 – 52 47 – 49 44 – 46 41 – 43 38 – 40 35 – 37 32 – 34 Total No. of students 4 10 15 18 20 12 13 92 - For the following data, draw a histogram and a frequency polygon
x 0 – 10 10 – 20 20 – 30 30 – 50 50 – 60 60 – 80 80 – 90 90 –100 f 5 12 15 20 18 10 6 4
Free study material for Mathematics
Mathematics Class 9 Exam Resources: Chapter 14 Statistics
Comprehensive Study Resources for Chapter 14 Statistics
Access comprehensive study material for Chapter 14 Statistics, including revision notes, concept maps, and high-probability questions. These resources are designed in alignment with the latest 2026 CBSE syllabus for Class 9 Mathematics to support effective exam preparation.
Understanding Marking Schemes
Built using official NCERT guidelines for Class 9 Mathematics, these materials provide reliable academic support. Integrating past examination questions and step-by-step solutions helps students understand official CBSE grading criteria.
Complete Revision for Mathematics
Wrap up your chapter revision by testing your knowledge against standard objective question formats. Explore our full library of free, up-to-date sample papers and online assessments to secure top grades in your CBSE examinations.
FAQs
Our advanced study package for Chapter 14 Statistics includes detailed concepts, diagrams, Mind Maps, and explanation of complex topics to ensure Class 9 students learn as per syllabus for 2026 exams.
The Mind Maps provided for Chapter 14 Statistics act as visual anchors which will help faster recall during high-pressure exams.
Yes, teachers use our Class 9 Mathematics resources for lesson planning as they are in simple language and have lot of solved examples.
Yes, You can download the complete, mobile-friendly PDF of the Mathematics Chapter 14 Statistics advanced resources for free.
Yes, our subject matter experts have updated the Chapter 14 Statistics material to align with the rationalized NCERT textbooks and have removed deleted topics and added new competency-based questions.