
Access and download CBSE Class 11 Economics Question Paper Set 21 Solved, carefully designed as per the latest 2026-27 examination guidelines issued by CBSE, NCERT, and KVS. These Class 11 Economics previous year question papers include detailed solutions, helping students to assess their performance and identify and improve key areas before the final exams.
Solved Economics Question Papers for Class 11
Practicing these Class 11 Economics question papers is the best way to understand the actual exam pattern and marking scheme. By solving these papers under timed conditions, Class 11 students can improve their speed and accuracy. Download the full CBSE Class 11 Economics Question Paper Set 21 Solved to begin your self-assessment today.
Economics Class 11 Question Paper PDF with Solutions
PART A - MICRO ECONOMICS
1 If with rise in price of good Y, demand for good X rises, the two goods are: (Choose the correct alternative)
A. Substitute goods
B. Complementary goods
C. Not at all related
D. Jointly demanded
2 A budget line of the consumer becomes steeper (slope increases) when: (Choose the correct alternative)
A. Income of the consumer decreases
B. Price of good1 increases
C. Price of good 1 decreases
D. Prices of both good1 and good2 increase in the same proportion
3 Define price elasticity of demand.
OR
Define demand for a good.
4 What happens to Total Fixed Cost when firm increases the level of output?
OR
Why does Average Variable Cost diminish in the initial stage of production?
5 A firm supplies 1000 units of a good at a price of Rs.10 per unit. Its price elasticity of supply is 2. How many units of this good will the firm supply if price decreases to Rs. 8 per unit?
6 Discuss the nature of total revenue curve of a firm if the firm is functioning under a perfectly competitive market.
OR
Discuss the implication behind the feature of ‘perfect freedom of entry and exit’ of firms under perfect competition.
7 Define a Production Possibility Curve. How does it explain the problem of choice? Explain using a diagram
OR
Define Marginal Rate of Transformation. How does it influence the shape of production possibility curve? Show with diagrams.
8 Using suitable diagram explain the effect on demand for a good when:
a. Price of its substitute good rises.
b. Price of its complementary good rises.
9 Answer the following:
a. Give two points of similarities between Monopolistic competition and Perfect competition
b. Give two points of distinction between Monopoly market and Oligopoly market.
10 Briefly explain the theory of optimal choice of the consumer using budget line and indifference curve.
11 Why should Marginal Revenue be equal to Marginal Cost at equilibrium level of output of a firm? Explain using suitable diagram.
12 Consider the market for Tea in terms of its market price and quantity exchanged. Explain the possible impact on its market price and quantity exchanged when market price of coffee rises. Use diagram.
OR
In the recent budget government decided to fix a floor price of paddy by 50% above the market price. What could be the purpose behind this policy? What are the possible consequences of the policy? Explain using a diagram.
PART - B – STATISTICS
13 Statistical calculation of a classified data is based on: (Choose correct answer)
A. Actual values of observations
B. The upper class limits
C. The lower class limits
D. The class mid points
14 State one difference between a discrete variable and a continuous variable
OR
How is chronological classification different from Spatial classification of data?
15 Define Inter Quartile Range.
16 Interpret the value of ‘r=+1’ in the case of coefficient of correlation.
OR
Interpret the result if all the dots in a scatter diagram lie on an upward sloping straight line.
17 The subject economics involves the study of man engaged in economic activities of various kinds. These economic activities are broadly classified under three heads. What are these? State with meaning.
18 Calculate Arithmetic Mean for the following distribution.
![]()
Calculate First Quartile, Second Quartile and Third Quartile for the following distribution
![]()
19 The most common type of instrument used in surveys to collect information or data is questionnaire. The success of any statistical investigation is determined by the quality of the questionnaire and the response that evoke from the respondents. What are the essential characteristics of a good questionnaire?
OR
It is stated that ‘Non Sampling errors’ are more serious than ‘Sampling errors’. Why? What are the possible non sampling errors? Explain with meaning.
20 Draw a pie diagram for the following information regarding expected expenditure allocated for the different sub-sectors of Primary sector of the economy in the recent budget.
Sectors Expenditure (Rs. Crores)
Agriculture 2800
Animal Husbandry 2500
Fisheries 1400
Forestry and Logging 1200
Mining and Quarrying 2100
21 Find product moment correlation using the method of Karl Pearson’s coefficient of correlation for the following data related Length and weight.
![]()
22 Calculate the value of Median and locate the same on a graph and verify the result.
![]()
23 Calculate Mean Deviation from median and its coefficient for the following distribution
![]()
Calculate Standard Deviation and its coefficient.
![]()
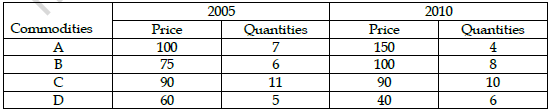
24 Calculate Index numbers for the year 2010 considering 2005 as the base year using the following methods:
a. Laspeyer’s Method.
b. Paasche’s Method.
Please click on below link to download CBSE Class 11 Economics Question Paper Set U Solved
Free study material for Economics
CBSE Class 11 Economics Question Paper Set 21 Solved
To understand the types of questions asked in past examinations, it is very important for Class 11 students to solve the CBSE Class 11 Economics Question Paper Set 21 Solved provided above. You can easily download these past papers for Class 11 Economics in PDF format for the last 10 years. By practicing these actual exam questions you will gain an understanding of the difficulty level and the variety of topics covered over the years. By solving these Previous Year Papers (PYPs) you will understand both descriptive and MCQ questions in your final tests.
Importance of solving CBSE Class 11 Economics Question Paper Set 21 Solved
Regularly practicing CBSE Class 11 Economics Question Paper Set 21 Solved is the best way to improve your score in Class 11 Economics. These papers will give you details of the marking scheme and the paper structure used by the CBSE. By regularly attempting these under actual exam conditions at home, you can slowly improve your time management skills, which will help you to complete your Economics paper within the allowed duration.
Benefits of downloading CBSE Class 11 Question Papers
Having the CBSE Class 11 Economics Question Paper Set 21 Solved in PDF format allows you to revise key concepts anywhere, even without an internet connection. These sets are a reliable tool to practice numerical problems and understand the correct approach to all types of answers. After solving the questions, you should compare your work with the solutions provided by our teachers. Along with these papers, students should always solve the Class 11 Economics Sample Papers and MCQ tests on studiestoday.com for a complete revision.
FAQs
The CBSE Class 11 Economics Question Paper Set 21 Solved is available for download on StudiesToday.com. It includes complete set with all sections so that Class 11 students can practice with the exact same paper that came in the CBSE exams.
Yes, the solutions for CBSE Class 11 Economics Question Paper Set 21 Solved are prepared by subject matter experts as per official marking scheme. Class 11 students will understand the structure of answers and 'step-marks' methodology Economics.
Solving previous year papers like CBSE Class 11 Economics Question Paper Set 21 Solved is important to understand repeat themes and question difficulty levels of Economics. It helps Class 11 students to test their time management skills too.
Yes, where applicable, CBSE Class 11 Economics Question Paper Set 21 Solved is available in both English and Hindi mediums. All students from Class 11 can access Economics study material in their preferred language.
No, all previous year question papers on StudiesToday, including CBSE Class 11 Economics Question Paper Set 21 Solved, are provided free of charge in mobile-friendly PDF.