
Get the most accurate NCERT Solutions for Class 11 Economics Chapter 7 Index Numbers here. Updated for the 2026-27 academic session, these solutions are based on the latest NCERT textbooks for Class 11 Economics. Our expert-created answers for Class 11 Economics are available for free download in PDF format.
Detailed Chapter 7 Index Numbers NCERT Solutions for Class 11 Economics
For Class 11 students, solving NCERT textbook questions is the most effective way to build a strong conceptual foundation. Our Class 11 Economics solutions follow a detailed, step-by-step approach to ensure you understand the logic behind every answer. Practicing these Chapter 7 Index Numbers solutions will improve your exam performance.
Class 11 Economics Chapter 7 Index Numbers NCERT Solutions PDF
NCERT Solution for Class 11 Statistics for chapter 8 Index Numbers
Exercises:
Question1. An index number which accounts for the relative importance of the items is known as
I. Weighted index
II. Simple aggregative index
III. Simple average index
Answer: I. Weighted index
Weighted index number is an index number in which different items are given different importance in terms of different weights.
Question2. In most of the weighted index numbers the weights pertains to
I. Base year
II. Current year
III. both base and current year
Answer: II. Current year
In most of the weighted index numbers the weights pertains to current year because we want to know how the price/quantity has changed in current year from the level of base year.
Question3. The impact of change in the price of the commodity with little weight in the index will be
I. Small
II. Large
III. Uncertain
Answer: I. small
Whether the change in price will be reflected in a price index number or not depends on the weight associated with the item. Lower or negligible weight reflects lower or negligible change in the index number and higher weight reflects higher change in the index number.
Question4. A consumer price index measures changes in
I. Retail prices
II. Wholesale prices
III. Producers prices
Answer: II. Wholesale prices
From 2014, the Reserve Bank of India (RBI) has adopted the new Consumer Price Index (CPI) as the key measure of inflation.
Question5. The item having the highest weight in consumer price index for industrial workers is
I. Food
II. Housing
III. Clothing
Answer: I. Food
Food is the most essential commodity for living. Industrial workers have to spend more on food because they are engaged in physical labour.
Question6. In general, inflation is calculated by using
I. Wholesale price index
II. Consumer price index
III. Producer’s price index
Answer: I. Wholesale price index
In general, inflation is calculated by using the wholesale price index. The formula used is:
Rate of inflation = [(WPI of current year/WPI of previous year) X 100] – 100
Question7. Why do we need an index number?
Answer: Index numbers are the statistical tools which measure the changes in the magnitude of a variable with respect to chosen base year. They measure average change in a group of related variables over two different situations. The changes measured are from time to time or from place to place. They are usually expressed in percentages. Index number is one of the most widely used statistical tools. Index numbers are now-a-days called economic barometers. The importance of index numbers can be judged from the following points:
1. Helpful in measuring changes in value of money: Index numbers are widely used in the measurement of changes in the value of money. The value of money depends on its purchasing power which in turn depends on the prices of the commodities.
Purchasing power of money = 1/ consumer price index Real income or wages= (Money income or wages/Consumer price index) × 100
The change in price inversely affects the value of money. Thus, the price index number throws light on the change of the value of money.
2. Helpful to policy makers: Index numbers serve as a useful guide to the business community in planning their decisions. The employers depend upon the cost of living index for deciding the increase in the dearness allowances of their employees. Index numbers play the role of essential guide in policy formulation related to inflation, unemployment, agricultural, industrial production etc.
3. There are certain changes whose measurements are not possible without index number Index numbers make possible the measurement of relative changes of a group of related variables.
4. With the help of index numbers, the comparative study of changes in two variables becomes easy.
5. Index numbers help us to study the general trend of a phenomenon so as to draw important conclusions.
6. Index numbers help to determine real rise or fall in per capita income.
Question8. What are the desirable properties of the base period?
Answer: While constructing index numbers, we have to select two years, i.e. the base year and the year of comparison. Base year is the period against which comparisons are to be made. The selection of the base year is very important.
The following points need to be considered while selecting the base year:
i)The base year should be a normal one. The year selected as base year should be free from abnormal conditions like war, droughts, famines, earthquakes, booms, depressions etc.
ii)It should not be too near or too far from the current year. While selecting the base year, choice has to be made between fixed base and chain base methods. In the fixed base method, we take a particular year as the base year and express changes in items on the basis of this year. Whereas in the chain based method, the base year goes on changing. For every successive year, the preceding year is taken as base year.
Question9. Why is it essential to have different CPI for different categories of consumers?
Answer: CPI, Consumer price index is a measure of average change in retail prices. It indicates the average change in the price paid by the final consumer for specified quantity of goods and services over a period of time. Different classes are getting affected differently by a change in the price level because different people consume different types of goods, consumer’s habit differs from individual to individual, place to place, strata to strata, etc. So, it is essential to have different CPI for different categories of consumers because the nature of consumption basket of consumers from different economic status varies hugely.
Question10. What does a consumer price index for industrial workers measure?
Answer: A consumer price index number for industrial workers measures the impact of price rise on the cost of living of common people i.e. general inflation. Over time, it is increasingly considered as the appropriate indicator of general inflation because it shows the most accurate impact of price rise on the cost of living.
Question11. What is the difference between price index and quantity index?
Answer:
|
Price Index |
Quantity Index |
|
A price index is related to price and measures the change in prices in two periods. |
A quantity index is related to quantity and measures the changes in production, sales, consumption, etc. in two periods. |
|
It indicates the changes in monetary value. |
It indicates the changes in the physical volume of production. |
Question12. Is the change in any price reflected in a price index number?
Answer: The change in any price may or may not be reflected in a price index number. An index number shows changes in terms of average. For example, when it is said that index number in 2012-13 has risen to 110, it means that prices of all goods and services have increased by 10% on average. However, it does not mean that prices of all goods and services have uniformly risen by 10%. The price of a particular good might have risen by more than 10% or less than 10% or even might have not change. Whether the change in price will be reflected in a price index number or not depends on the weight associated with the item. Lower or negligible weight reflects lower or negligible change in the index number and higher weight reflects higher change in the index number.
Question13. Can the CPI for urban non-manual employees represent the changes in the cost of living of the President of India?
Answer: An index number calculated for the employees who are deriving 50 % or more of his or her income from gainful employment on non-manual work in the urban non-agricultural sector, is termed as consumer price index for non-manual employees. Since the president of India is residing in urban area and is doing non-manual work in non-agricultural sector, so CPI for urban non- manual employees represents the changes in the cost of living of the President of India.
Question14. The monthly per capita expenditure incurred by workers for an industrial centre during 1980 and 2005 on the following items are 75, 10, 5, 6 and 4 respectively. Prepare a weighted index number for cost of living for 2005 with 1980 as the base.
|
Items |
Price in 1980 |
Price in 2005 |
|
Food |
100 |
200 |
|
Clothing |
20 |
25 |
|
Fuel & lighting |
15 |
20 |
|
House rent |
30 |
40 |
|
Misc |
35 |
65 |
Answer:
|
Items |
Price in 1980, P0 |
Price in 2005, P1 |
W |
R=P1X100 PO |
RW |
|
Food |
100 |
200 |
75 |
200 |
15000 |
|
Clothing |
20 |
25 |
10 |
125 |
1250 |
|
Fuel & lighting |
15 |
20 |
5 |
133.33 |
666.65 |
|
House rent |
30 |
40 |
6 |
133.33 |
799.98 |
|
Misc |
35 |
65 |
4 |
185.71 |
742.84 |
|
100 |
Cost of Living= Σ RW/ Σ W
Cost of Living= 742.84/100 = 18462.47/100 = 184.6247
It shows cost of living has increased by 84.62 % i.e. a consumer needs Rs 184.62 in 2005.
Question15. Read the following table carefully and give your comments.
|
Index of industrial production base 1993-94 |
|||
|
Industry |
Weight in % |
1996-97 |
2003-04 |
|
General Index |
100 |
130.8 |
189.0 |
|
Mining and quarrying |
10.73 |
118.2 |
146.9 |
|
Manufacturing |
79.58 |
133.6 |
196.6 |
|
Electricity |
10.69 |
122.0 |
172.6 |
Answer: The following comments can be made from the given table:
- In the given table highest weight is given to manufacturing i.e. around 79.58 % as compared to mining and quarrying and electricity whose weights are 10.73 % and 10.69 % respectively.
- As compared to the year 1993-94, general production has increased from 30.8 % to 89 % in 1996-97 and 2003-04 respectively.
- The manufacturing sector’s performance is the best in both the years as compared to other two sectors. It has risen around 63 % from 1996-97 to 2003-04.
- The mining and quarrying sector is the least growing sector as compared to other sectors.
Question16. Try to list the important items of consumption in your family.
Answer: The following are the important items of consumption in our family:
- Food
- Cloth
- Electricity
- Education
- School bag
- Books
- Utensils
- Household appliances, etc.
Question17. If the salary of a person in the base year is Rs 4000 per annum and the current year salary is Rs 6000, by how much should his salary be raised to maintain the same standard of living if the CPI is 400?
Answer: Salary of base year = Rs 4000
Salary of current year = Rs 6000
CPI = 400
If the current year CPI is 400 thus, to maintain the base year standard of living the salary should be raised to
{(CPI X Salary of base year)/100 = (400 X 4000)/100 =} Rs 16000
Thus, person’s salary should be Rs 16000 in current year, but it has increased to Rs 6000 only. Therefore, his salary should be raised to maintain the same standard of living if the CPI is 400, by (16000 – 6000 =) Rs 10000.
Question18. The consumer price index for June, 2005 was 125. The food index was 120 and that of other items 135. What is the percentage of the total weight given to food?
Answer: The price index for June 2005 = 125
Food index = 120
Index for other items = 135
Assume weight assign to food is W1 and to other items is W2.
We know the sum of total weights is 100 i.e. W1+ W2 = 100.
|
Items |
Index, I |
Weights, W |
WI |
|
Food |
120 |
W1 |
120 W1 |
|
other items |
135 |
W2 |
135 W2 |
|
W1+ W2 = 100 |
120 W1+ 135 W2 |
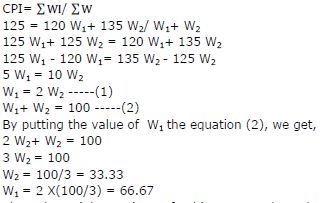
Thus, the weights assign to food is 66.67 and to other items are 33.33.
Question19. An enquiry into the budgets of the middle class families in a certain city gave the following information:
|
Expenses on items |
Food |
Fuel |
Clothing |
Rent |
Misc. |
|
35% |
10% |
20% |
15% |
20% |
|
|
Price (in Rs ) in 2004 |
1500 |
250 |
750 |
300 |
400 |
|
Price (in Rs ) in 1995 |
1400 |
200 |
500 |
200 |
250 |
What is the cost of living index during the year 2004 as compared with 1995?
Answer:
|
Expenses on items |
Food |
Fuel |
Clothing |
Rent |
Misc. |
|
|
Price (in Rs ) in 2004 = P1 |
1500 |
250 |
750 |
300 |
400 |
|
|
Price (in Rs ) in 1995 = P0 |
1400 |
200 |
500 |
200 |
250 |
|
|
W |
35 |
10 |
20 |
15 |
20 |
|
|
R=P1X100 PO |
107.14 |
125 |
150 |
150 |
160 |
|
|
RW |
3749.9 |
1250 |
3000 |
2250 |
3200 |
13499.9 |
Cost of Living= Σ RW/ Σ W
Cost of Living= 13499.9/100 = 134.999
It shows the cost of living has increased by 135 i.e. a consumer need Rs 135 in 2004.
Question20. Record the daily expenditure, quantities bought and prices paid per unit of the daily purchases of your family for two weeks. How has the price change affected your family?
Answer: Answer may vary.
|
Week I |
|||||||
|
Tomato |
Potato |
Total Expenditure |
|||||
|
Price (Rs /Kg) |
Quantity Purchased |
Expenditure |
Price (Rs /Kg) |
Quantity Purchased |
Expenditure |
||
|
Monday |
20 |
0.5 |
10 |
20 |
1 |
20 |
30 |
|
Tuesday |
10 |
2 |
20 |
25 |
.5 |
12.5 |
32.5 |
|
Wednesday |
15 |
1 |
15 |
15 |
1.5 |
7.5 |
22.5 |
|
Thursday |
10 |
1 |
10 |
25 |
1 |
25 |
35 |
|
Friday |
20 |
1 |
20 |
30 |
1.5 |
45 |
65 |
|
Saturday |
15 |
.5 |
7.5 |
20 |
.5 |
10 |
17.5 |
|
Sunday |
25 |
.25 |
6.25 |
25 |
1 |
25 |
31.5 |
|
Week II |
|||||||
|
Tomato |
Potato |
Total Expenditure |
|||||
|
Price (Rs /Kg) |
Quantity Purchased |
Expenditure |
Price (Rs /Kg) |
Quan tity Purchased |
Expenditure |
||
|
Monday |
25 |
0.5 |
12.5 |
20 |
1.5 |
30 |
42.5 |
|
Tuesday |
20 |
1 |
20 |
20 |
1 |
20 |
40 |
|
Wednesday |
20 |
.5 |
10 |
15 |
2 |
30 |
40 |
|
Thursday |
15 |
1 |
15 |
20 |
1.5 |
30 |
45 |
|
Friday |
10 |
2 |
20 |
25 |
.5 |
12.5 |
32.5 |
|
Saturday |
15 |
1 |
15 |
15 |
2 |
30 |
45 |
|
Sunday |
20 |
.5 |
10 |
20 |
1 |
20 |
30 |
We have observed that when prices are high my family is purchasing lesser quantity of goods. It will result in lesser expenditure made on the goods as compared to the expenditure made when prices are lower. As we can see that on Monday (first week), the price of tomato was Rs 20, the quantity purchased was 0.5 kg and the total expenditure made on tomato was Rs 10. When the price of tomato fell down to Rs 10 on Tuesday, the quantity purchased increased to 2 Kg, hence expenditure made was Rs 20. It shows the negative relation between price of the goods and demand for the goods. The same is observed in week II across commodities.
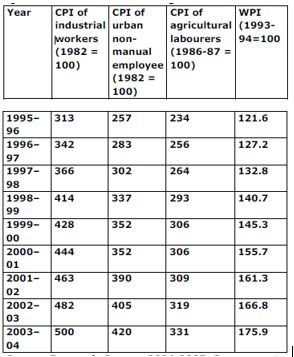
Source: Economic Survey, 2004-2005, Government of India
(i) Comment on the relative values of the index numbers.
(ii) Are they comparable? Answer:
(i) A consumer price index number for industrial workers measures the impact of price rise on the cost of living of common people i.e. general inflation.
An index number calculated for the employees who are deriving 50 % or more of his or her income from gainful employment on non-manual work in the urban non- agricultural sector is termed as consumer price index for non-manual employees.
Index Number of Agricultural Production (IAP) records the changes in agricultural production. It is used to study the rise and fall of the yield of crops from one period to other period.
Wholesale price index number refers to index number that measures the average changes in the wholesale price. It is an indicator of change in the general price level.
(ii) The given data of each category i.e. CPI of industrial workers, CPI of urban non-manual employee, CPI of agricultural labourers and WPI are comparable with themselves over given time period.
CPI of industrial workers and CPI of urban non-manual employee can be compared with each other because they have the same base year but rests of the categories are not comparable.
Free study material for Economics
NCERT Solutions Class 11 Economics Chapter 7 Index Numbers
Students can now access the NCERT Solutions for Chapter 7 Index Numbers prepared by teachers on our website. These solutions cover all questions in exercise in your Class 11 Economics textbook. Each answer is updated based on the current academic session as per the latest NCERT syllabus.
Detailed Explanations for Chapter 7 Index Numbers
Our expert teachers have provided step-by-step explanations for all the difficult questions in the Class 11 Economics chapter. Along with the final answers, we have also explained the concept behind it to help you build stronger understanding of each topic. This will be really helpful for Class 11 students who want to understand both theoretical and practical questions. By studying these NCERT Questions and Answers your basic concepts will improve a lot.
Benefits of using Economics Class 11 Solved Papers
Using our Economics solutions regularly students will be able to improve their logical thinking and problem-solving speed. These Class 11 solutions are a guide for self-study and homework assistance. Along with the chapter-wise solutions, you should also refer to our Revision Notes and Sample Papers for Chapter 7 Index Numbers to get a complete preparation experience.
FAQs
The complete and updated is available for free on StudiesToday.com. These solutions for Class 11 Economics are as per latest NCERT curriculum.
Yes, our experts have revised the as per 2026 exam pattern. All textbook exercises have been solved and have added explanation about how the Economics concepts are applied in case-study and assertion-reasoning questions.
Toppers recommend using NCERT language because NCERT marking schemes are strictly based on textbook definitions. Our will help students to get full marks in the theory paper.
Yes, we provide bilingual support for Class 11 Economics. You can access in both English and Hindi medium.
Yes, you can download the entire in printable PDF format for offline study on any device.